
Abstract
In the Raman spectrum of B-type carbonated apatites, the ν1 CO32– mode (at ∼1070 cm–1) overlaps the ν3 PO43– band. The latter is readily observed where the CO32– content is low (up to ∼3 wt%). The CO32– content of bone is considerably higher (∼7–9 wt%). As a result, the ν3 PO43– band becomes completely obscured. The 1000–1100 cm–1 spectral range of carbonated apatite is frequently considered a combined ν3 PO43– and ν1 CO32– region. Here, high-resolution polarized Raman spectroscopy (step size of 0.74 ± 0.04 cm–1) provides new insights into synthetic hydroxyapatite (HAp) obtained as micrometer-sized fibers. Compared to bone mineral (deproteinized bovine bone), spectral features of HAp fibers are highly resolved. In particular, the ν3 PO43– band resolves into nine distinct sub-components: 1028, 1032, 1040, 1043, 1047, 1053, 1055, 1062, and 1076 cm–1. Parameters including full width half-maximum, intensity, area fraction, intensity ratio, and area fraction ratio vary between parallel and perpendicular polarized configurations. It is likely that the ν1 CO32– band of B-type carbonated apatites may contain a small but not insignificant contribution from the 1076 cm–1 sub-component of the ν3 PO43– band. Furthermore, the 1076 cm–1/1047 cm–1 ratio changes between parallel and perpendicular scattering configurations, suggesting that the contribution of the 1076 cm–1 sub-component may vary as a function of local orientation of bone mineral, thus skewing the ν1 CO32– band and compromising accurate estimation of carbonate-to-phosphate ratios in B-type CO32– substituted apatite.
Introduction
Synthetic- and natural-derived calcium phosphates, e.g., hydroxy- or hydroxy(l)apatite (HAp), are by far the most frequently used biomaterials for bone repair. 1 Naturally occurring (geological and biological) apatites can incorporate a plethora of anionic, cationic, and anionic complex substitutions. 2 Likewise, ion substitutions can be easily achieved in synthetic apatites in order to tailor chemical stability or degradation behavior, and bone/biological response. 3 Raman spectroscopy is frequently employed for nondestructive assessment of bone quality,4,5 and has been used extensively to study carbonate substitution in bone mineral, 6 which is considered an important marker of bone turnover. 7
In a typical Raman spectrum of B-type carbonated apatites (where CO32– substitutes for PO43–), the symmetric stretching ν1 CO32– (b2g) mode overlaps the antisymmetric stretching ν3 PO43– (a1g) band. The latter is observed up to ∼3 wt% CO32– but tends to be completely enveloped by the ν1 CO32– peak in bone, 8 where the CO32– content is significantly higher (∼7–9 wt%). 9 CO32– substitution for PO43– influences physical properties including crystallite size, solubility, and thermal stability of biological apatites, 10 in effect restricting mineral crystallinity to below that observed for carbonate-free apatites.
Polarized Raman spectroscopy has been used previously to investigate orientation dependence of bone mineral.11–13 Attributed to A- and B-type ν1 CO32– bands, previous investigations of scattering configuration dependence of the ν3 PO43– mode in carbonated fluorapatite have been unsuccessful in precisely locating the positions of individual sub-components. 14 Using high-resolution polarized Raman spectroscopy, this work investigates micrometer-sized fibers of carbonate-free synthetic HAp and carbonated apatite of bovine cortical bone to better understand the ν3 PO43– and ν1 CO32– overlap in B-type CO32– substituted apatite such as bone mineral in order to enable more accurate estimation and interpretation of carbonate-to-phosphate ratios.
Materials and Methods
Synthetic HAp Fibers and Bovine Bone Mineral
The HAp fibers were obtained by dispersing 5–80 nm apatite particles in an aqueous solution of 200 kDa pullulan (Sigma-Aldrich). This solution was extruded at 1.4 kg/cm 2 pressure while simultaneously discharging air at 250 m/s to form a stream of fibers. Using a far-infrared heater under the extrusion nozzles, the fiber stream was heated at 400 ℃ and blown onto a screen conveyor belt to produce a non-woven fabric that was further heated at a rate of 50 ℃ per hour and calcined at 1100 ℃ for one hour. 15 Commercially sourced (https://boneslices.com) bovine cortical bone stored in 96% ethanol was deproteinized using 5% sodium hypochlorite (Honeywell Fluka) for 16 h at 4 ℃ in order to isolate the inorganic/mineral phase.
Scanning Electron Microscopy and Micro-Raman Spectroscopy
The HAp fibers were visualized using scanning electron microscopy (Ultra 55 FEG SEM, Leo Electron Microscopy Ltd, UK) in the secondary electron mode. Micro-Raman spectroscopy was performed using a confocal Raman microscope (Renishaw inVia Qontor) equipped with a 633 nm laser and LiveTrack focus-tracking technology. The laser was focused down on to the sample surface using a × 100 (0.9 NA) objective. In the 390–1100 cm–1 spectral range (step size of 0.81 cm–1 at 390 cm–1 and 0.68 cm–1 at 1100 cm–1), the Raman scattered light was collected using a Peltier-cooled charge-coupled device deep depletion near-infrared-enhanced detector behind a 2400 g mm–1 grating, 10 s integration time, and 10 accumulations. Using a half-wave plate and polarization analyzer, spectra were collected in parallel
Statistical Analysis
For statistical analysis, the non-parametric Wilcoxon signed-rank test was used (SPSS Statistics, v.25, IBM Corporation) and p values < 0.05 were considered statistically significant. Mean values ± standard deviations are presented.
Results and Discussion
The HAp fibers were 3–15 µm thick (Fig. 1a) and carbonate-free (Fig. 1b), since characteristic Raman peaks attributable to CO32– ions in calcium phosphates or calcium carbonates were not detected.
16
The symmetric stretching mode, ν1 PO43–, was narrow (FWHM = 3.25 cm–1) and decreased in intensity by 68 ± 10% (p = 0.012) between polarization configurations, i.e., depolarization ratio of 0.32. The ν2 PO43– band consists of sub-components at 428 cm–1 and 450 cm–1, of which the ∼428 cm–1 sub-component appears least sensitive to polarization in terms of position, intensity, and shape. The ν4 PO43– band is comprised of sub-components at 579–580 cm–1, 590 cm–1 with a shoulder at 587 cm–1, 607 cm–1, and 614 cm–1. In comparison, the inorganic phase of bovine cortical bone exhibits a broader ν1 PO43– peak (FWHM = ∼17 cm–1), attributable to the poor crystallinity of bone mineral, and a strong ν1 CO32– band at ∼1072 cm–1. The ν1 CO32–/ν1 PO43– intensity ratio (∼0.18) does to change between polarization configurations. In addition, a wide shoulder is present in the 1025–1055 cm–1 range corresponding to the ν3 PO43– band. The individual sub-components of the ν2 PO43– and ν4 PO43– bands are poorly resolved.
(a) Micrometer-sized fibers of synthetic hydroxyapatite (HAp) observed using scanning electron microscopy. (b) The ν1 PO43− and ν3 PO43− bands in HAp fibers (magenta and blue) and deproteinised bovine bone (DBB; purple and green). Average Raman spectra normalized to the 428 cm−1 ν2 PO43− sub-component. Inset: The ν2 PO43− and ν4 PO43− bands. Sub-components of the ν2−, ν3− and ν4 PO43− bands are labelled a: 1047 cm−1, b: 1076 cm−1, c: 428 cm−1, d: 450 cm−1, e: 579 cm−1, f: 590 cm−1, g: 607 cm−1, and h: 614 cm−1.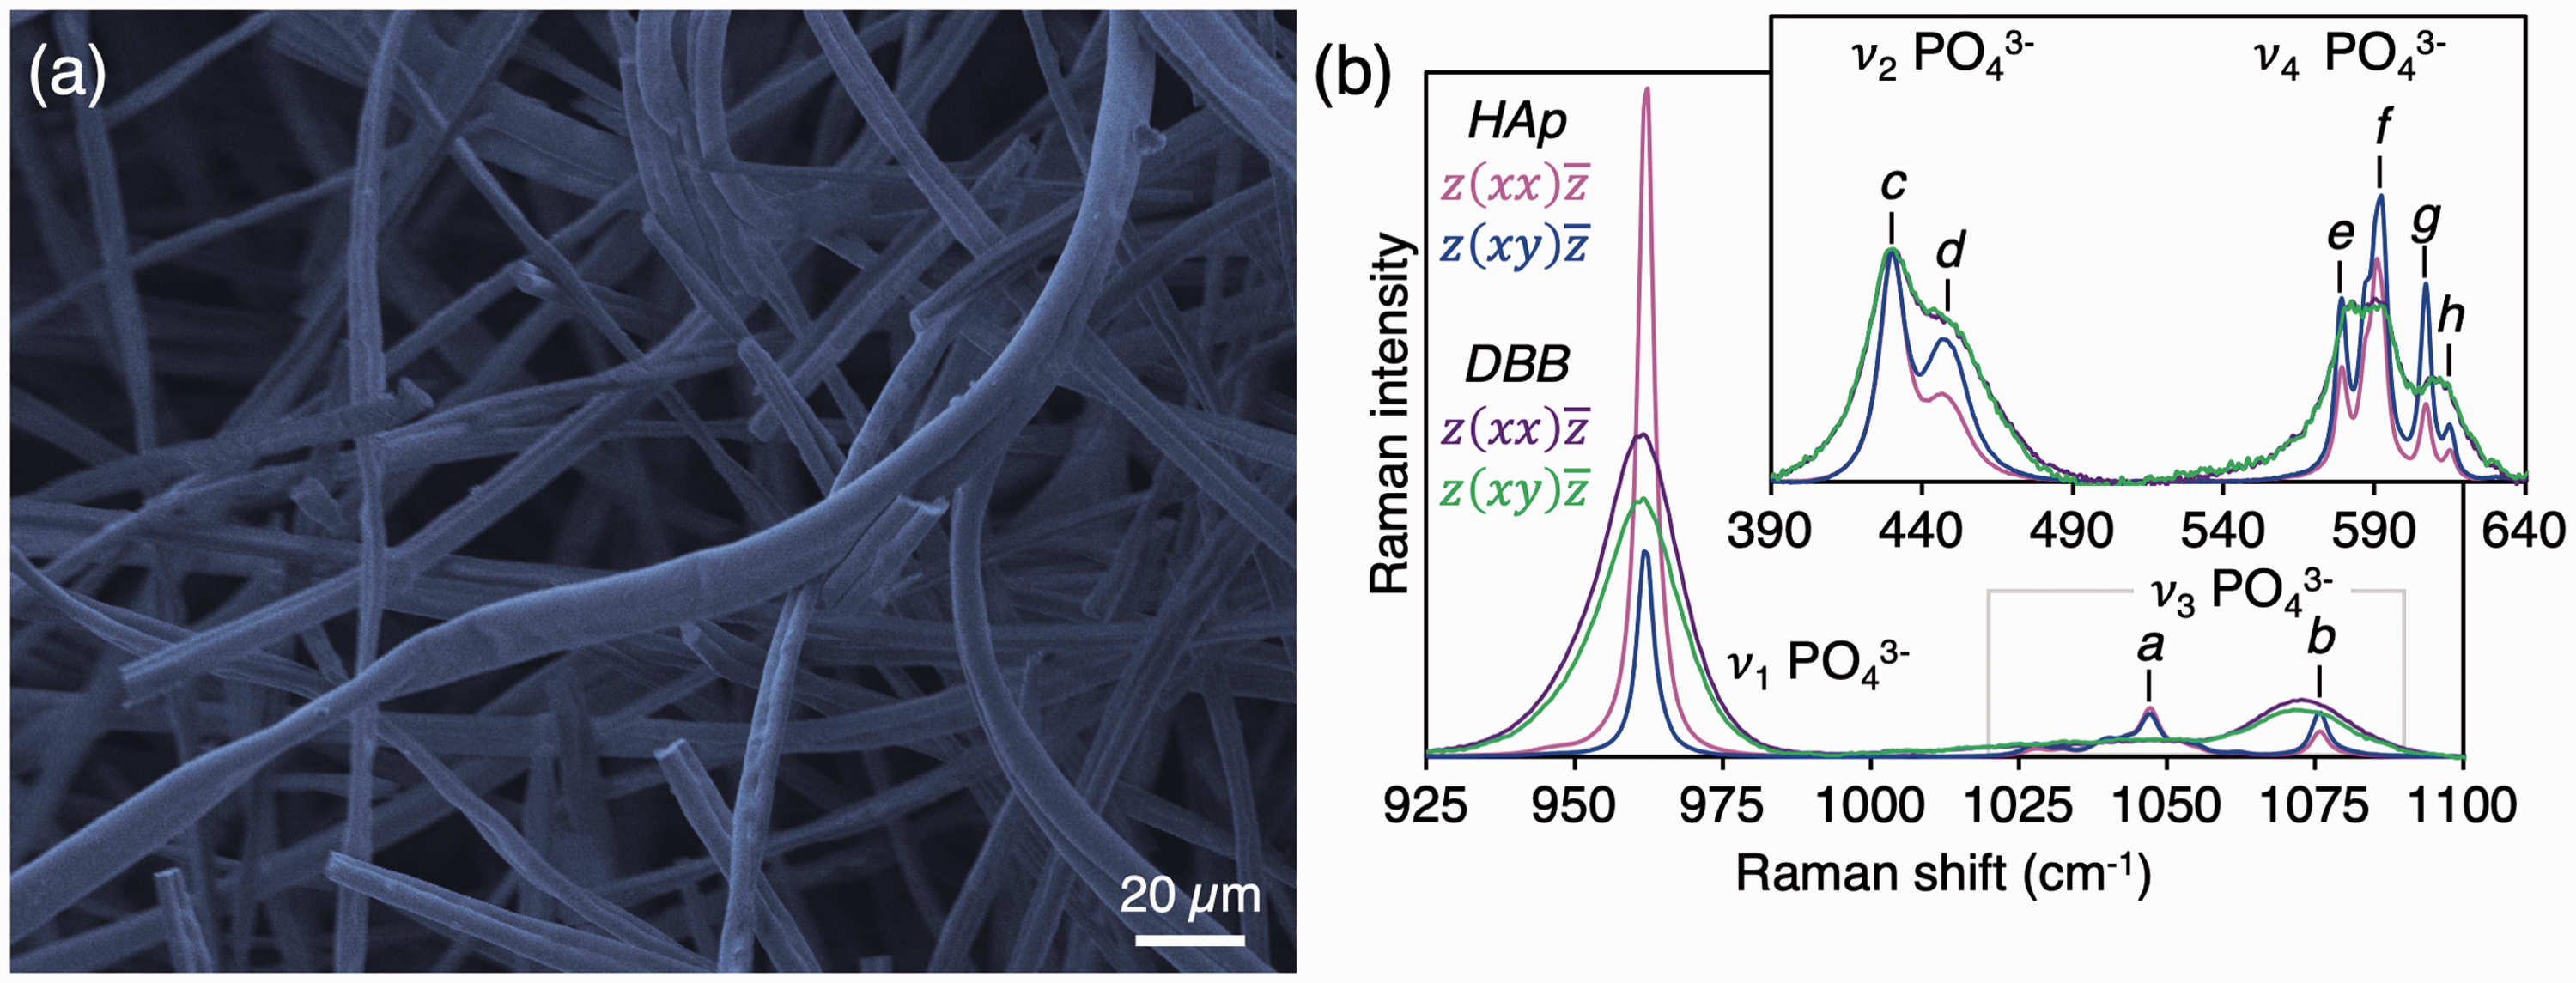
The profile of the ν3 PO43– mode of synthetic HAp fibers varies between scattering configurations. Second-derivative spectra reveal nine distinct inflection points in the 1020–1090 cm–1 range (Fig. 2). Previously, Awonusi et al.
8
have predicted six sub-components at 1029, 1040, 1047, 1053, 1062, and 1076 cm–1. However, each of the features at 1029, 1040, and 1053 cm–1 are found to resolve into two sub-components: 1028 cm–1 and 1032 cm–1, 1040 cm–1 and 1043 cm–1, and 1053 cm–1 and 1055 cm–1, respectively.
(a) The ν3 PO43– band in 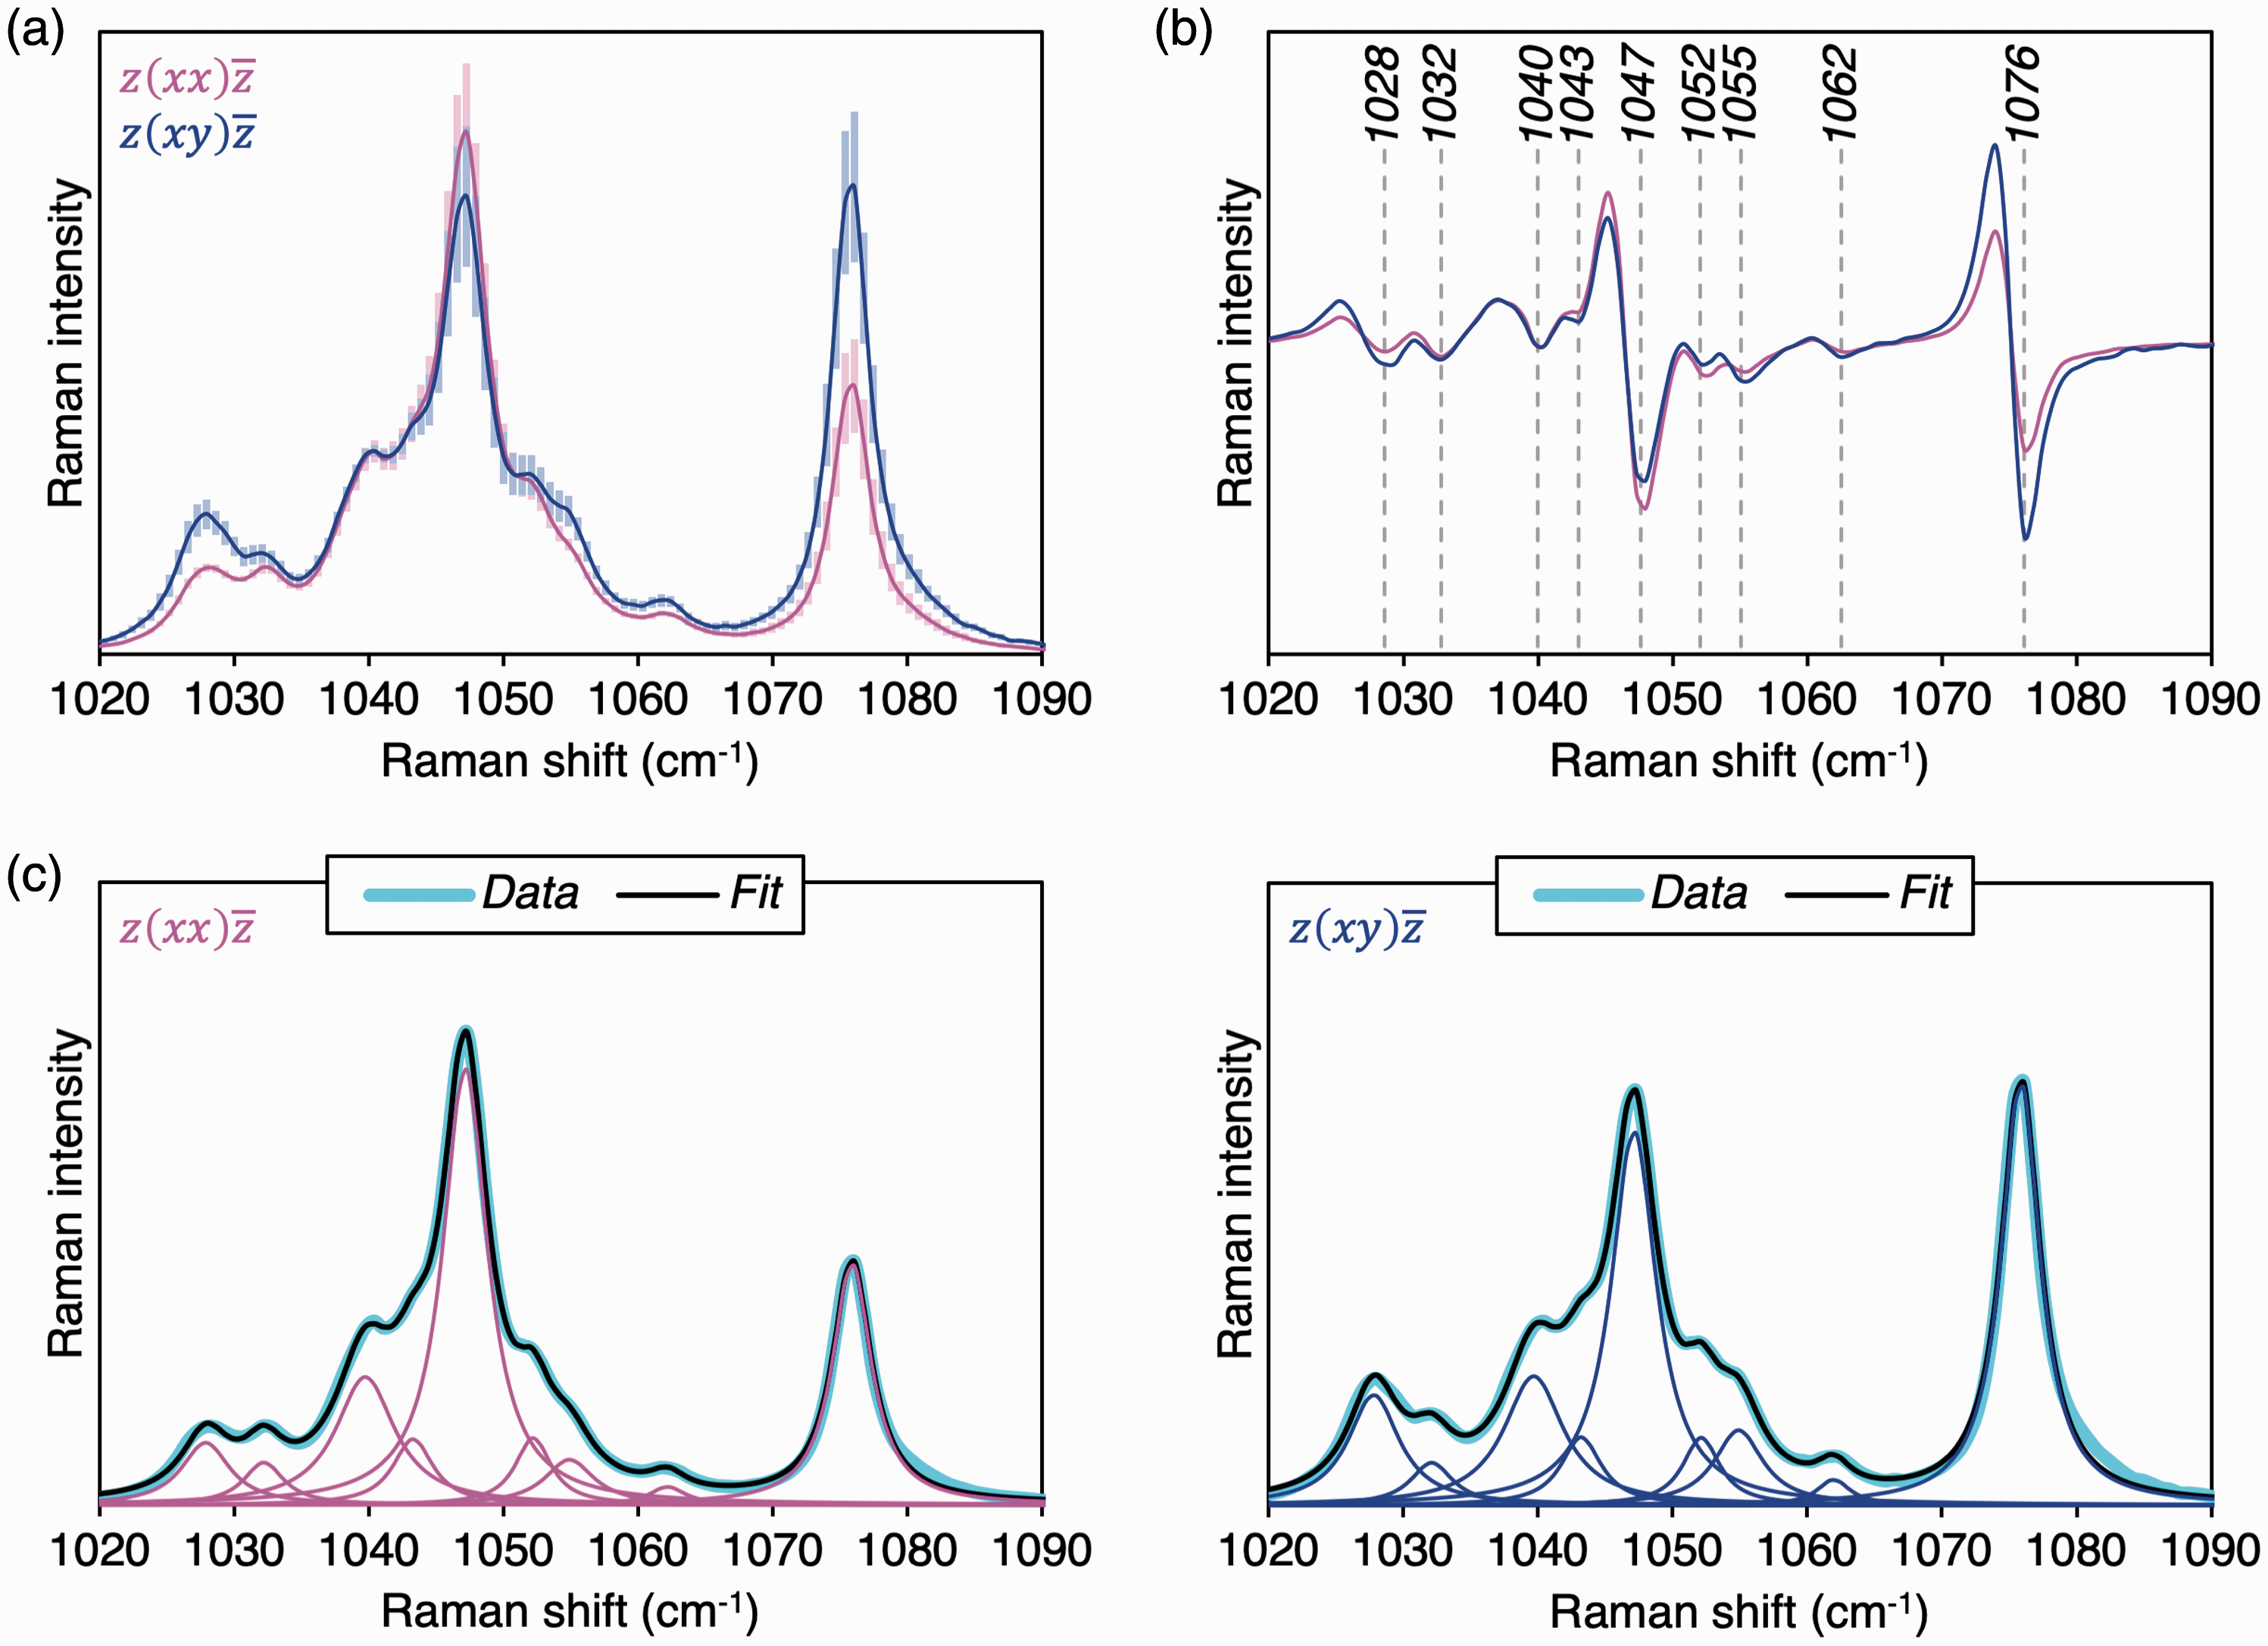
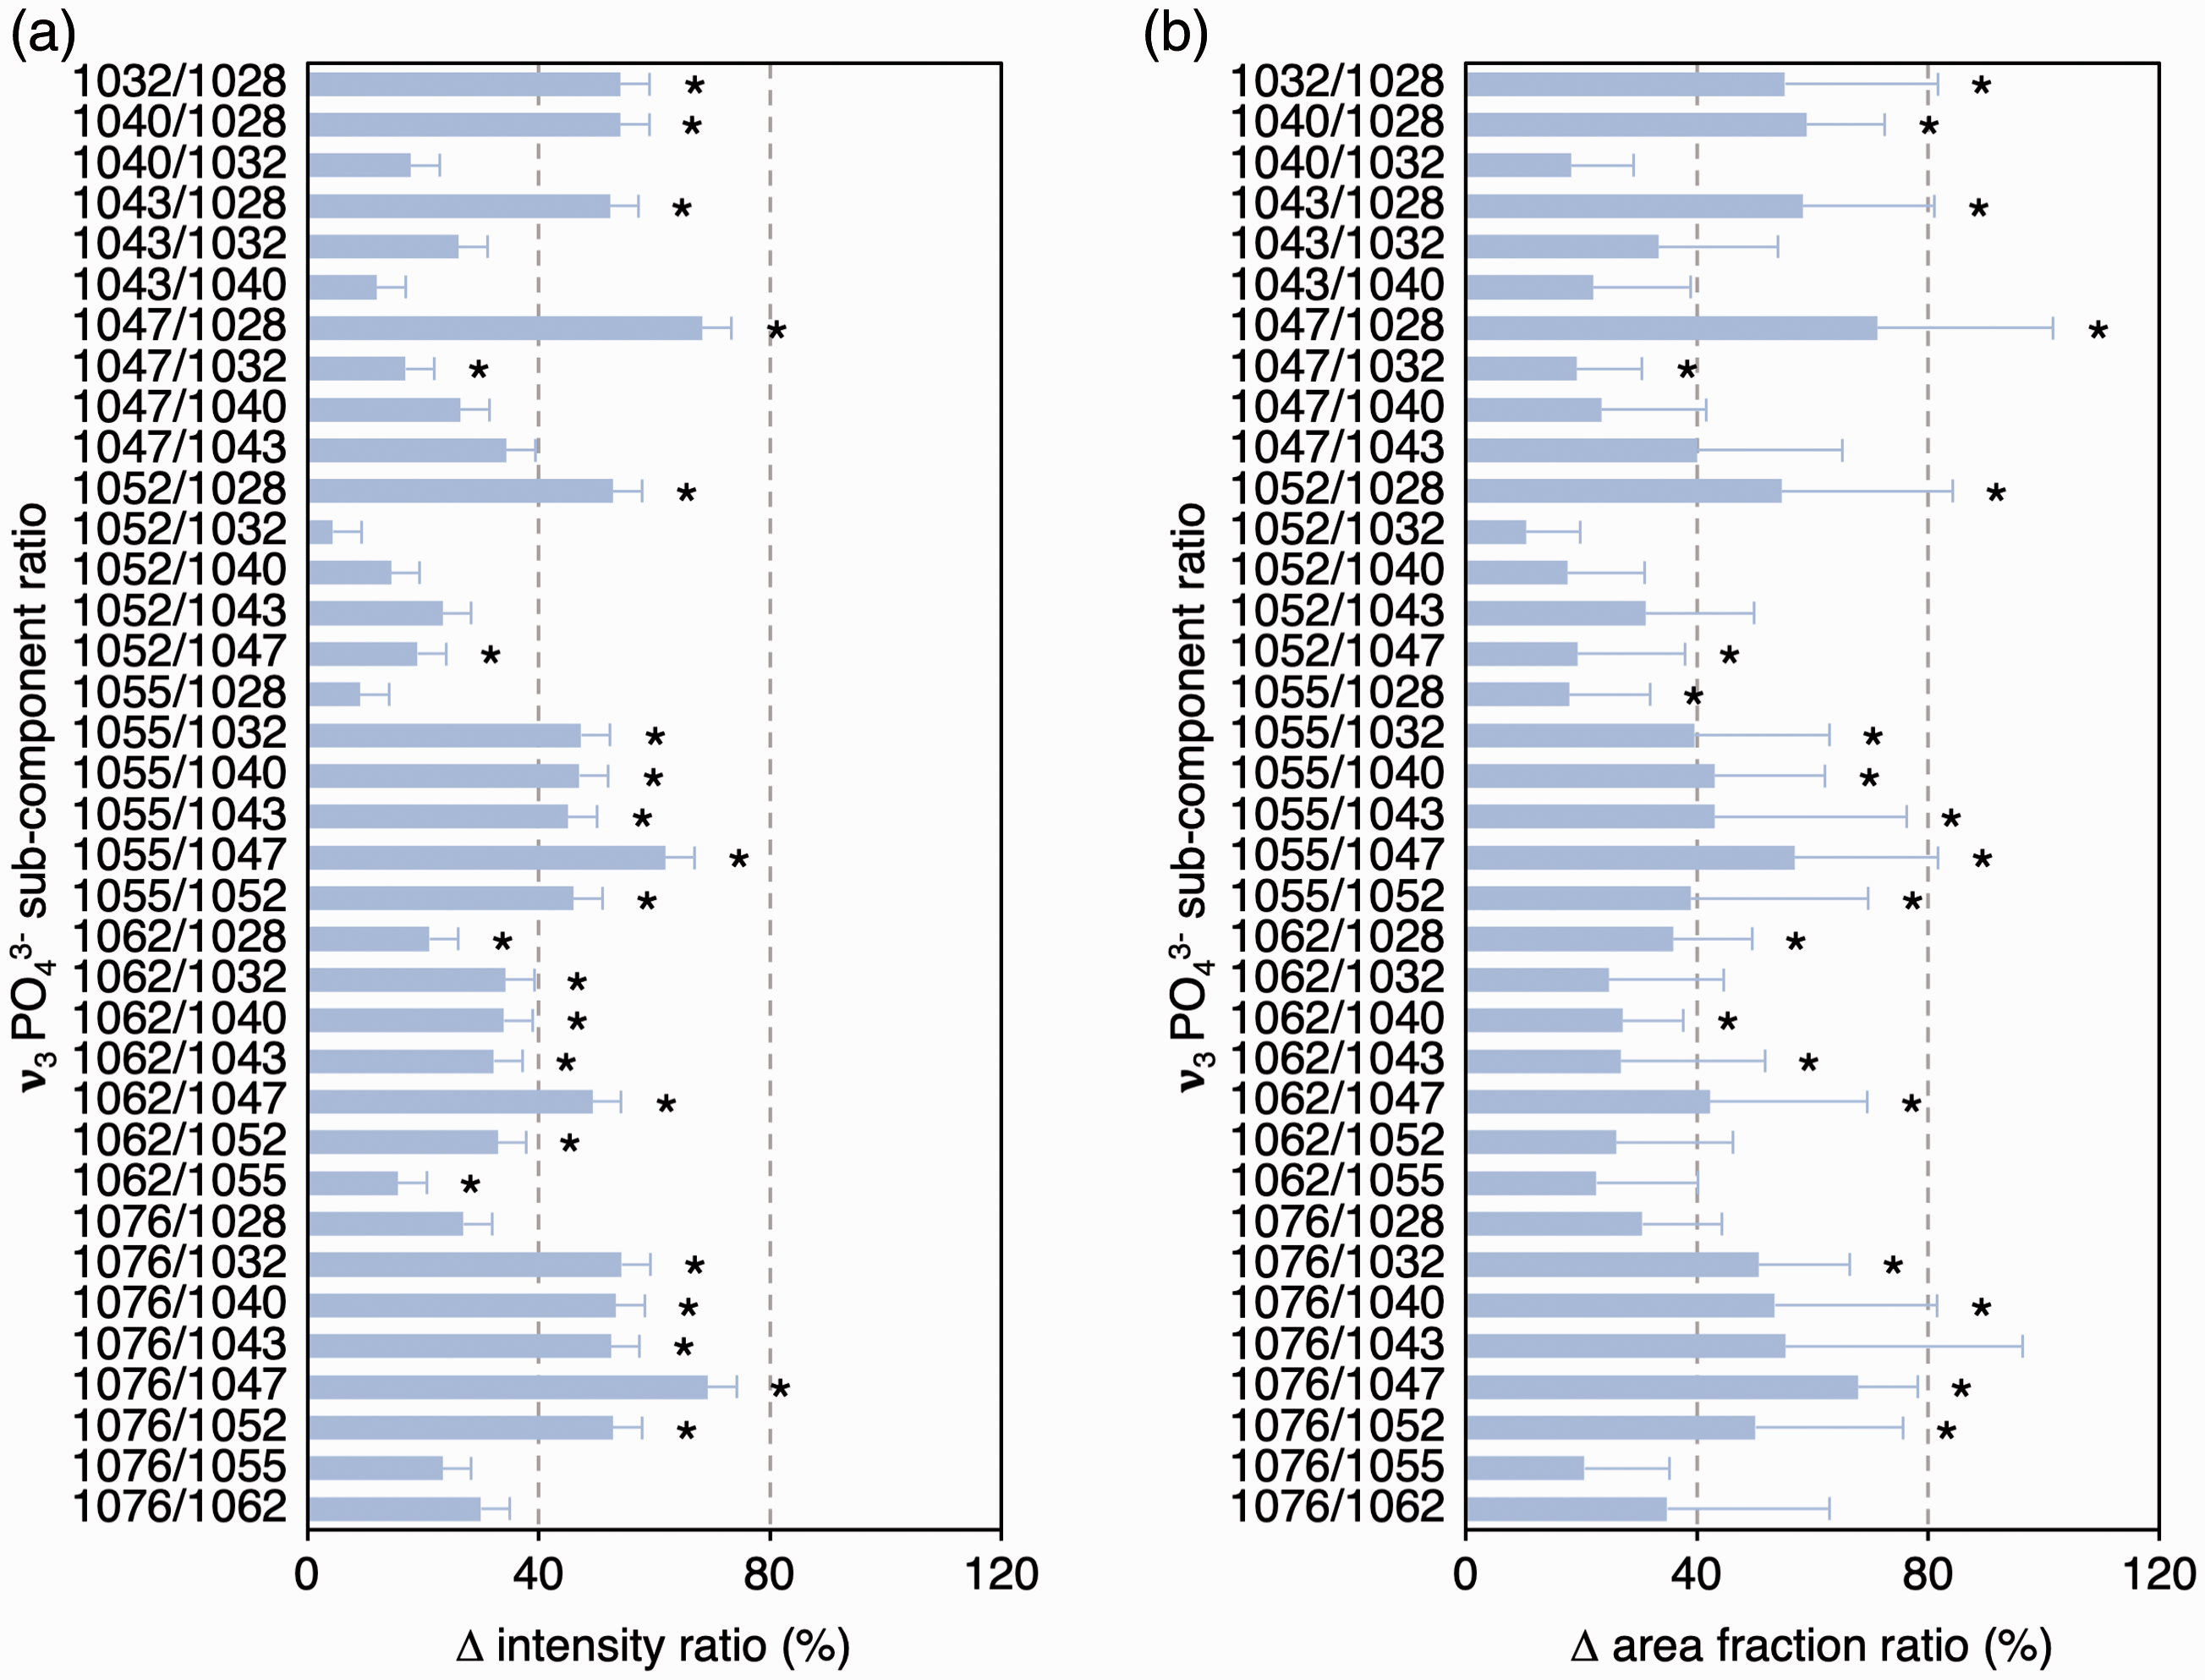
Between scattering configurations, ν3 PO43– sub-component positions remained consistent, while FWHM, intensities, and area fractions of several sub-components vary (Fig. 3), which alters the intensity ratios and area fraction ratios between individual sub-components. It is, therefore, demonstrated that ν3 PO43– band profile/shape is not conserved between polarization configurations and that the individual sub-components exhibit dissimilar levels of polarization dependency. Of particular significance is the relationship between 1076 cm–1 and 1047 cm–1 sub-components, which are two of the strongest features of the ν3 PO43– band. Attributable to increases in 1076 cm–1 sub-component intensity and area fraction, the 1076 cm–1/1047 cm–1 ratios differ by ∼68–69% (p = 0.012) between the polarization configurations (Fig. 4).
Polarization affects ν3 PO43– sub-component (a) FWHM, (b) intensity, and (c) area fraction. Wilcoxon signed-rank test (n = 8). Asterisk (*) denotes statistically significant difference between Polarization affects ν3 PO43– sub-component (a) intensity ratio and (b) area fraction ratios. Wilcoxon signed-rank test (n = 8). Asterisk (*) denotes statistically significant difference between 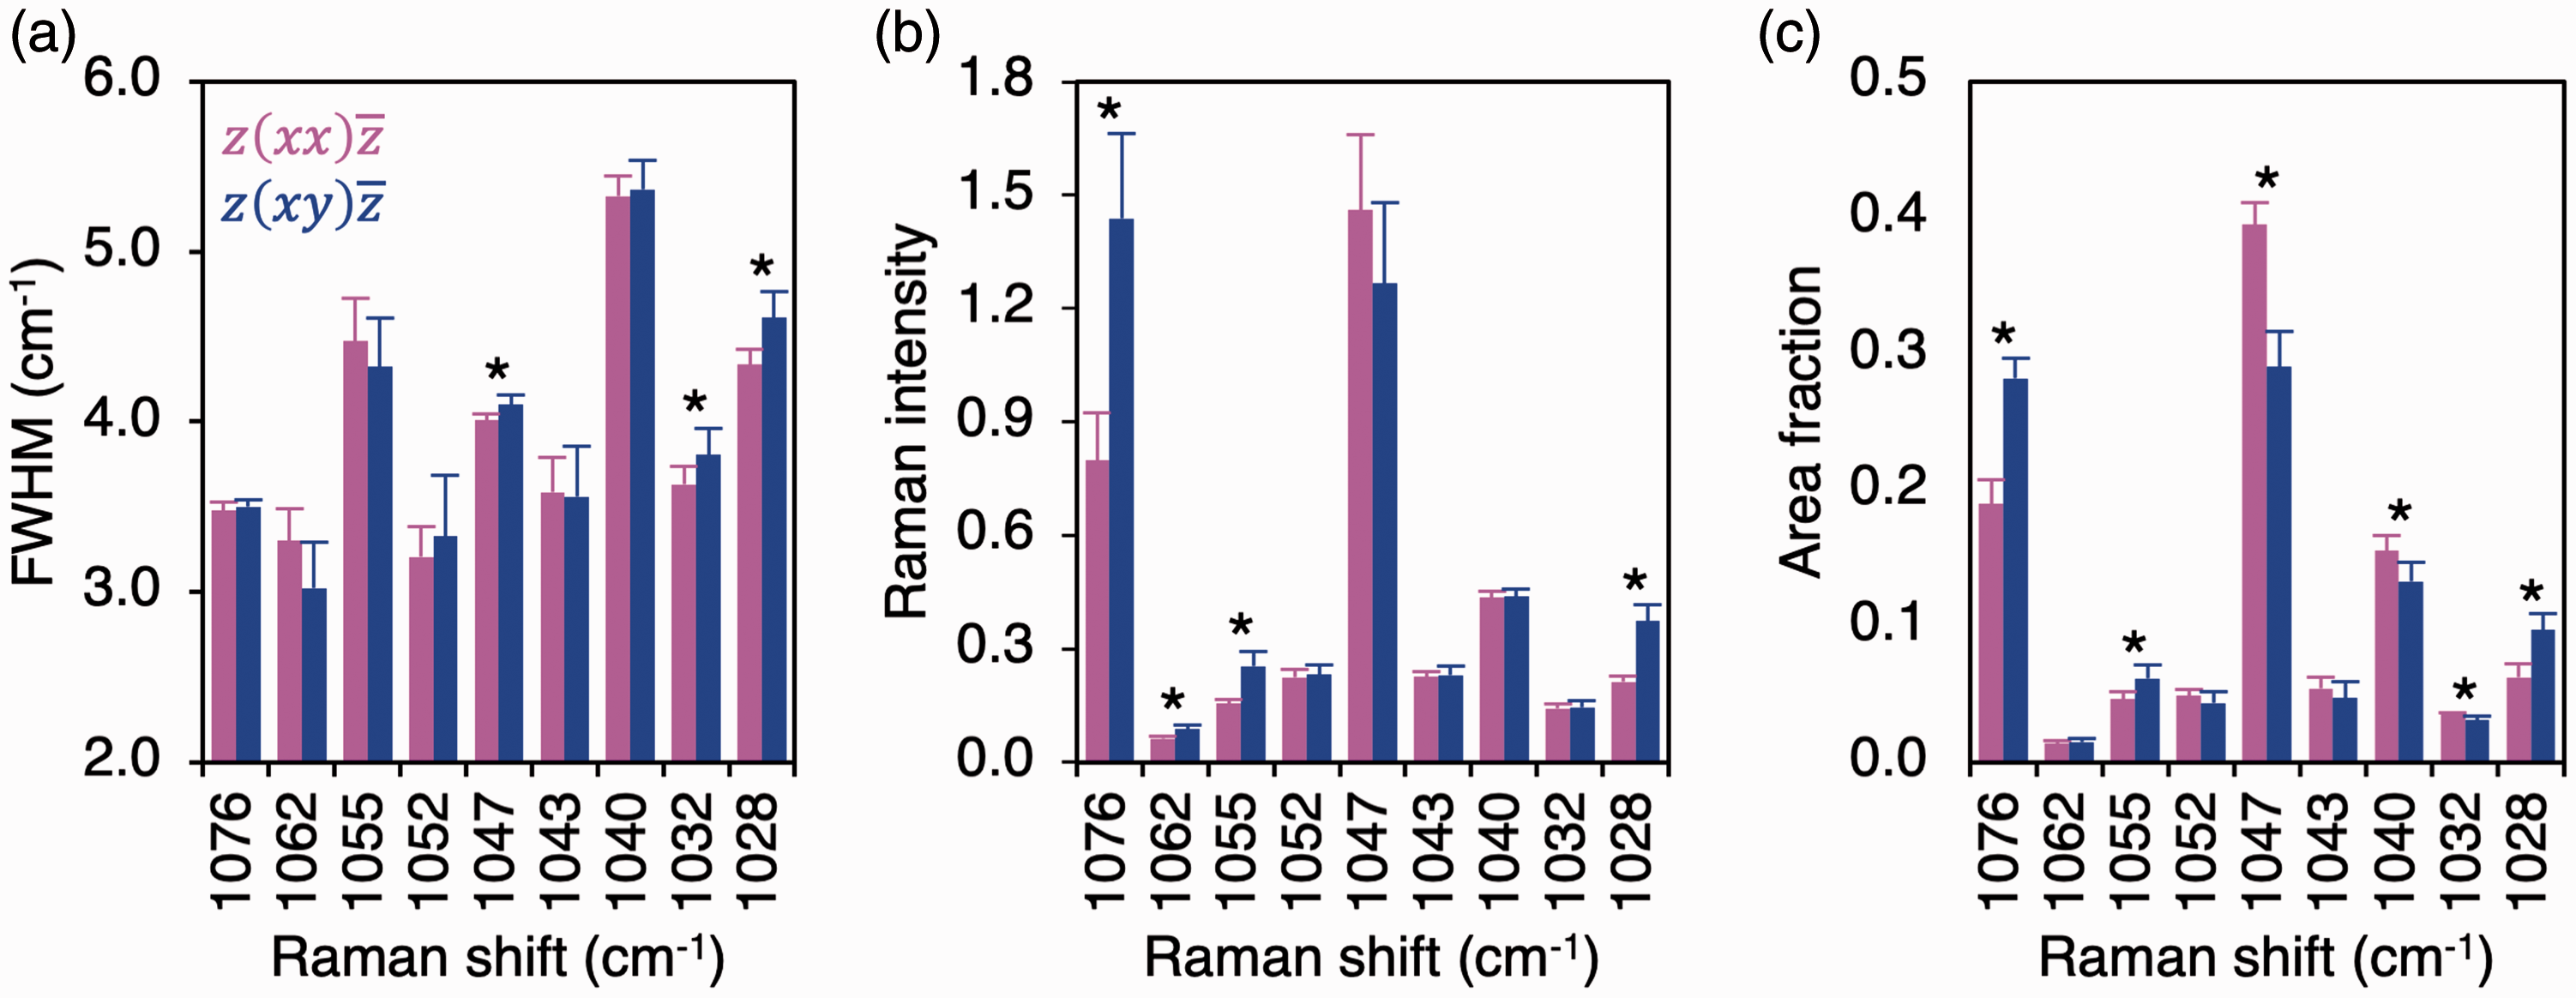
Biological apatites contain varying amounts of CO32–. The CO32– content of bone is taken as an indicator of bone maturation and turnover,7,17 and considerable attention is given to the carbonate-to-phosphate ratios of bone affected by compromised systemic conditions18–20 and bone surrounding implant biomaterials.21,22 It is likely that the 1076 cm–1 sub-component of the ν3 PO43– band contributes to the ν1 CO32– band, but remains a challenge to deconvolute. The scattering configuration dependency of the 1076 cm–1/1047 cm–1 ratio is also noteworthy. The contribution/intensity of the 1076 cm–1 sub-component may vary as a function of local, sub-micrometer/nanoscale orientation of bone mineral, thereby skewing the shape, intensity, and/or integral area of the ν1 CO32– band, thereby compromising the accuracy of carbonate-to-phosphate ratios in B-type CO32– substituted apatite.
Conclusion
The ν3 PO43– band in carbonate-free HAp fibers resolves into at least nine sub-components in the 1020–1090 cm–1 spectral range. Sub-component FWHM, intensities, area fractions, and intensity and area fraction ratios vary between
Footnotes
Acknowledgments
HAp fiber samples were kindly provided by Dr. Takayuki Miyahara.
Declaration of Conflicting Interests
The author(s) declared no potential conflicts of interest with respect to the research, authorship, and/or publication of this article.
Funding
This work was supported by the Svenska Sällskapet för Medicinsk Forskning (SSMF) postdoctoral scholarship, the Adlerbertska Foundation, the IngaBritt and Arne Lundberg Foundation, and the Hjalmar Svensson Foundation.