
Abstract
Distribution of substandard and falsified (SF) medicines is on the rise, and its impact on public health, particularly in low-resource countries, is becoming increasingly significant. Portable, nondestructive screening devices can support regulatory authorities in their defense against the spread of SF medicines. Vibrational spectroscopy is an ideal candidate due to its sampling ease and speed. In this work, five portable, among which four are considered low-cost, spectroscopic devices based on near-infrared (NIR), Raman, and mid-infrared (MIR) were evaluated to quantify active pharmaceutical ingredients (APIs) and formulation accuracy within simulated authentic, falsified, and substandard medicines. Binary sample mixtures containing a typical API in antimalarial, antiretroviral, or anti-tuberculosis medicines were assessed. In both univariate and multivariate analyses, the API quantification performance of the digital light processing (DLP) NIR spectrometer and a handheld Raman device consistently matched or exceeded that of the other NIR spectrometers and a scientific grade MIR spectrometer. In the formulation accuracy tests, data from all devices, other than the silicon photodiode array NIR spectrometer, were able to create regression models with less than 6% error. From this exploratory study, we conclude that certain portable NIR devices hold significant promise as cost-effective screening tools for falsified and potentially substandard medicines, and they warrant further investigation and development.
Keywords
Introduction
The World Health Organization (WHO) defines two classes of poor quality medicines, falsified and substandard.1,2 Falsified medicines refer to those deliberately and fraudulently mislabeled with respect to identity, content, or source. 3 Substandard medicines are genuine products that fail to meet quality standards such as dissolution or concentration of the active pharmaceutical ingredient (API). 4 The impacts of substandard and falsified (SF) medicines include treatment failure, antimicrobial resistance, or even death caused by consumption of medicines that are ineffective or at times toxic.5,6
It has been estimated that approximately 10% of medicines administered worldwide are substandard or falsified. 7 The problem of SF medicines is especially acute in areas where drug supply chains are under-regulated, with rates of SF medicines being highest in low-income countries. 8 Compounding the impact on global health is that the medicines used in low-income countries are disproportionately the most vital for preventing mortality, such as antimalarials. As a result, more than 31 000 deaths a year in sub-Saharan Africa alone have been attributed to SF medicines. 9 The worldwide impact of SF antibiotics has been estimated at greater than 72 000 deaths per year in the case of childhood pneumonia alone. 7
It has been proposed that the adoption of a portable field test for drug quality screening could improve the ability of national regulatory authorities to triage which samples to flag for compendial testing, thus better utilizing their limited resources. Optical spectroscopic techniques are a promising option for a portable field test due to their portability, low cost-per-test, speed, and minimal sample preparation requirements. The TruScan (ThermoFisher Scientific), a portable Raman spectrometer, has been used for falsified drug identification in field settings.10–12 While effective in this application, this system has seen limited adoption for drug quality screening, perhaps due to the cost of the system and some of the inherent limitations of Raman spectroscopy, as discussed throughout this manuscript.
Near infrared spectroscopy (NIRS) has been widely used in the pharmaceutical industry for monitoring blend uniformity and quality control of tablets.13–15 Previous research showed that NIRS is capable of quantifying API strength within a margin of 2.5% (w/w) in Fluoxetine and Ciprofloxacin tablets, and within 1.0% (w/w) for the excipient composition, 16 both of which meet the required accuracy for quality assurance standards.17,18 This previous near-infrared (NIR) research mainly focused on using expensive (US$10 000) benchtop equipment appropriate for validation or confirmatory analysis, but which is not suitable for routine screening use in lower income countries. A relatively low-cost (US$250) NIR spectrometer, the Consumer Physics SCiO, was previously shown by our group to be effective for identifying a small number of falsified antimalarial medicines as a limited use case. 19
In the present study, we expanded our investigation to a greater number of low-cost spectrometer systems that are currently available for purchase, and we looked at both simulated substandard medicines and simulated falsified ones to provide initial indications of efficacy. A survey of available spectroscopic technologies that are portable and under US$5000 produced three different NIR spectrometers and one Raman spectrometer that could be legitimate candidates for use in low-resource environments. In addition, one benchtop Fourier transform infrared (FT-IR) spectrometer was included to compare the performance of longer wavelength ranges where no low-cost, portable spectrometer is yet available. These units were tested for their ability to quantify both API and excipient concentrations in simulated tablets. Quantifying API content enables detection of both substandard and falsified medicines. The concentration of excipients (or formulation accuracy) plays an important role in determining whether a drug is falsified, especially in cases where the API concentration is very low as a function of total tablet mass. For this exploratory study, we focused on APIs found in antimalarial, antiretroviral, and antibiotic medicines as representative cases.
Materials and Methods
Drug Sample Preparation
Compound samples were prepared with APIs and common excipients for three types of medications: artemisinin combination therapy (ACT), antiretroviral therapy (ARV), and tuberculosis therapy (TBT). The APIs were artemether, efavirenz, and isoniazid, respectively. Three types of common excipients, commercial grade microcrystalline cellulose (MCC), starch, and anhydrous lactose, were used during sample preparation. Active ingredients and excipients were purchased from Sigma-Aldrich and Fisher Scientific. The baseline API concentrations were set as 5% w/w for artemether and 20% w/w for efavirenz and isoniazid. These concentrations were based on typical dosages in commercially available formulations of these medicines.
The base mixtures were then spiked into additional excipient to make mixtures at a total of five different proportions of baseline, or stated API (SAPI) concentrations. The resulting mixtures had SAPI levels of 0%, 40%, 60%, 85%, and 100%. At each concentration level, 1 g of sample was prepared. Each sample was thoroughly stirred and mixed for a minimum of 3 min in a disposable tray. The concentration errors, based on calculated versus actual weight readings, were less than 0.5% for prepared mixtures.
To determine the abilities of the devices to quantify excipient concentrations, which is necessary for overall formulation evaluation, two sets of two mixtures, MCC with starch and MCC with anhydrous lactose, were prepared and scanned with the same five devices. The two binary mixtures were prepared with a relative concentration interval of 5% w/w (e.g., 5% starch/95% MCC, 10% starch/90% MCC, etc.), following the same mixing procedures in the previous section. The concentration errors incurred during preparation were below 0.2% for both sample sets.
Loose powder mixtures, analogous to preparing a tablet sample by crushing it prior to destructive analysis, provide a more homogeneous form for measurement. For field screening work, nondestructive analysis of intact tablets is typically preferred, so tablets were also prepared using the same powder mixtures to examine whether the mixture form has an impact on prediction performance. Tablets measuring 6 mm in diameter were made in a standard manually operated tablet press.
Spectroscopic Devices
Summary of spectroscopic devices used in this study.
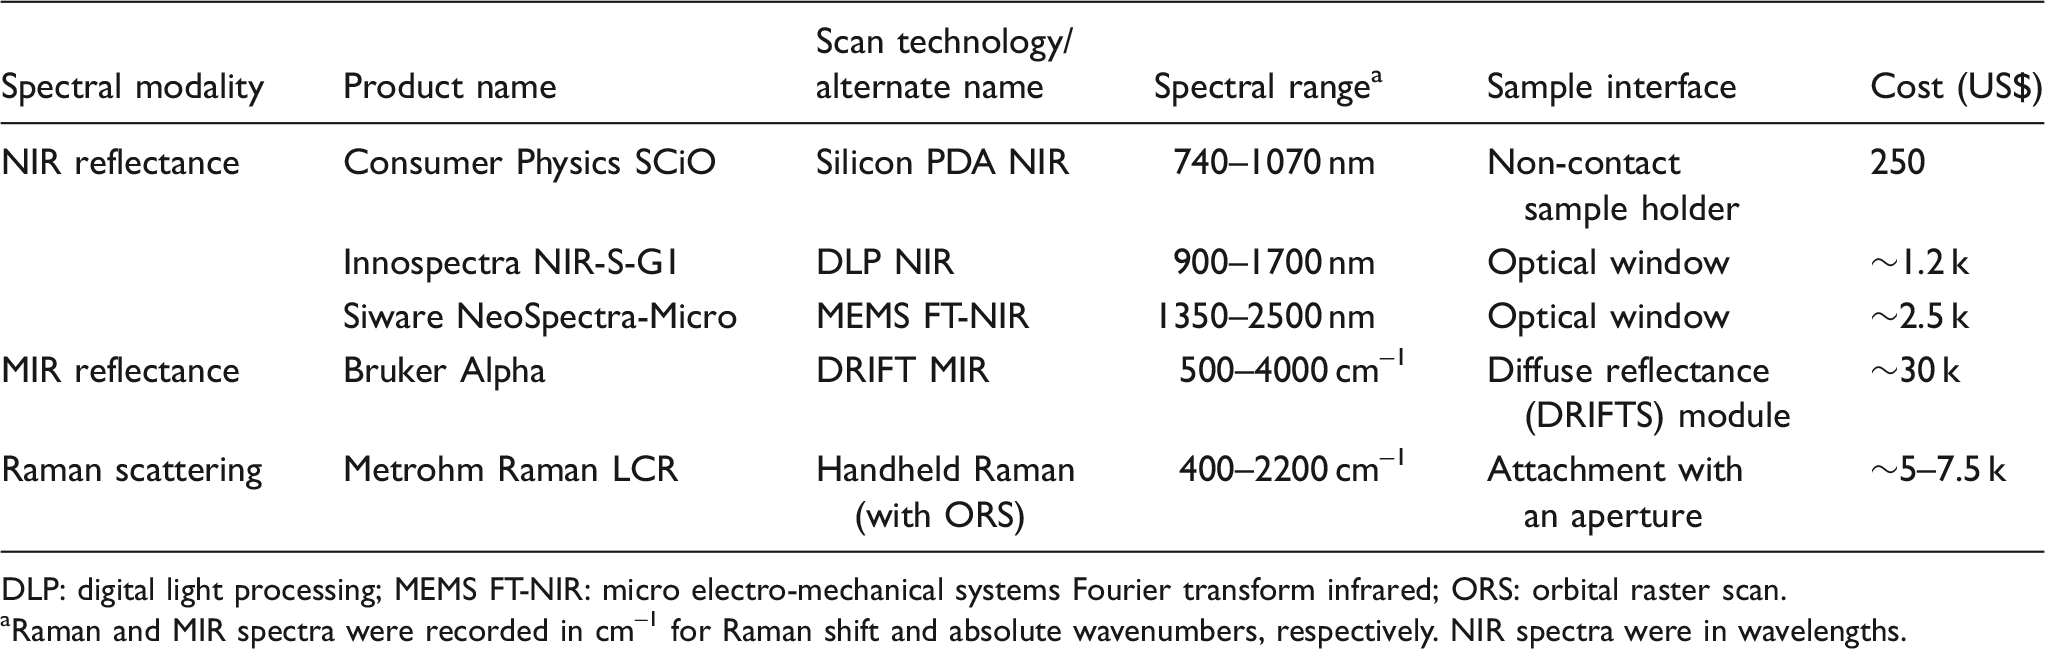
DLP: digital light processing; MEMS FT-NIR: micro electro-mechanical systems Fourier transform infrared; ORS: orbital raster scan.
Raman and MIR spectra were recorded in cm–1 for Raman shift and absolute wavenumbers, respectively. NIR spectra were in wavelengths.
The Raman LCR unit (Metrohm AG) is a handheld Raman spectrometer with a 785 nm excitation laser and detection range of 400 to 2200 cm–1. Its automated orbital raster scan (ORS) feature enabled the excitation laser spot size of 25 µm to cover a 3 mm 2 surface area during one scan. The handheld Raman device can operate independently with an embedded liquid crystal display (LCD) user interface, but to facilitate data handling, it was connected via USB to a laptop in this experiment. The mid-infrared (MIR) device (Alpha, Bruker Optics) has several sampling interfaces available from the manufacturer. The diffuse reflectance for infrared Fourier transform (DRIFT) module was used for this work, and spectra were recorded from 400 to 4000 cm–1 using a dedicated desktop computer and Bruker’s OPUS spectroscopy software to operate.
Spectral Measurements
Before sample measurements, the NIR spectrometers were calibrated using reflectance standards. Both the MEMS FT-NIR and DLP devices used a Spectralon 99% diffuse reflectance standard (Labsphere). The MEMS FT-NIR device required 5 min of warm up time before sample measurements. During warm up, a reflectance standard was measured repeatedly until the spectral measurement stabilized. After the MEMS FT-NIR device stabilized, a background spectrum was taken for subsequent sample measurement reference. Each scan had an integration time of 5 s and was repeated three times by shifting the sample container slightly around the optical aperture. The DLP NIR spectrometer was configured to produce the average of six consecutive acquisitions with 2.3 s total integration. Exposure time was set to 0.635 ms with a spectral bandwidth of 7.03 nm, resulting in 228 data points across a spectral range between 900 nm and 1700 nm. Sample measurement was repeated at three different sample surface locations. The silicon PDA spectrometer came with its own calibration standard and needed to be recalibrated once every ∼10 scans. The device has a default integration time of ∼1 s. Data transmission via Bluetooth and wireless network created some communication overhead such that three repeated scans usually required ∼10 s. Spectra collected using silicon PDA device were organized by API, excipients, and respective concentration levels. Sample information were exported along with spectra as metadata in a single comma-separated values (CSV) file, which was later downloaded from the remote server. For all devices, each sample was scanned three times and an average was calculated for use in further analysis.
The handheld Raman spectrometer does not use an intensity calibration, but has a built-in calibration process for Raman shift using a manufacturer-supplied vial of acetonitrile toluene 50:50 (v:v). It needed to accommodate samples with varying levels of fluorescence in order to maximize use of the dynamic range of the detector. Thus, an integration time to accommodate the most fluorescent sample such that signals did not saturate the detector was used for each sample set. Typically, a measurement session with an integration time of 0.1 s integration and 0.1 s delay for 16 repeated measurements usually took about 3 min to complete. The DRIFT MIR device was calibrated with a gold reflectance standard provided by the manufacturer. For sample measurement, it collected a single spectrum in about 27 s. Before being placed into DRIFT module, sample powder was poured into a stainless steel sampling cup provided by the manufacturer, and excess material was scrapped off to create a flat and uniform surface. Although some samples featured strong MIR absorbance, no dilution (e.g., with KBr) was performed since such a step is not feasible for ultimate use in low-resource settings, and there was a desire to keep sample preparation consistent among all the different devices in the present study.
Data Analysis
Spectral features in the NIR spectra of mixtures are usually highly overlapping or correlated, hindering direct interpretation; thus, multivariate data analysis is generally considered the standard approach for spectral interpretation. The simplified binary mixtures enabled straightforward identification of spectral peaks unique to individual ingredients. Thus, in addition to multivariate analysis, univariate regression was applied at known absorption features. Univariate regression offers robust solutions to the quantification problem with unambiguous chemical interpretation of underlying compositional changes. On the other hand, the wealth of spectral information in the data means that some pertinent spectral bands may not be fully utilized by univariate regression. For the NIR spectra only, given the lower cost devices and broader spectral features relative to MIR and Raman, multivariate regression using partial least squares (PLS) regression was utilized as well. Given the small spectral datasets, spectra of the same API prepared with different excipients were combined to train the PLS regression models. For the excipient binary mixtures, starch, and anhydrous lactose content in their respective MCC mixtures were used as the reference values in PLS regression.
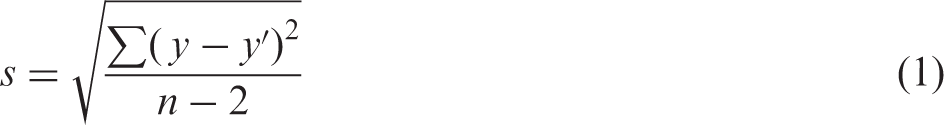
Data analysis was carried out in MATLAB (version R2017a, The Mathworks, Inc.). For the univariate analysis, ordinary least squares (OLS) regression was applied between absorption at selected wavelengths and API concentrations. The univariate standard error of regression (s) could then be computed using Eq. 1
For chemometric analysis, including spectral pre-processing and PLS regression, a third-party PLS toolbox (v.8.5, Eigenvector Research, Inc.) was used. A number of spectral pre-treatment methods, such as Savitzky–Golay derivative and mean centering, were evaluated and utilized to pre-process different types of spectra. 20 For PLS calibrations, leave-one-out cross validation (per sample of powder or tablet) was applied. Samples with the same API but different excipients were pooled together to create calibration sets for PLS regression, such that each regression had a sample size of 20 (5 API concentrations × 2 excipients ×2 replicate samples). For each PLS analysis, the number of latent variables was set by choosing the simplest model that minimized the root mean square error of cross-validation (RMSECV). For both univariate and multivariate cases, prediction performance metrics are reported as R2, standard error of regression s, and RMSECV. 21
Results and Discussion
Quantifying API Concentration with Univariate Regression
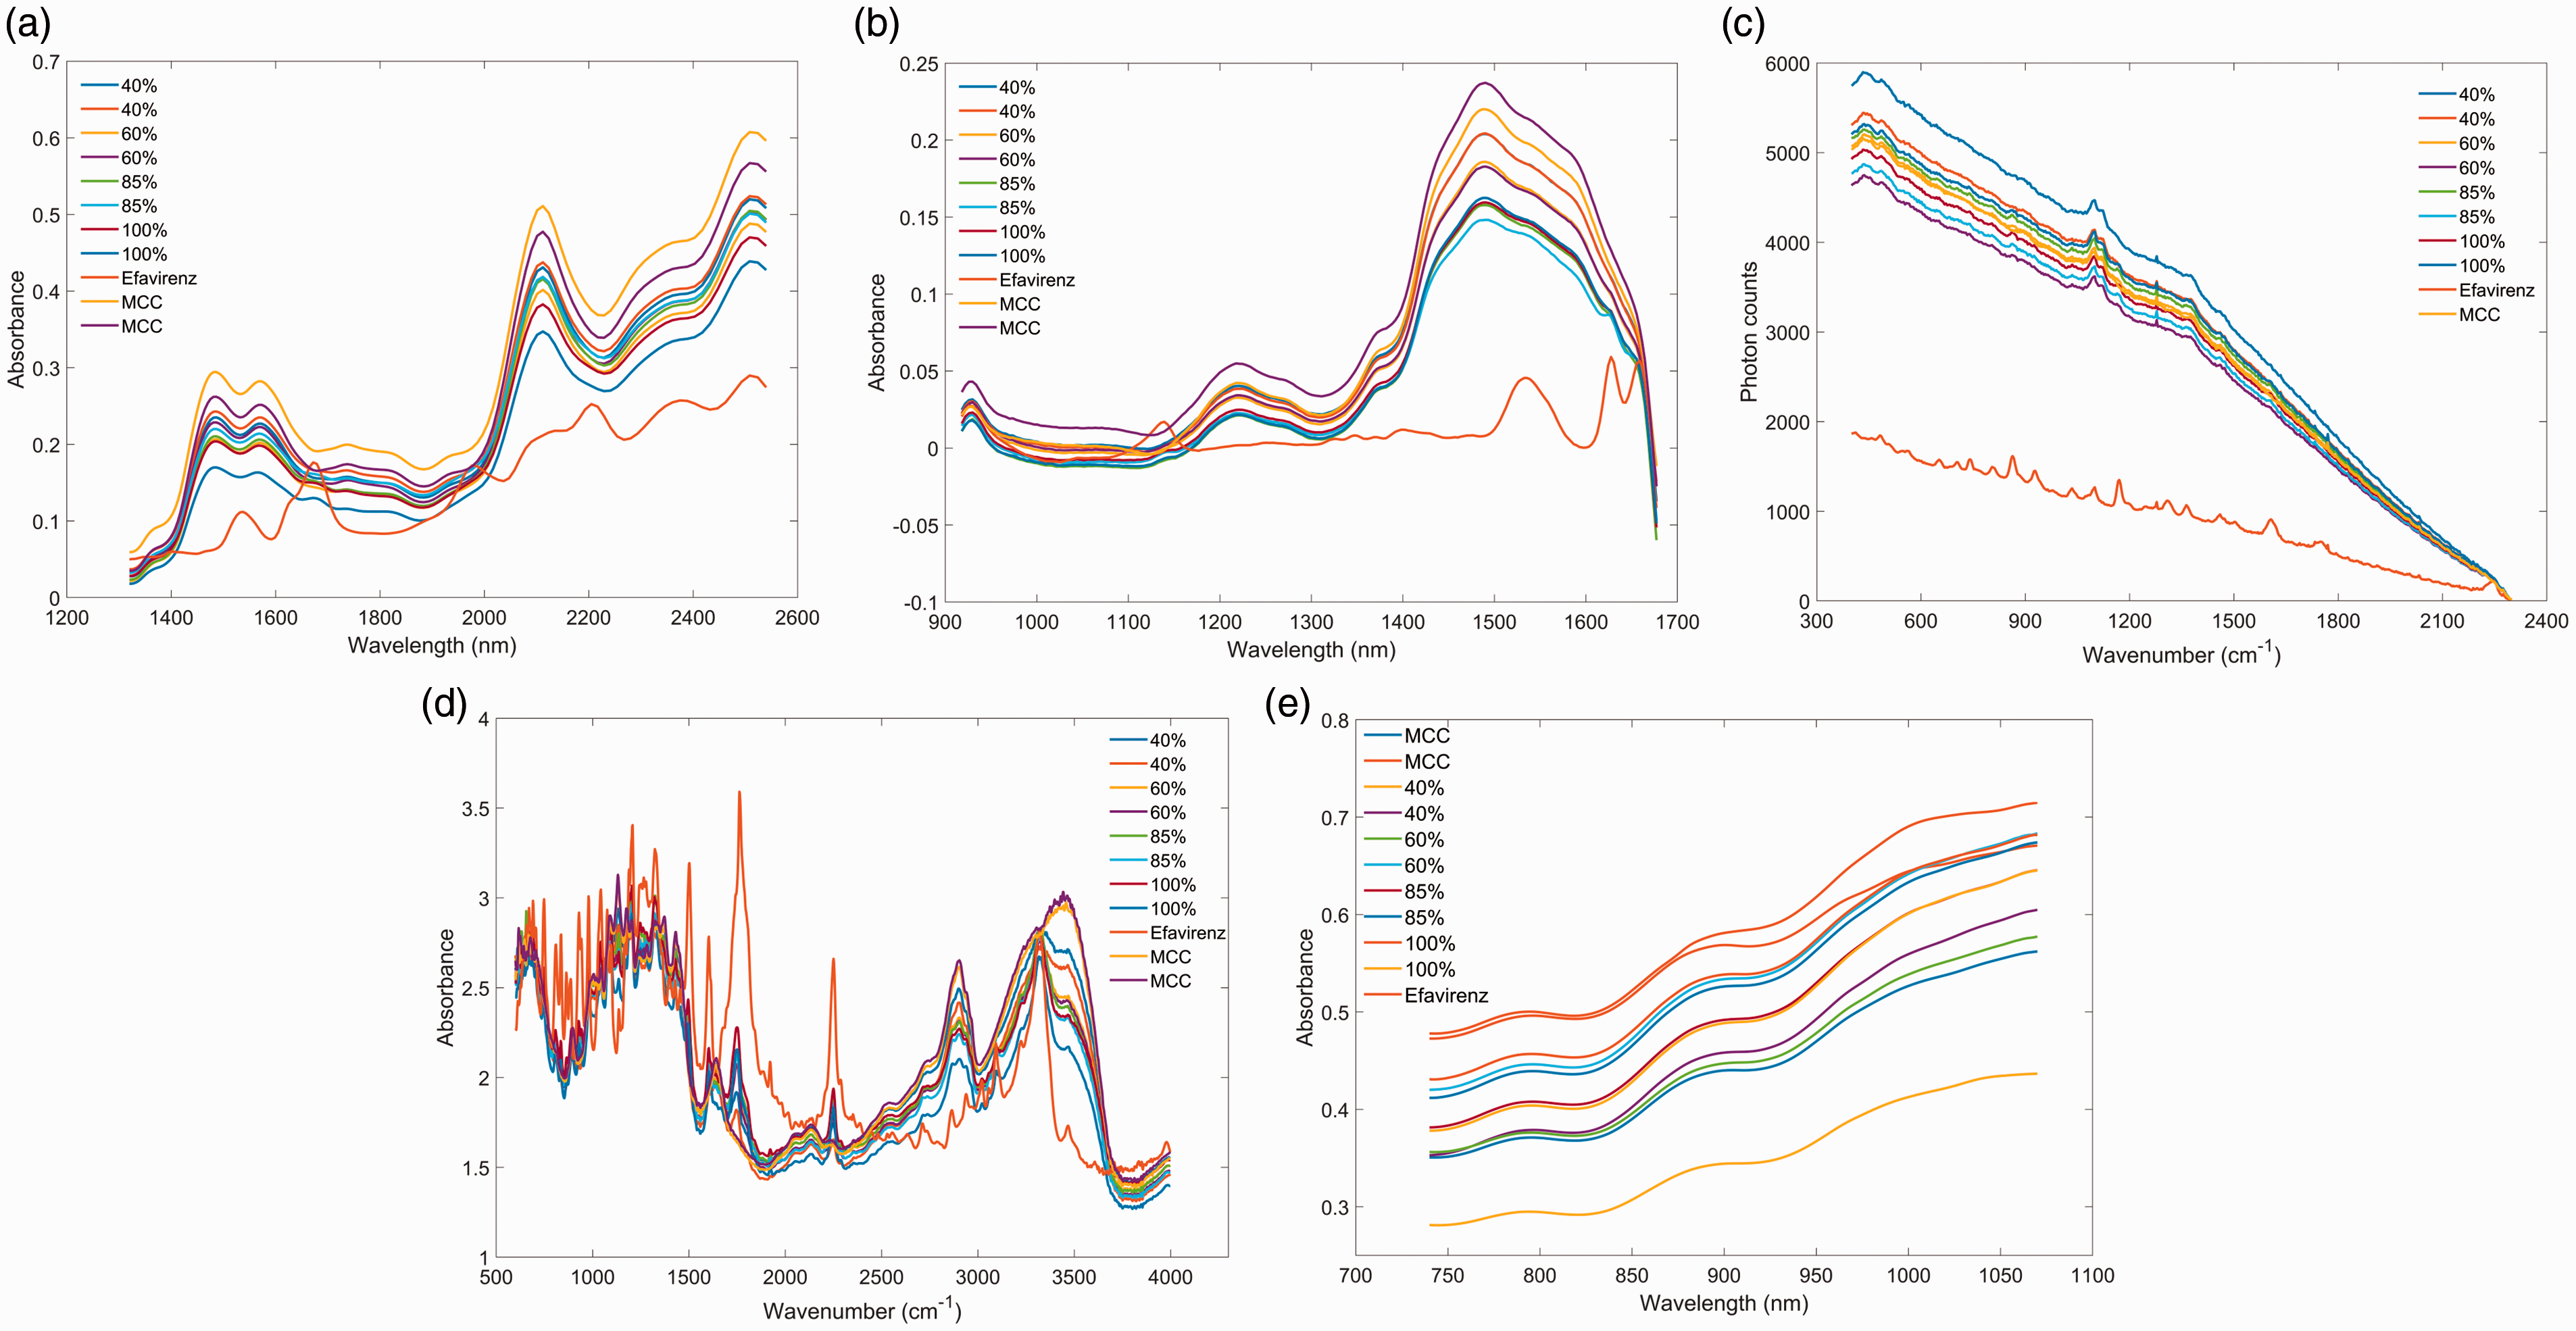
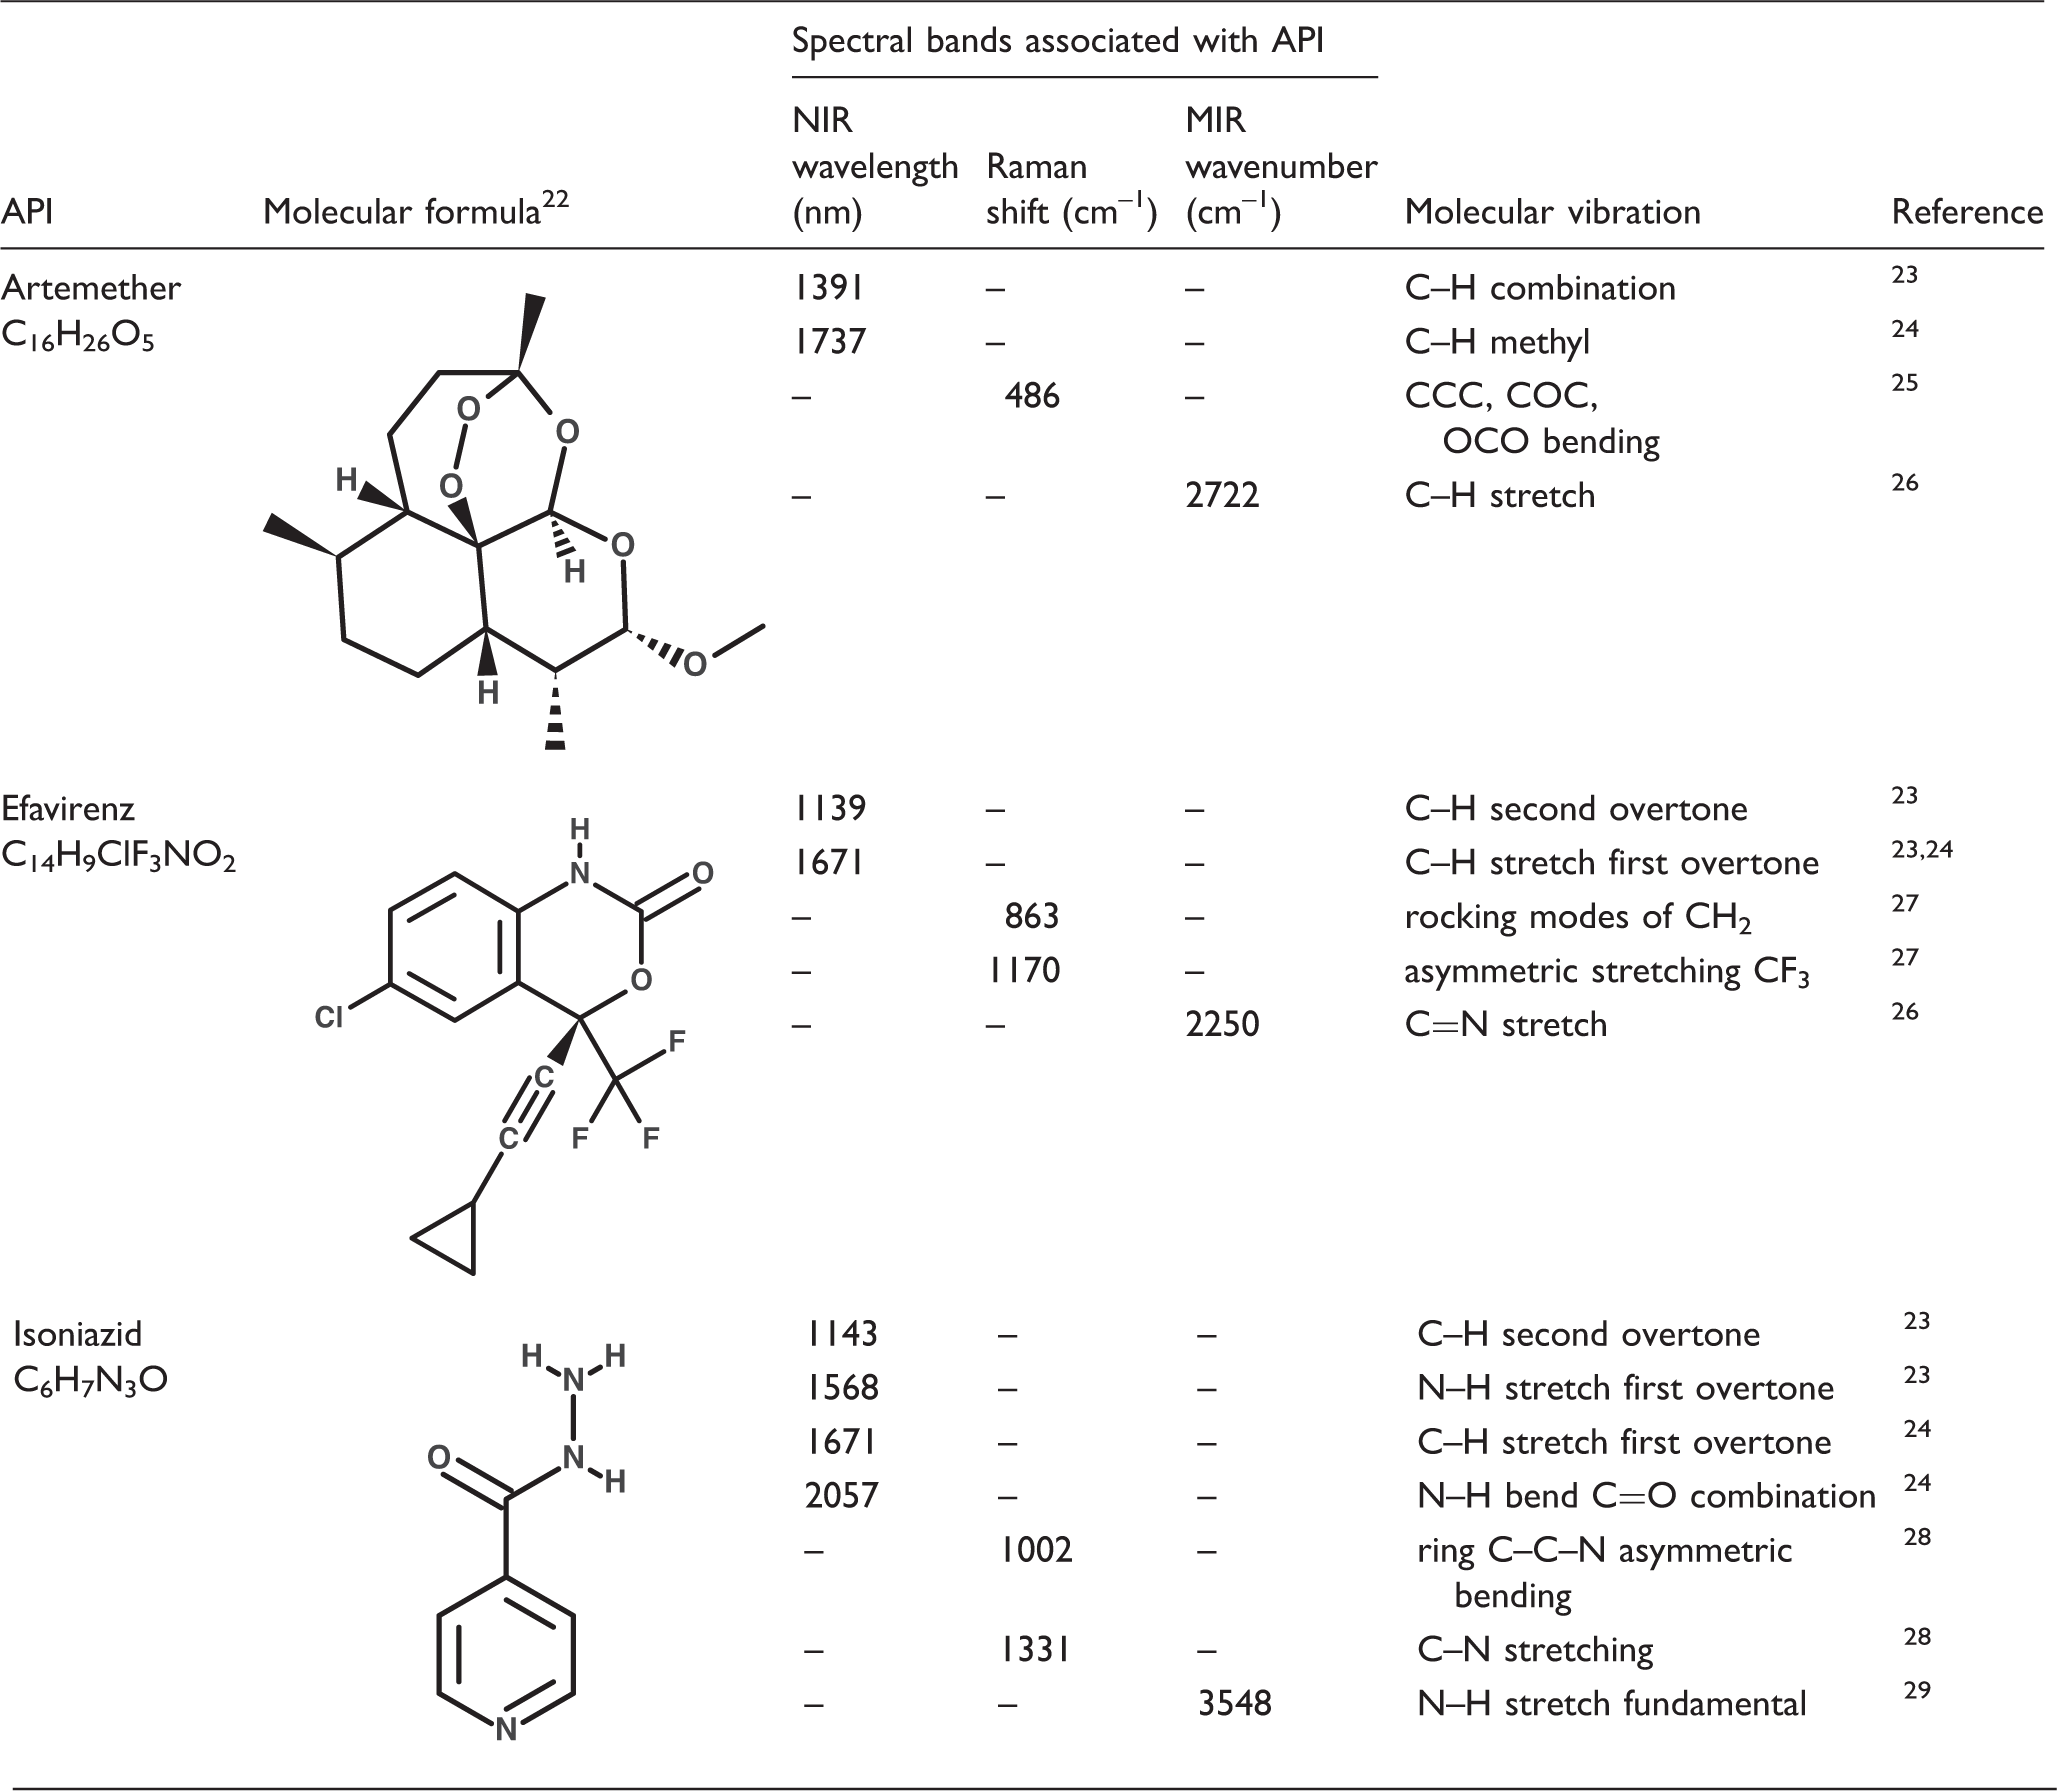
The spectra of pure API chemicals and excipients (Figs. 1a to 1e) were collected and compared against each other to identify spectral features to use for univariate regression on the dilution series. Spectra from the silicon PDA device (Fig. 1e), which works in the range of 740–1070 nm, exhibit absorption bands mostly from the third NIR overtone region. Due to inherently weak absorption in this spectral region, it was difficult to identify apparent spectral features that are unique to the targeted APIs. Thus, univariate regression on spectra collected using silicon PDA device was not attempted. For all other spectral sets, the spectral intensity was extracted at identified API peak locations (i.e., relatively strong API absorption peaks where absorption from excipients was less apparent; also see Table II for a list of peaks) and regressed against API levels relative to their declared concentrations. Figures 2a to 2e show an example of a complete dataset across all devices for mixtures of efavirenz in MCC. A regression equation was then calibrated at each selected wavelength (for NIR techniques) or wavenumber (Raman and MIR), resulting in multiple calibration lines.
Spectra of pure ingredients collected using different devices. (a) MEMS FT-NIR; (b) DLP NIR spectrometer; (c) handheld Raman spectrometer; (d) DRIFT MIR; (e) silicon PDA NIR device. Spectra of efavirenz, MCC, and drug mixtures acquired on: (a) MEMS FT-NIR; (b) DLP NIR scanner; (c) handheld Raman scanner; (d) DRIFT MIR; and (e) Silicon PDA NIR device. Spectral band assignments for API peaks used for analyses.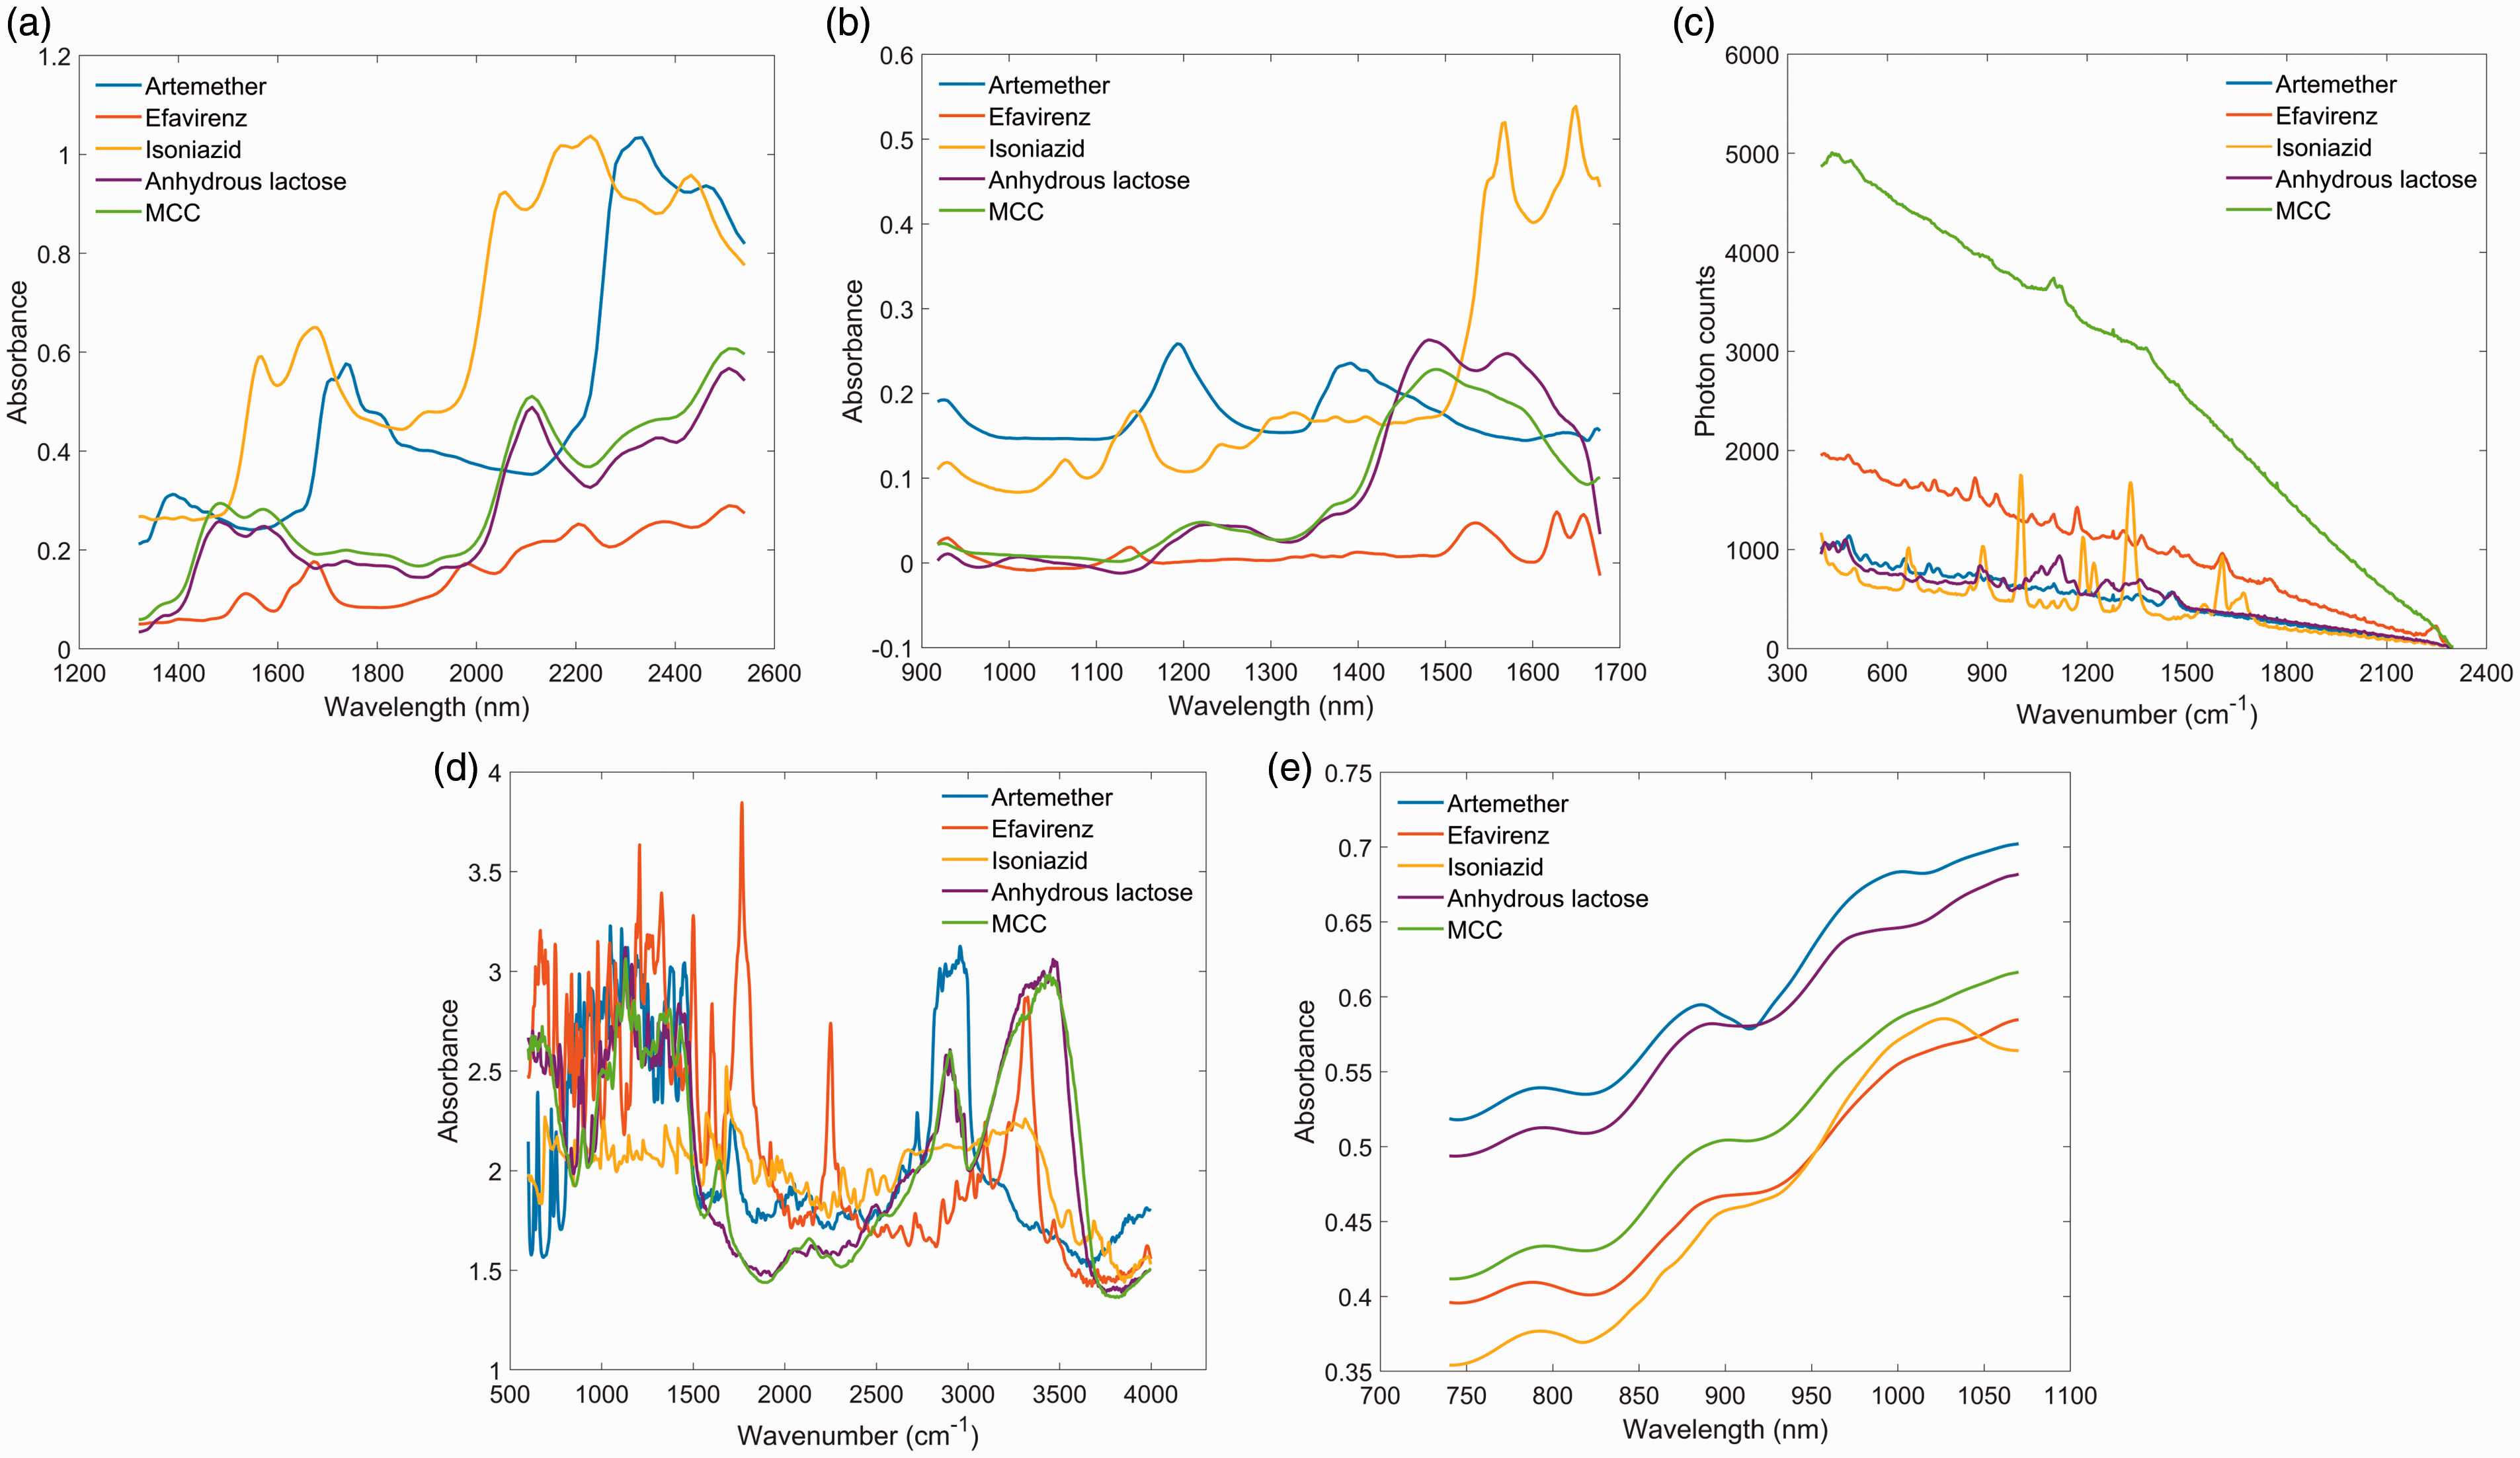
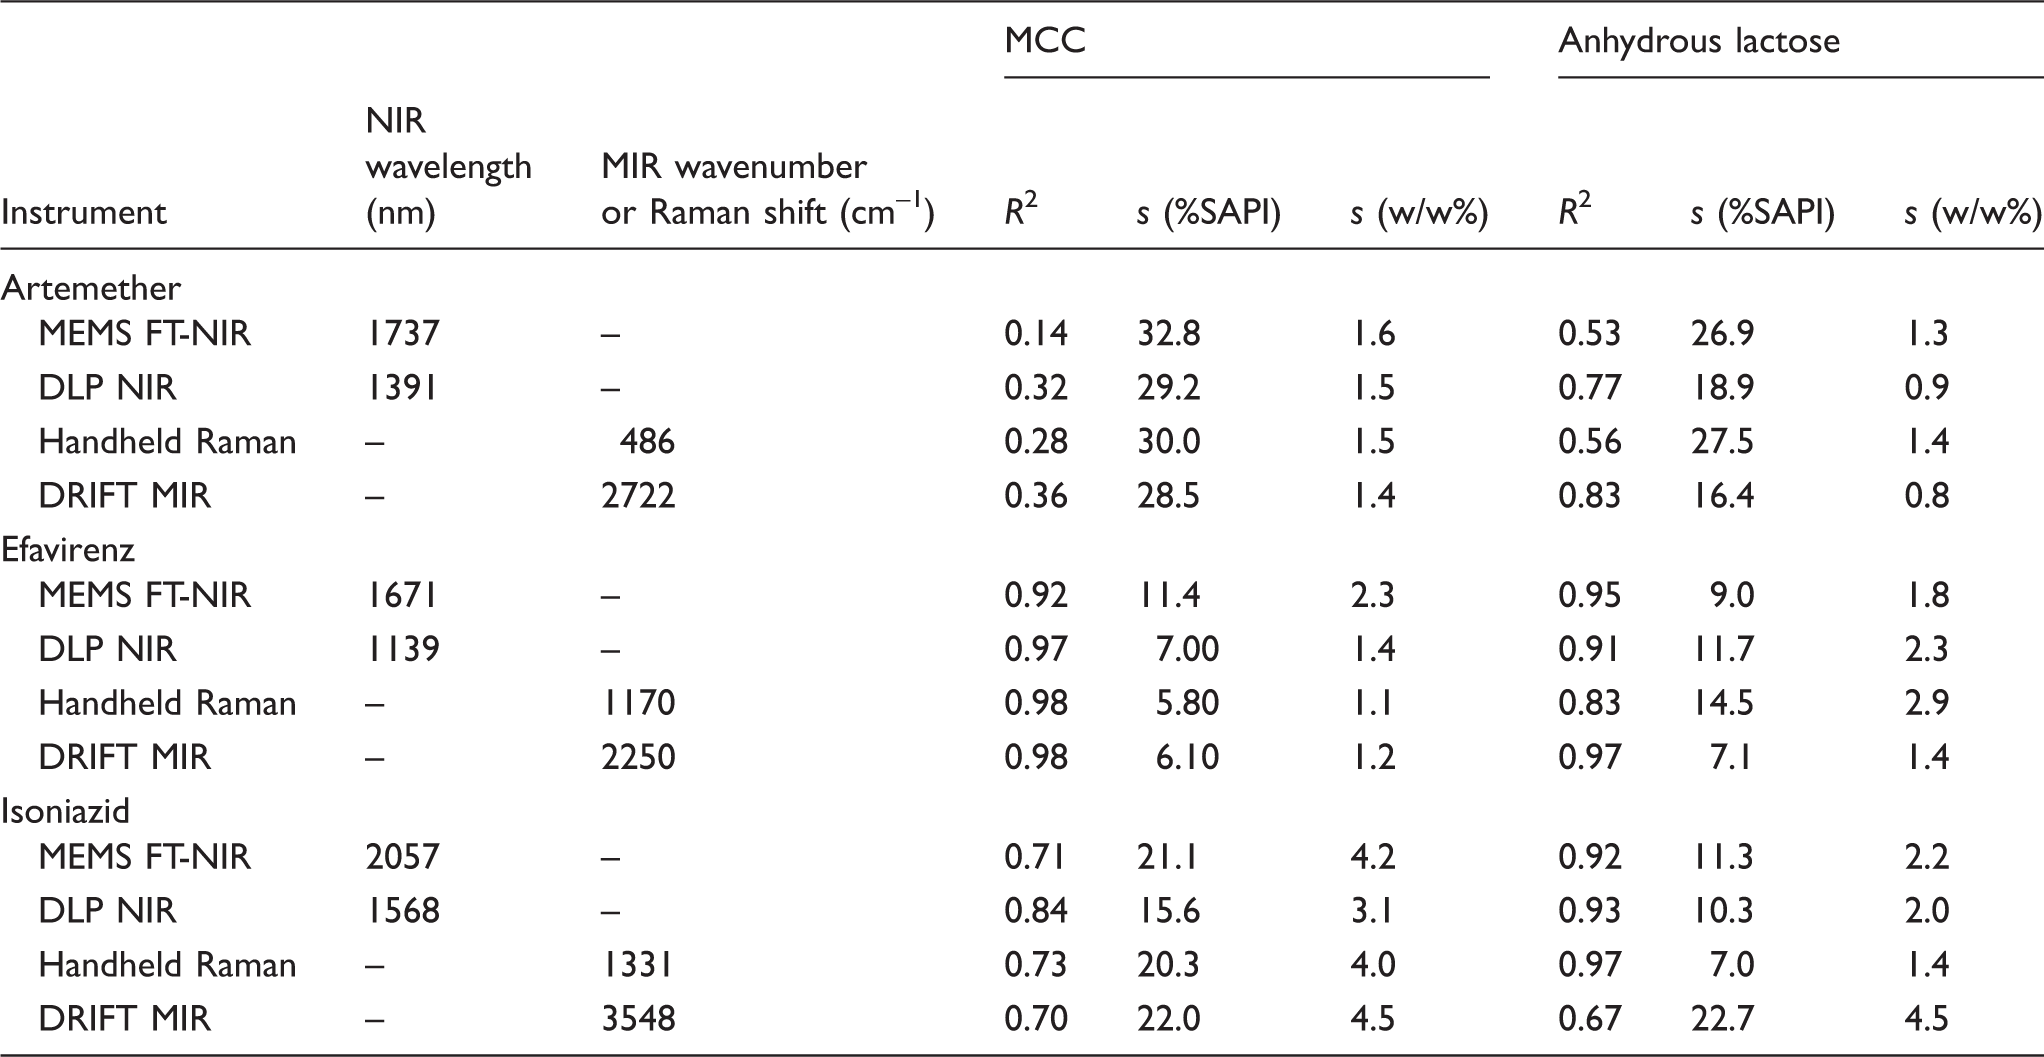
Univariate regression statistics for quantifying API concentration in powders.
For many of the calibrated regression models using either powder or tablet samples, R2 values were greater than 0.8, demonstrating good linearity between instrument response and API concentration. A few of these selected spectral regions together with regression lines are shown in Figs. 3a to 3d. As seen in Fig. 3a, peak signal intensity generally follows a linear relation with artemether concentrations relative to the stated level of 5% w/w, though the selected peaks display even greater linearity in Figs. 3b to 3d for the API’s with a higher w/w concentration as a baseline. The graphs demonstrate that spectral measurements are both repeatable and correlate with concentration variations.
Spectral signal intensity and calibration curve at selected wavelength for different APIs. (a) artemether absorption peak at 1192 nm by DLP NIR spectrometer (anhydrous lactose as excipient. Note that artemether absorption is on the shoulder of the main 1215 nm peak, which comes from excipient); (b) efavirenz absorption peak at 1139 nm by DLP NIR spectrometer (MCC as excipient); (c) efavirenz Raman peak at 1170 cm–1 using handheld Raman (MCC as excipient); and (d) isoniazid Raman peak at 1002 cm–1 using a handheld Raman spectrometer (anhydrous lactose as excipient).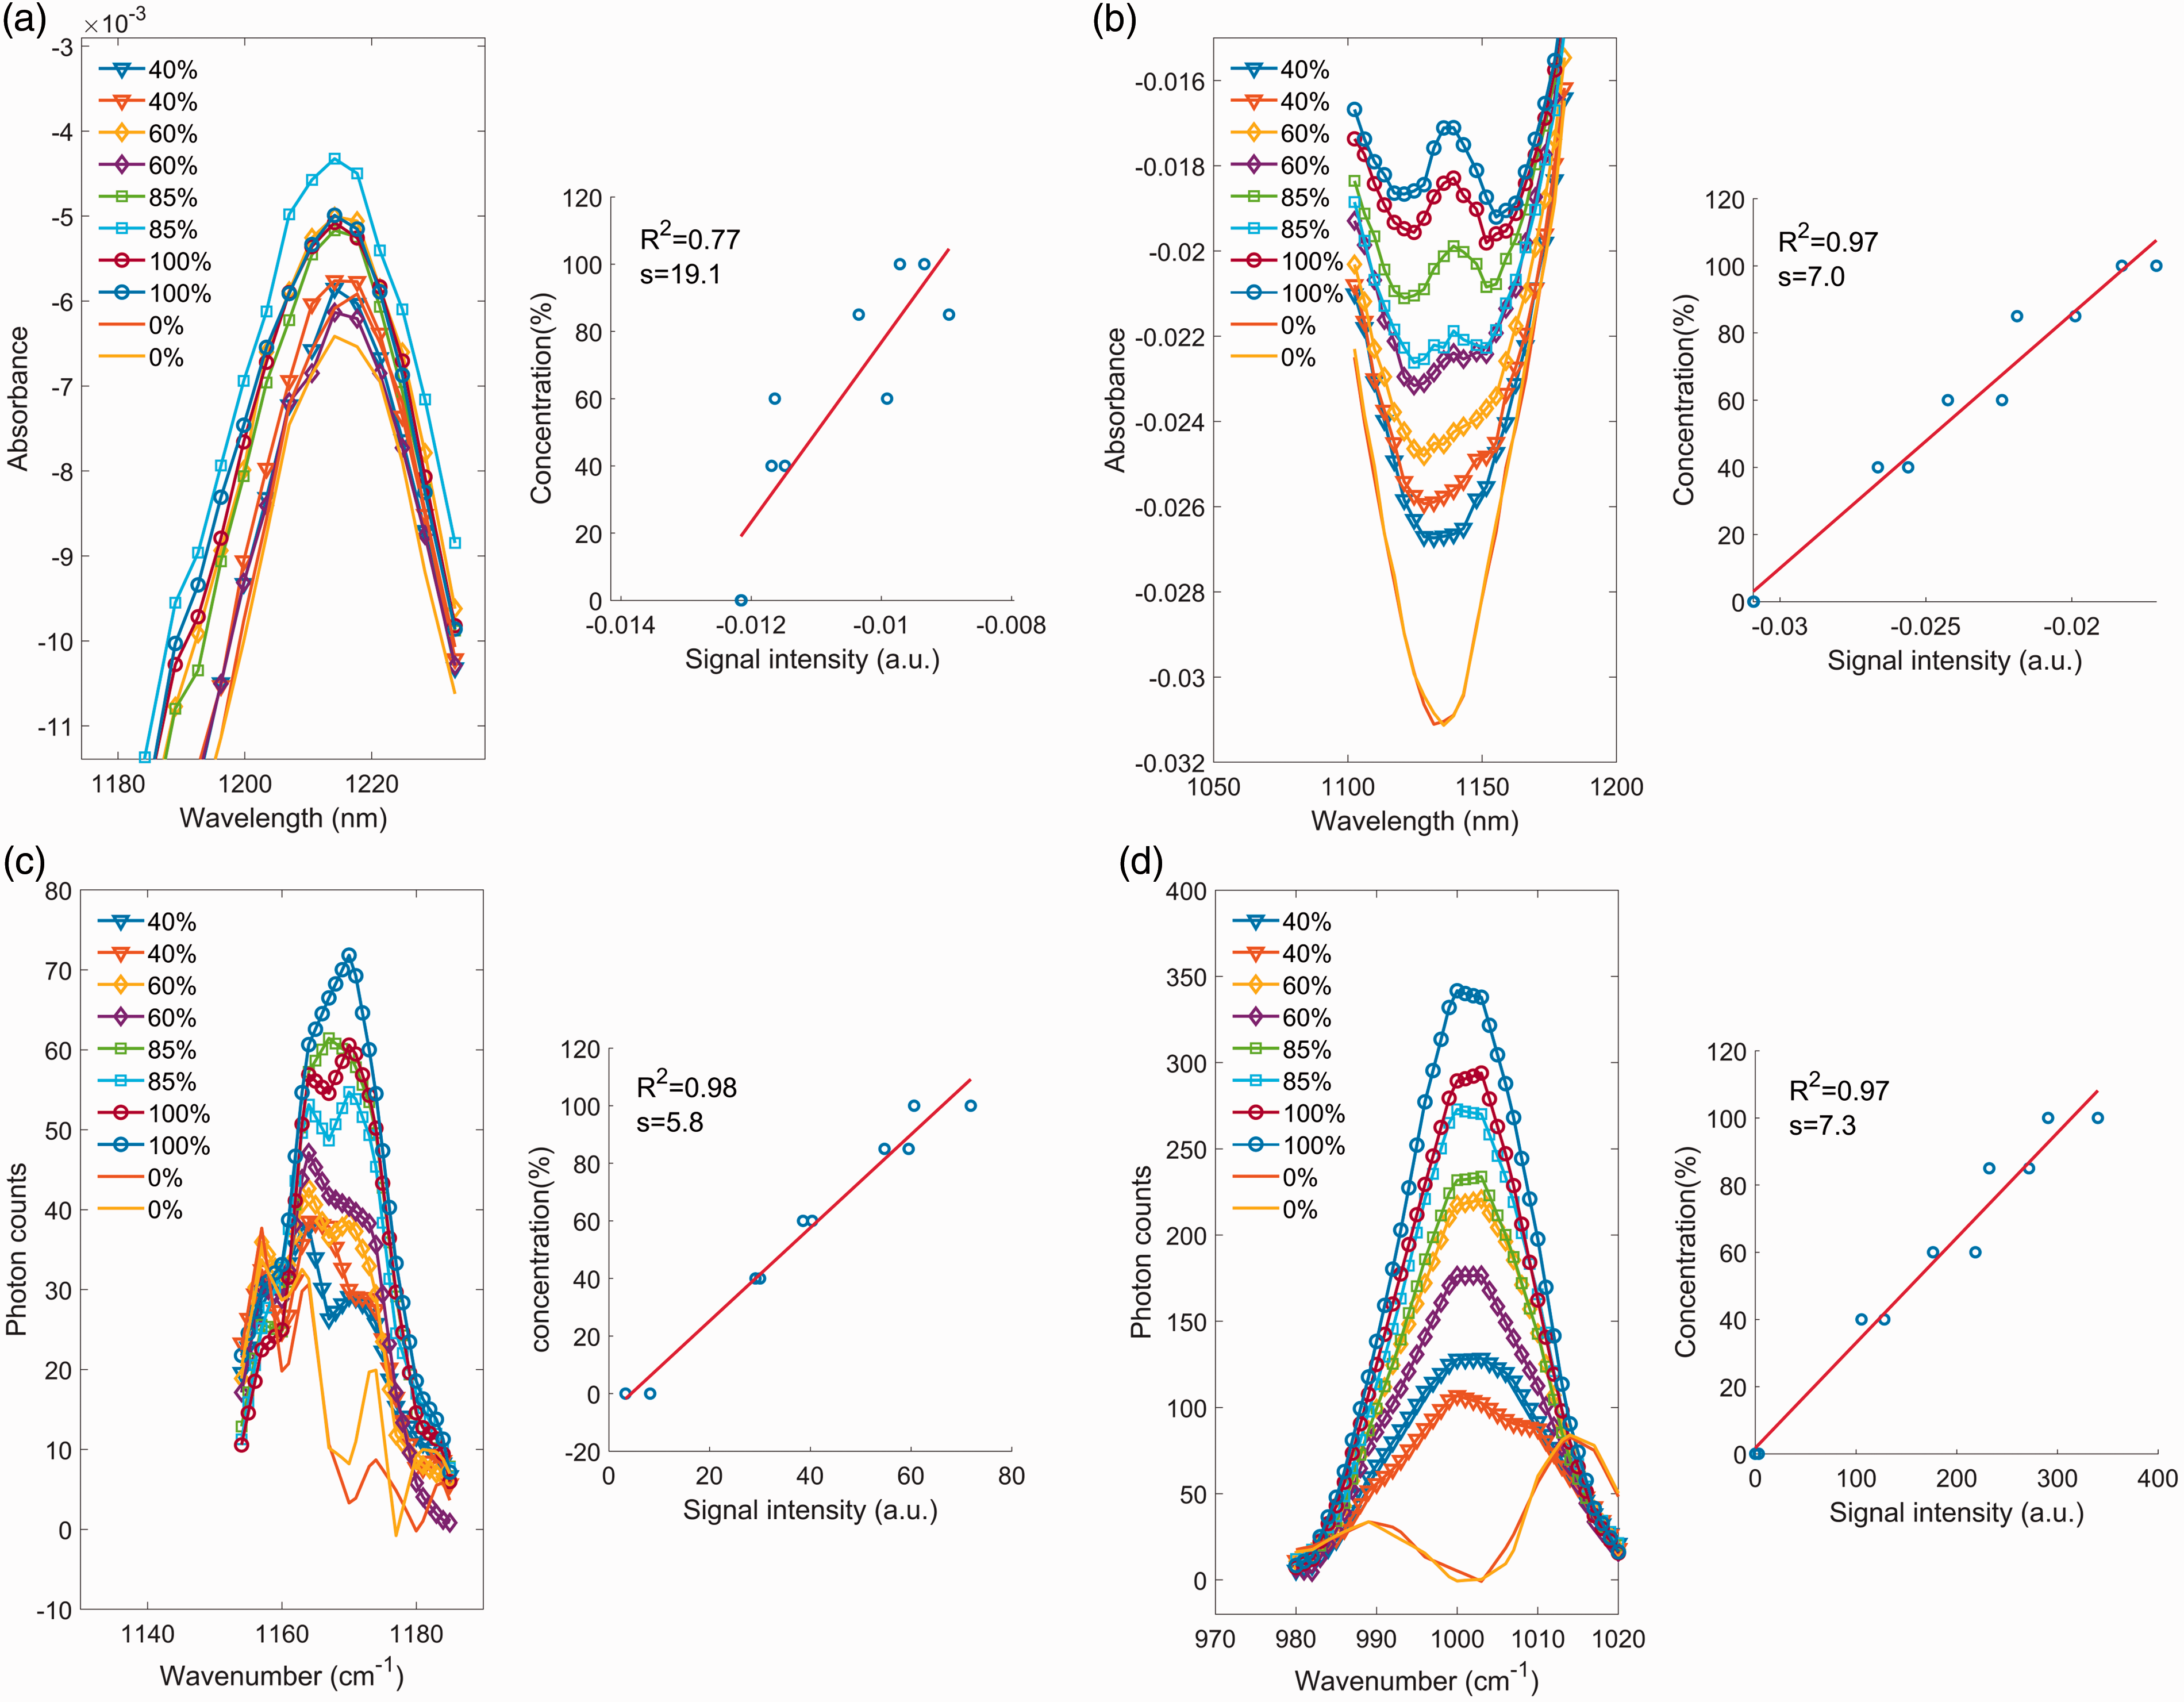
Many factors contributed to the variability of the prediction errors, with SAPI levels and drug type playing an important role in deciding the relative prediction errors. The absolute prediction errors generally stayed at a consistent level, ranging between 1% and 3% (w/w), despite the types of APIs under test. This numeric estimation roughly aligned with previous reports, which attested to the detection capacities of spectroscopy for API concentration. 16 For artemether, even though most of the relative s values are large, it could be arguably stated that all spectroscopic modalities were able to detect artemether signals at concentrations approaching their detection limits, with DLP NIR device and DRIFT MIR performing slightly better compared to others. The regression results from pressed tablets are generally on par with or slightly better than those for powder samples. It remains unclear whether these slight advantages shown for some formulations, e.g., isoniazid in MCC matrix, represent a true advantage that could be generalized outside this study.
For efavirenz powder samples, with a baseline concentration of 20% w/w, spectra acquired on all four devices have demonstrated to be usable in predicting efavirenz concentrations with s values of about 10% of SAPI. The R2 values between peak intensity and concentration levels are generally above 0.90 for most regression models, demonstrating good linearity between API levels and instrumental response. For the MEMS FT-NIR spectrometer, wavelength 1976 nm (C = O second overtone) for MCC with efavirenz mixture had less prediction power compared to other wavelengths. Despite being a distinct spectral feature for efavirenz, peak intensity at 1537 nm had slightly less prediction power for efavirenz using the MEMS FT-NIR spectrometer. For the DLP NIR spectrometer, peak intensity around 1535 nm for anhydrous lactose and efavirenz mixture samples equally demonstrated low prediction power based on the regression statistics. This could be attributed to strong absorption of MCC and anhydrous lactose in those spectral regions.30,31 Other than that, there is good consistency between those results from samples using either MCC or anhydrous lactose as excipients. Results from compressed tablet spectra are consistent with those from powder samples.
Though isoniazid had the same SAPI level of 20% w/w as efavirenz, the regression statistics were comparatively less favorable. In the MIR region (Fig. 1b), there are not many wavenumber variables that correlated well with isoniazid strength, and the R2 hovered between 0.5 and 0.7, making it less useful for isoniazid detection when comparing to either NIR or Raman. Nonetheless, both DLP NIR spectrometer and handheld Raman consistently proved to be useful for API quantification. Even with the challenges for isoniazid detection, both techniques offered good prediction accuracy. As was the case with efavirenz (regression statistics not shown), DLP and MEMS FT-NIR device did not provide good prediction power utilizing peak intensity around 1568 nm for quantifying isoniazid contents. The regression statistics with Raman spectra of powder samples showed significant variation between results of isoniazid samples with MCC and anhydrous lactose excipients. The individual Raman spectra demonstrated moderate levels of fluorescence for MCC when compared to that of anhydrous lactose (Fig. 1c). So it is likely that the fluorescence signal overwhelmed the relatively weak isoniazid signal while significantly reducing the dynamic range of the detector at the same time.
PLS for NIR Calibration to Determine API Levels
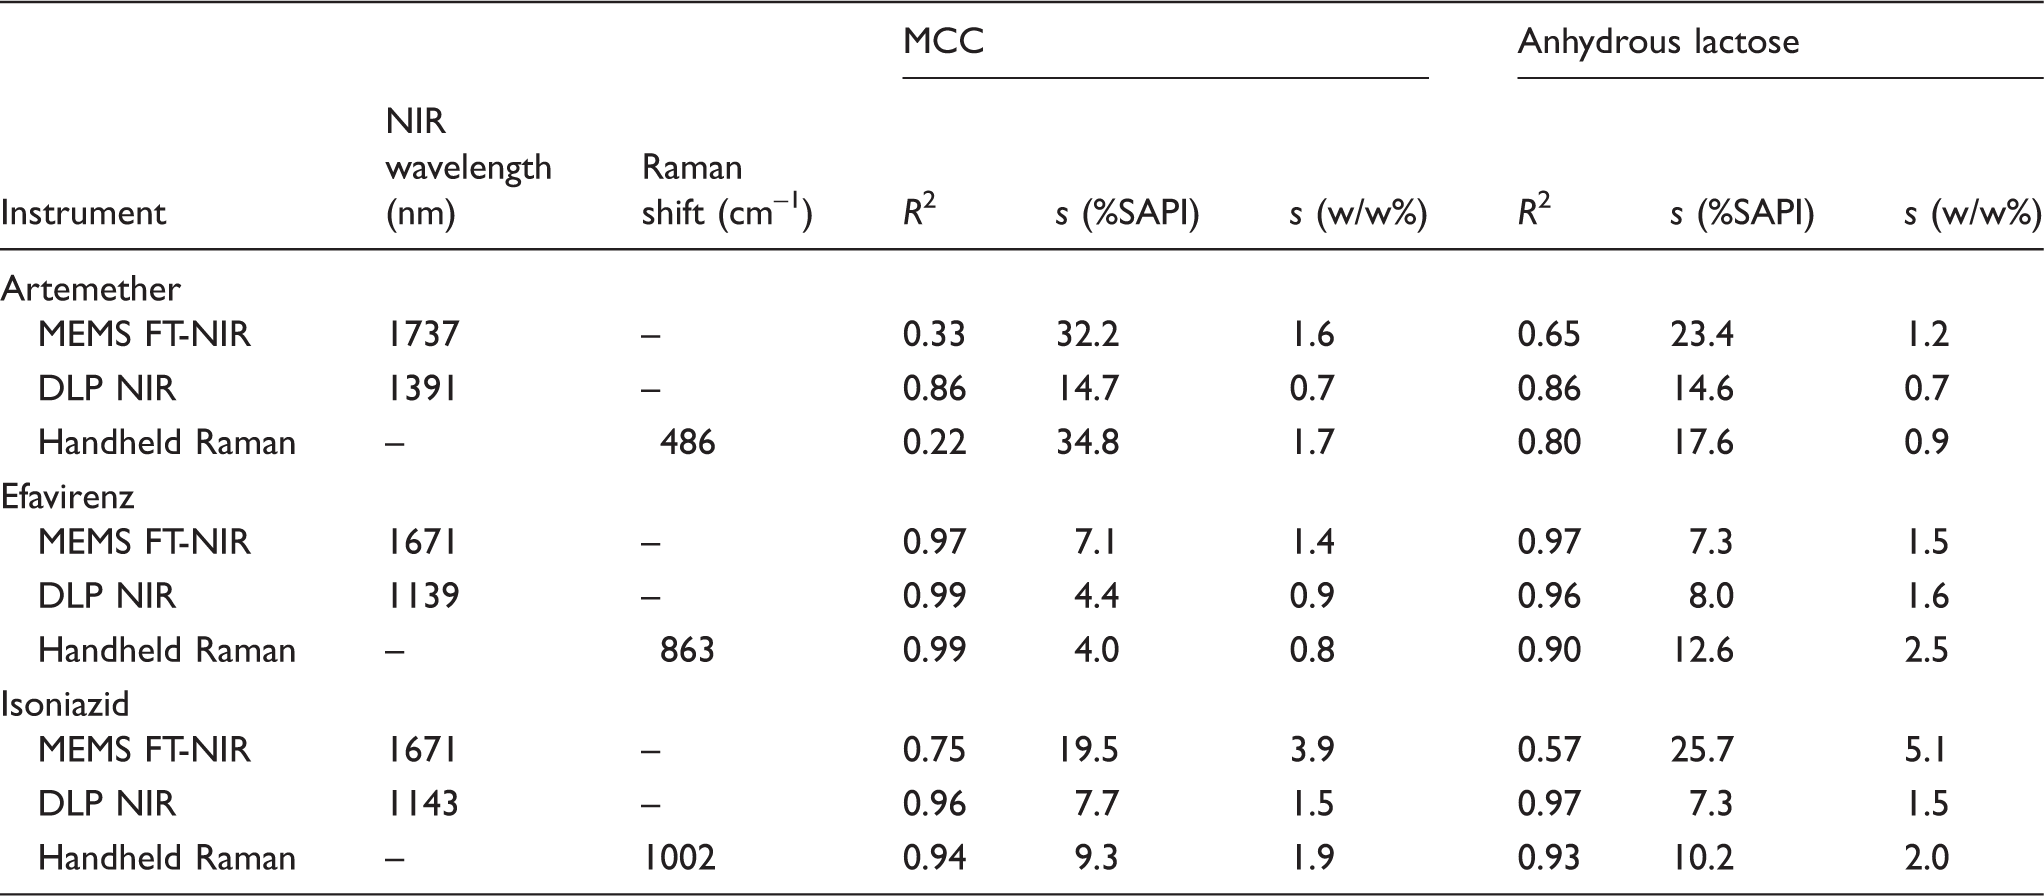
Univariate regression statistics for quantifying API concentration in pressed tablets.
PLS regression statistics for quantifying API concentrations from NIR spectra.
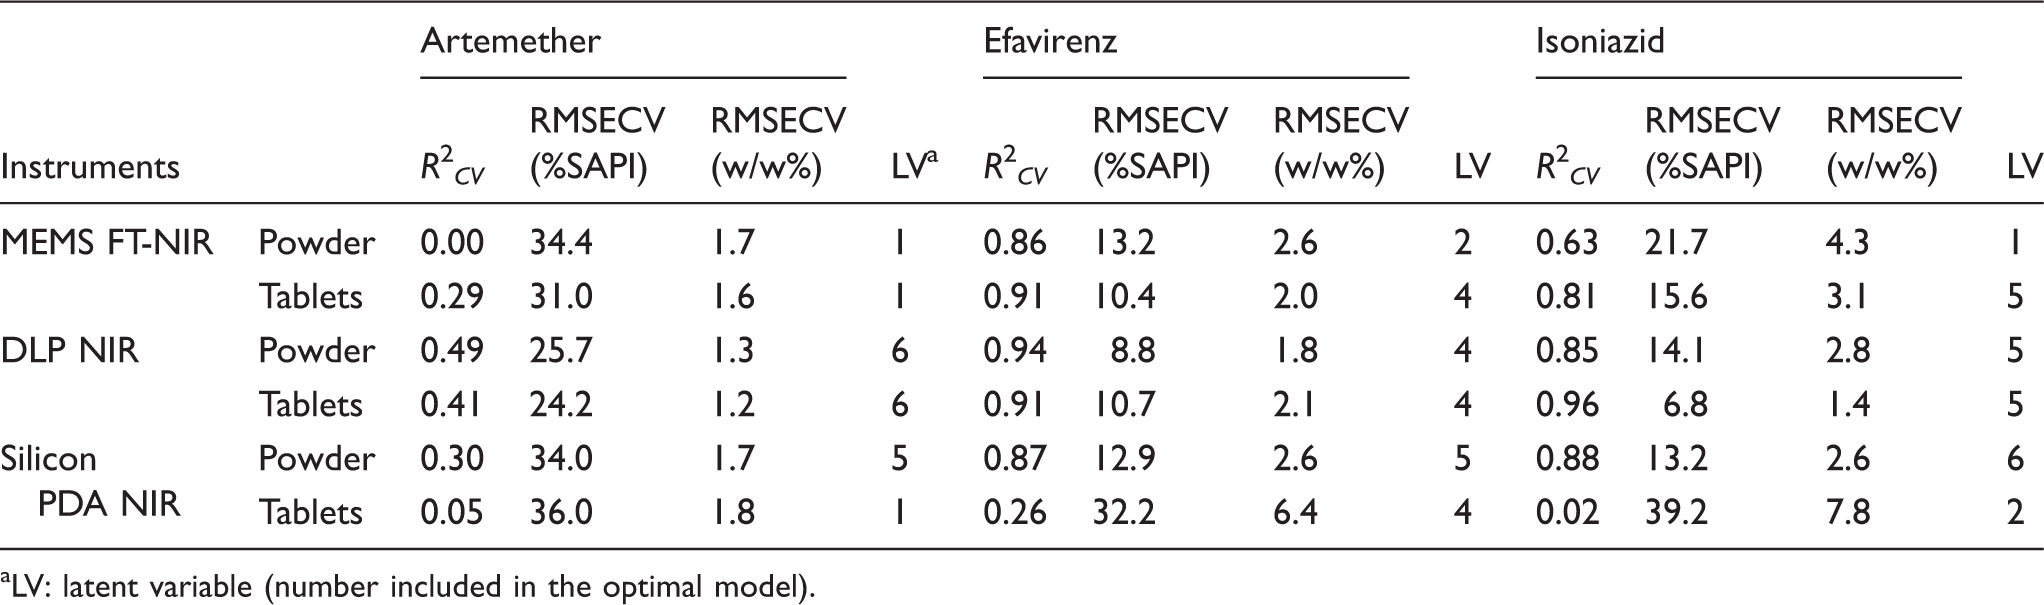
LV: latent variable (number included in the optimal model).
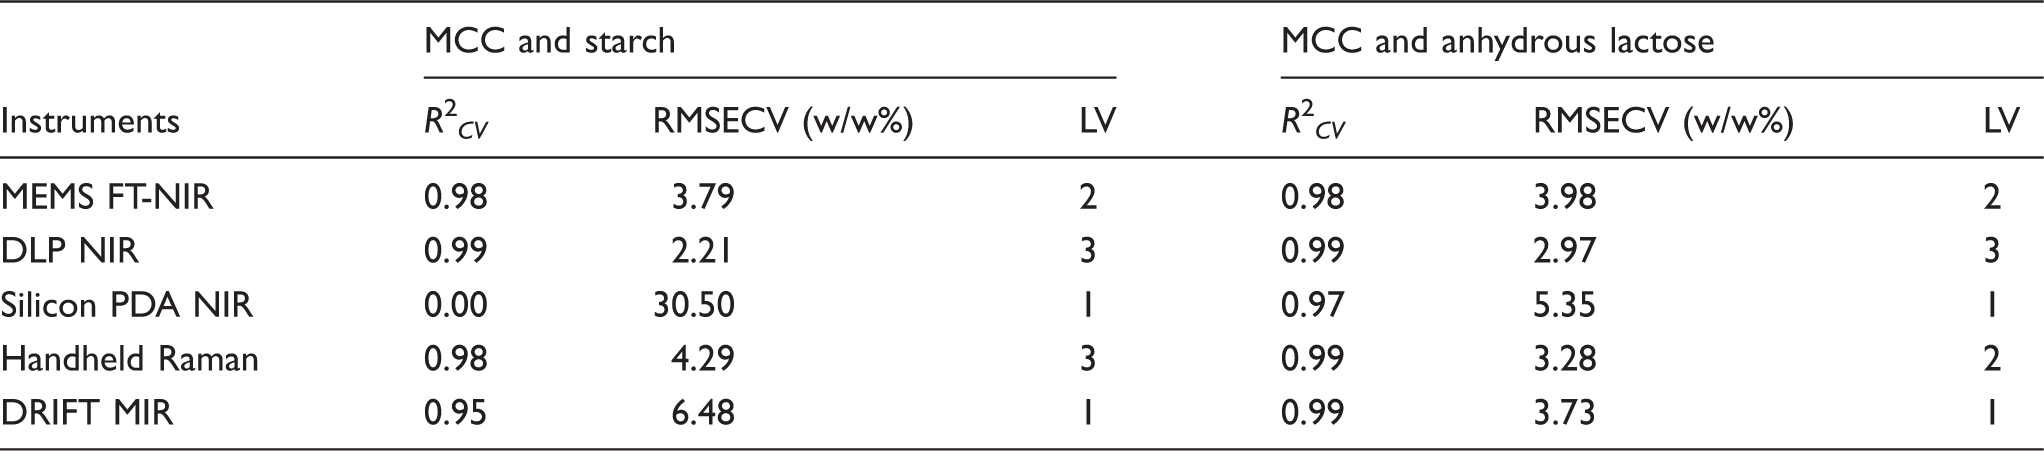
Excipient Mix Levels (Formulation Accuracy)
Regression statistics for excipient concentration predictions based on PLS models.
Conclusion
Five commercially available devices encompassing three different spectroscopic modalities, near-infrared (NIR), Raman, and mid-infrared (MIR), were evaluated for their quantification performance. For the API strength test, factors such as stated active pharmaceutical ingredient (SAPI) levels, excipient, and type of spectroscopic techniques all played a role in determining quantification performance. Results suggested that efavirenz and isoniazid content could be quantitatively determined with a prediction error of about 10% of the SAPI levels. Both the digital light processing (DLP) NIR spectrometer and Raman device proved to be the most suitable tools for active pharmaceutical ingredient (API) quantification tasks. Background interference, either absorption or fluorescence from filler matrix, affect univariate regression models negatively. Thus, multivariate partial least squares (PLS) regression should be the method of choice when dealing with more complex samples with multiple ingredients. The silicon photodiode array (PDA) spectrometer, which works in the short NIR region (740–1070 nm), when combined with PLS, proved to be a usable tool only for quantifying efavirenz and isoniazid in powder form. For determining excipient formulation accuracy, all spectroscopic devices generated highly relevant quantitative linear models, giving root mean squared error of cross validation (RMSECV) values between 2% and 6% w/w. For determining both API strength and formulation accuracy, experiment outcomes proved that the DLP NIR spectrometer performed consistently better. In summary, the results from this exploratory study provided some initial evidence that spectroscopy, NIR in particular, holds great potential as a useful low-cost screening tool for not only falsified, but potentially also substandard drug screening with sufficient quantitative or semi-quantitative accuracy.
Footnotes
Acknowledgments
The authors thank Kris Natarajan of Global Good for his help in reviewing the manuscript.
Declaration of Conflicting Interests
The authors declared no potential conflicts of interest with respect to the research, authorship, and/or publication of this article.