
Abstract
This paper compares the signal-to-noise ratio obtained using an InSb photodiode for infrared (IR) polarization spectroscopy to that obtained using an upconversion detector, and shows a factor 64 improvement by the change. Upconversion detection is based on using sum frequency generation to move the IR optical signal to near-visible wavelengths to improve the sensitivity.
Keywords
Introduction
Infrared (IR) detectors are used for a large number of different applications, from monitoring industrial processes to advanced research applications. Most IR detectors are either thermal- or semi-conductor-based, and thermal detectors are limited by their low temporal resolution. Photodiodes are faster, but due to their low bandgap energy, they need to be cryogenically cooled to reduce the Johnson–Nyquist noise, and then they are limited by a high dark current resulting from the thermal background radiation. Upconversion detection has been demonstrated as an alternative approach to IR detection.1,2 Here, sum frequency generation (SFG) in a periodically poled lithium niobate (PPLN) crystal is used to move the IR signal to near-visible wavelengths, so that it may be detected using a silicon-based detector. This circumvents or greatly reduces the noise sources associated with IR detection 2 and eliminates the need for cryogenic cooling.
The use of SFG for IR detection is referred to as upconversion detection, and the module built for this is the upconversion detector (UD). This has previously been shown to greatly improve the detection limit for degenerate four wave mixing (DFWM). 3 Infrared polarization spectroscopy (IRPS) has some advantages over DFWM, notably ease of alignment, the ability to selectively enhance R- and P-branch or Q-branch transitions and a better signal at low pressures. Degenerate four wave mixing and IRPS are both nonlinear techiniques, and in both cases the signal is only generated in the volume where pump and probe beams overlap, giving both techniques spatial resolution. Quantitative concentration measurements have previously been demonstrated using IRPS. 4 This article investigates whether a similar improvement in the sensitivity of IRPS can be achieved by changing from an InSb photodiode to an upconversion-based detector.
This will be done by generating an IRPS signal from known concentrations of CH4 mixed in N2 and then measuring this signal using both detectors.
The Upconversion Detector
The UD used here is similar to one described previously. 2 Two changes have been made. A mirror in the cavity have been replaced. This was done to reduce the beam waist in the PPLN crystal from 180 µm radius to 90 µm, which increases the conversion efficiency by roughly a factor 3.6, to 23.5–36.7%, depending on wavelength. The second change is that the 808 nm laser diode (LD) pump used for the 1064 nm cavity was replaced with an 880 nm LD. This has been done because the upconverted signal from 3 µm light lies close to 800 nm, and the change means that scattered LD pump light can be removed with a filter.
The UD module is built around SFG in a PPLN crystal. For effective SFG to take place, the incoming light must be: polarized vertically to match the extraordinary refractive index of the PPLN, overlapped spatially with the 1064-pump beam, and quasi-phase-matched (QPM) to the 1064-pump beam. Quasi-phase-matched requires the right incidence angle, poling period, and crystal temperature. The optimal conversion efficiency is achieved when the incident light is collinear with the pump. A weak green beam is produced by frequency doubling of the pump beam in the PPLN and using this as a guide beam ensures collinear incidence.
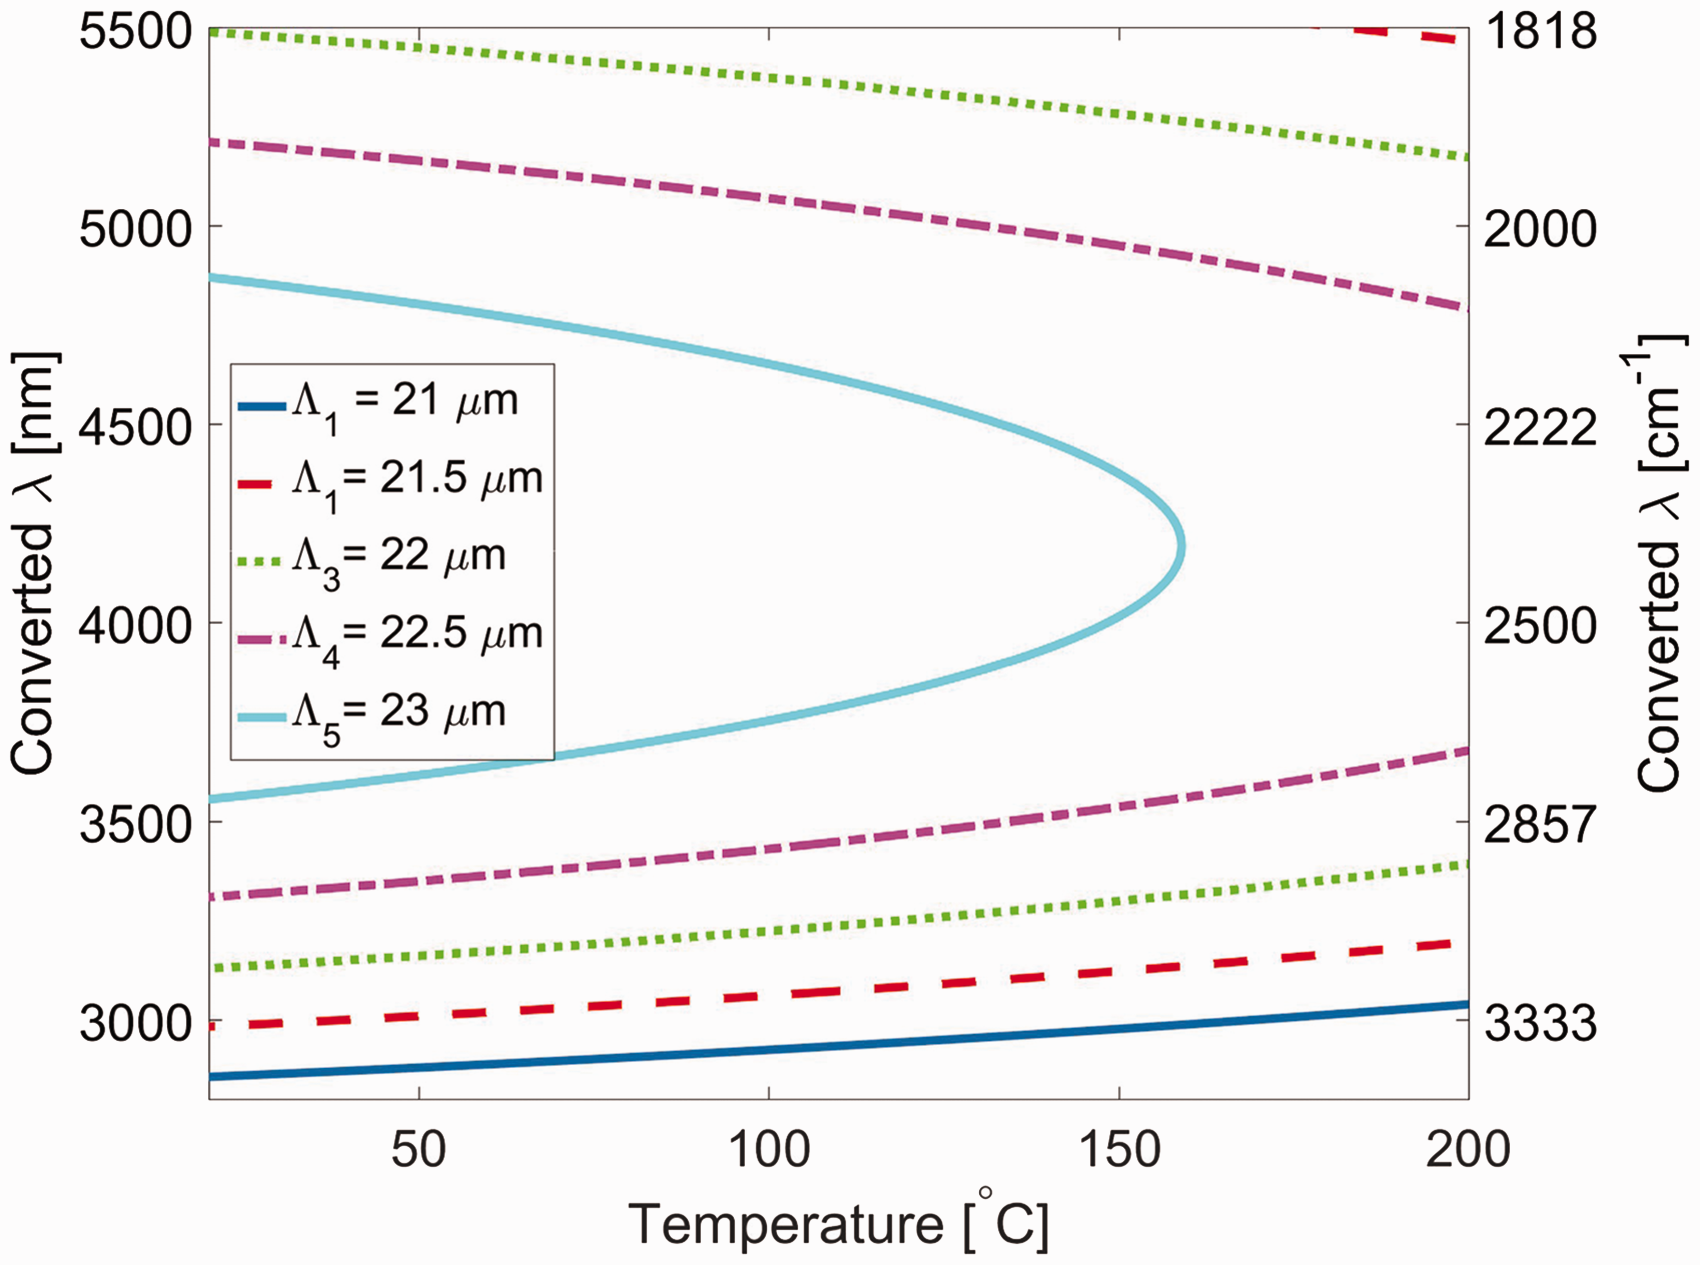
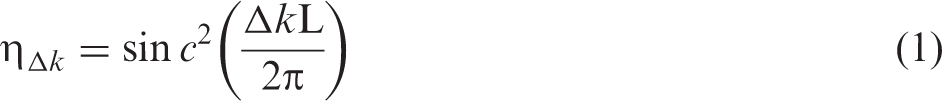
The PPLN crystal used in the UD module had poling periods, Λ, of 21 µm, 21.5 µm, 22 µm, 22.5 µm, and 23 µm. By selecting an appropriate poling period and crystal temperature, any wavelength in the range of 2.9–5.5 µm can be detected, as is shown by the temperature tuning curves seen in Fig. 1. Temperature tuning the crystal is relatively slow, 0.1 ℃s−1, and the 1064-cavity is less stable during tuning. However, at a given crystal temperature, the detector will have a certain spectral acceptance bandwidth. This is determined by an efficiency function:
7
Quasi-phase-match curves for the different poling periods of the lithium niobate crystal. These can be used to find what poling period and crystal temperature to use to detect a given wavelength. The phase-match condition has been calculated using the Sellmeier coefficients given by Gayer et al.
5

The upconverted signal is detected with a silicon-based camera (IDS, model UI-3240CP-NIR-GL). The charge-coupled device (CCD) is at ambient temperature. It is possible to use the UD as a spectrometer, 1 with resolutions up to 0.2 cm−1. However, here we achieve spectral resolution by scanning a narrow linewidth laser, and the signal is collected in one 4 × 4 pixel spot on the camera. This maximizes detection efficiency and reduces the influence of the CCD read noise.
Experimental
Figure 2 shows a simplified diagram of the experimental setup. The IR laser generates 3 mJ pulses at 10 Hz, with a linewidth of 0.03 cm−1. It is used to scan the range 3148–3150 cm−1, to measure the signal from the R(13) line of the v3 band of CH4. This line was chosen because it is isolated from interfering spectral lines and it has a high intensity at standard ambient temperature and pressure. The exact laser setup has been described previously.
8
The IR laser beam is overlapped with a visible guide beam from a HeNe laser, to simplify alignment. A f1 = 500 mm focal length lens is used to focus the beam 4 mm above the burner. The IR beam is split into a weak probe beam and a strong pump beam, using a 7% reflection from a CaF2 window. The probe beam passes through the first polarizer and the pump beam passes through a Diagram of the setup.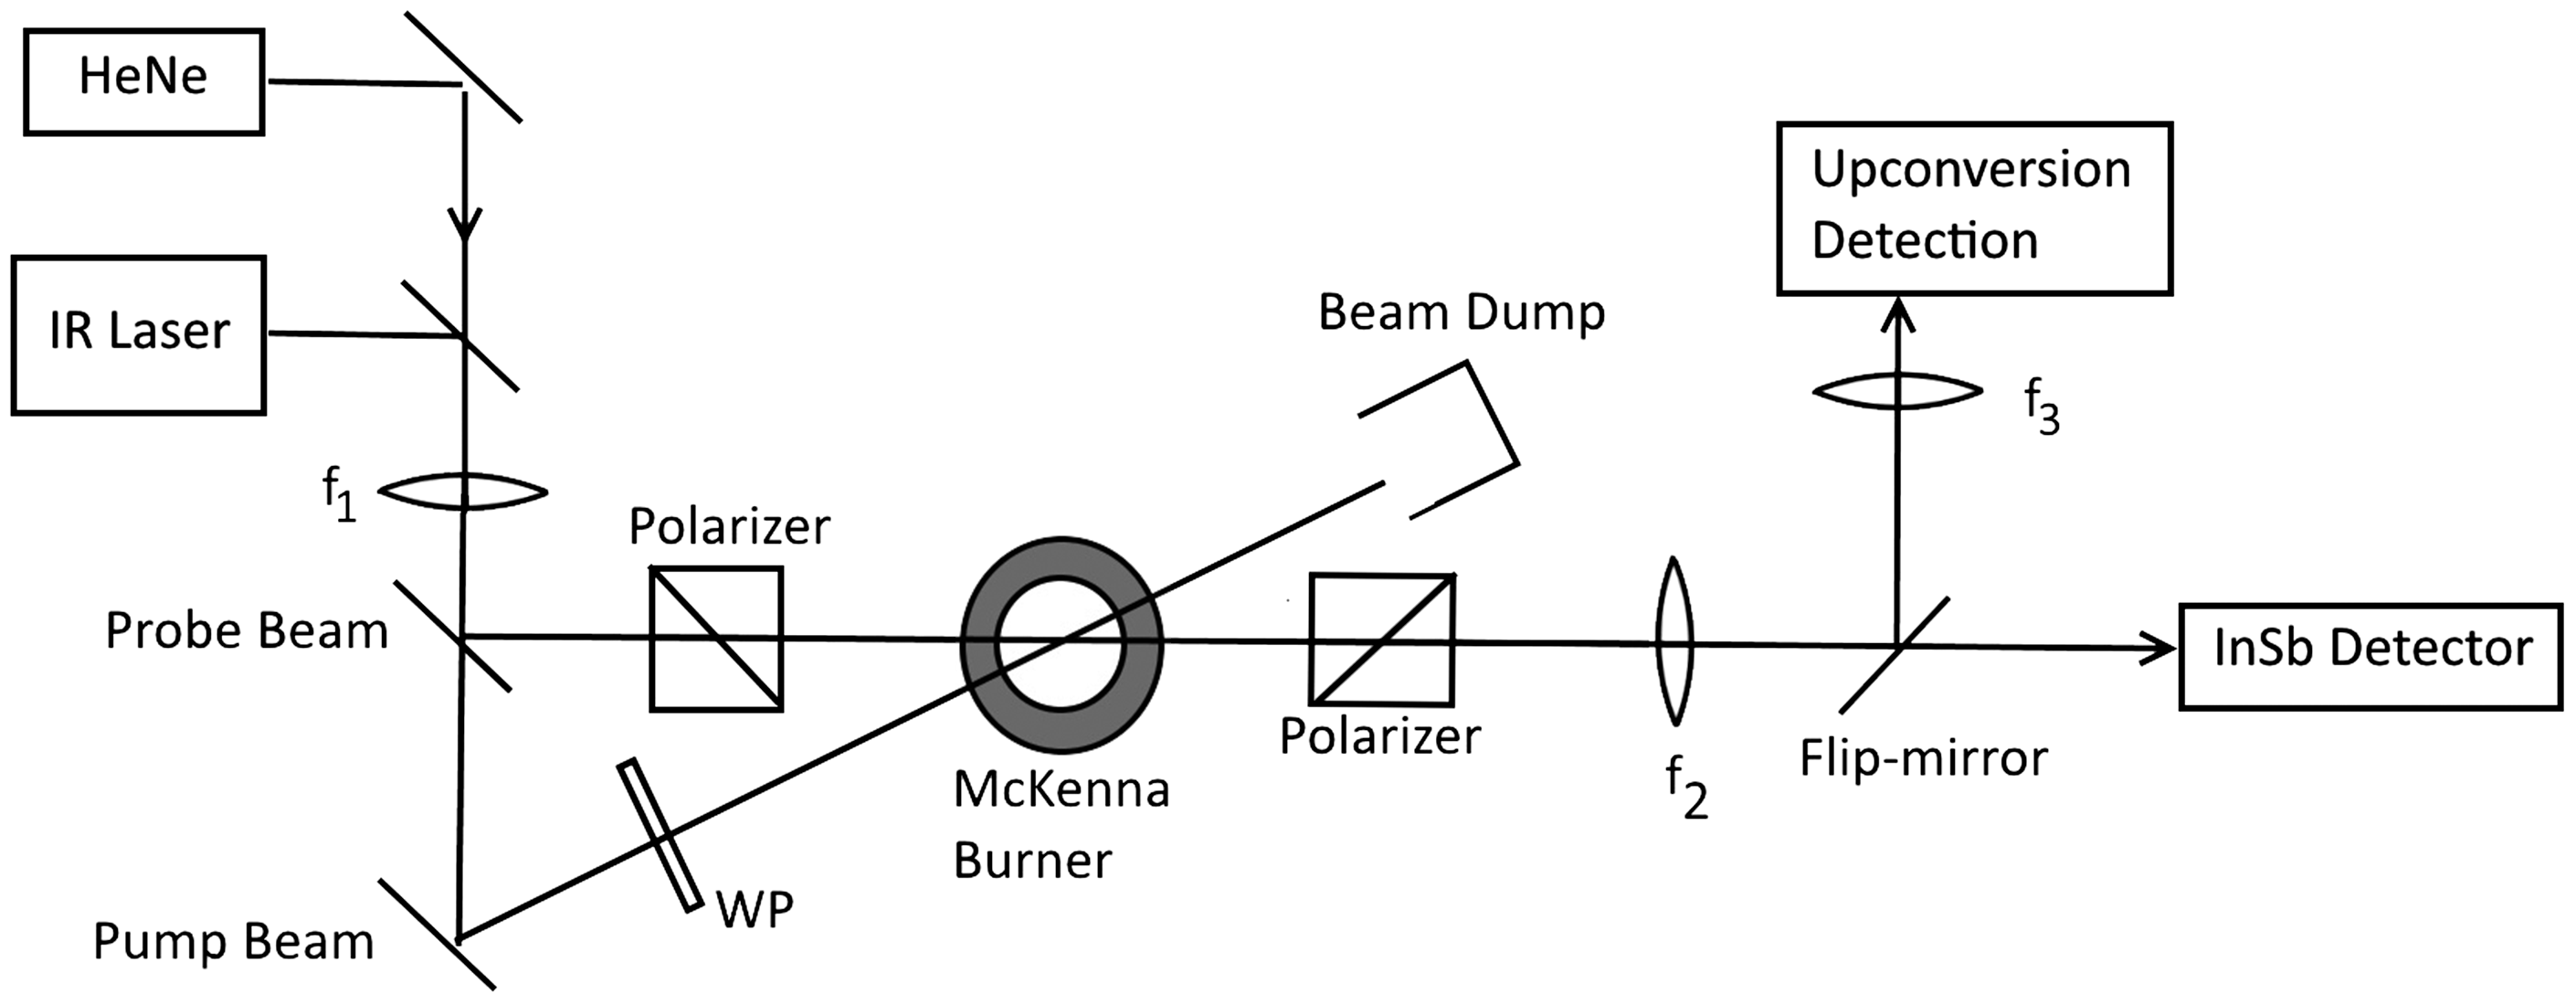
The gas flow is created by mixing the output from three different mass flow controllers (MFC):
a 50 mL/min−1 MFC (BronkHorst, F201CV-050-AAD-33-K) calibrated for CH4 for the CH4 flow; a 15 L/min−1 (BronkHorst, F201CV-FA-33-V) calibrated for N2 for the first N2 flow; a 20 L/min−1 (BronkHorst, F201CV-20 K-AAD-33 -V) calibrated for Ar, for the second N2 flow;
The signal is focused to a spot matching the pump beam in the UD, using a f3 = 100 mm focal length lens. A rough alignment is achieved by overlapping the red HeNe guide beam with the green guide beam from the UD. This is enough to get a visible signal on the UD camera, which can be used to optimize the alignment. Phase-matching the incoming signal is achieved at 62 ℃ and a poling period of 22 µm. The trigger signal from the IR laser is used to time the shutter of UD camera.
The InSb is time-gated using the trigger signal from the IR laser and the signal read out using an oscilloscope (LeCroy WaveRunner 6100 1 GHz). This detector is cooled using liquid nitrogen.
Results
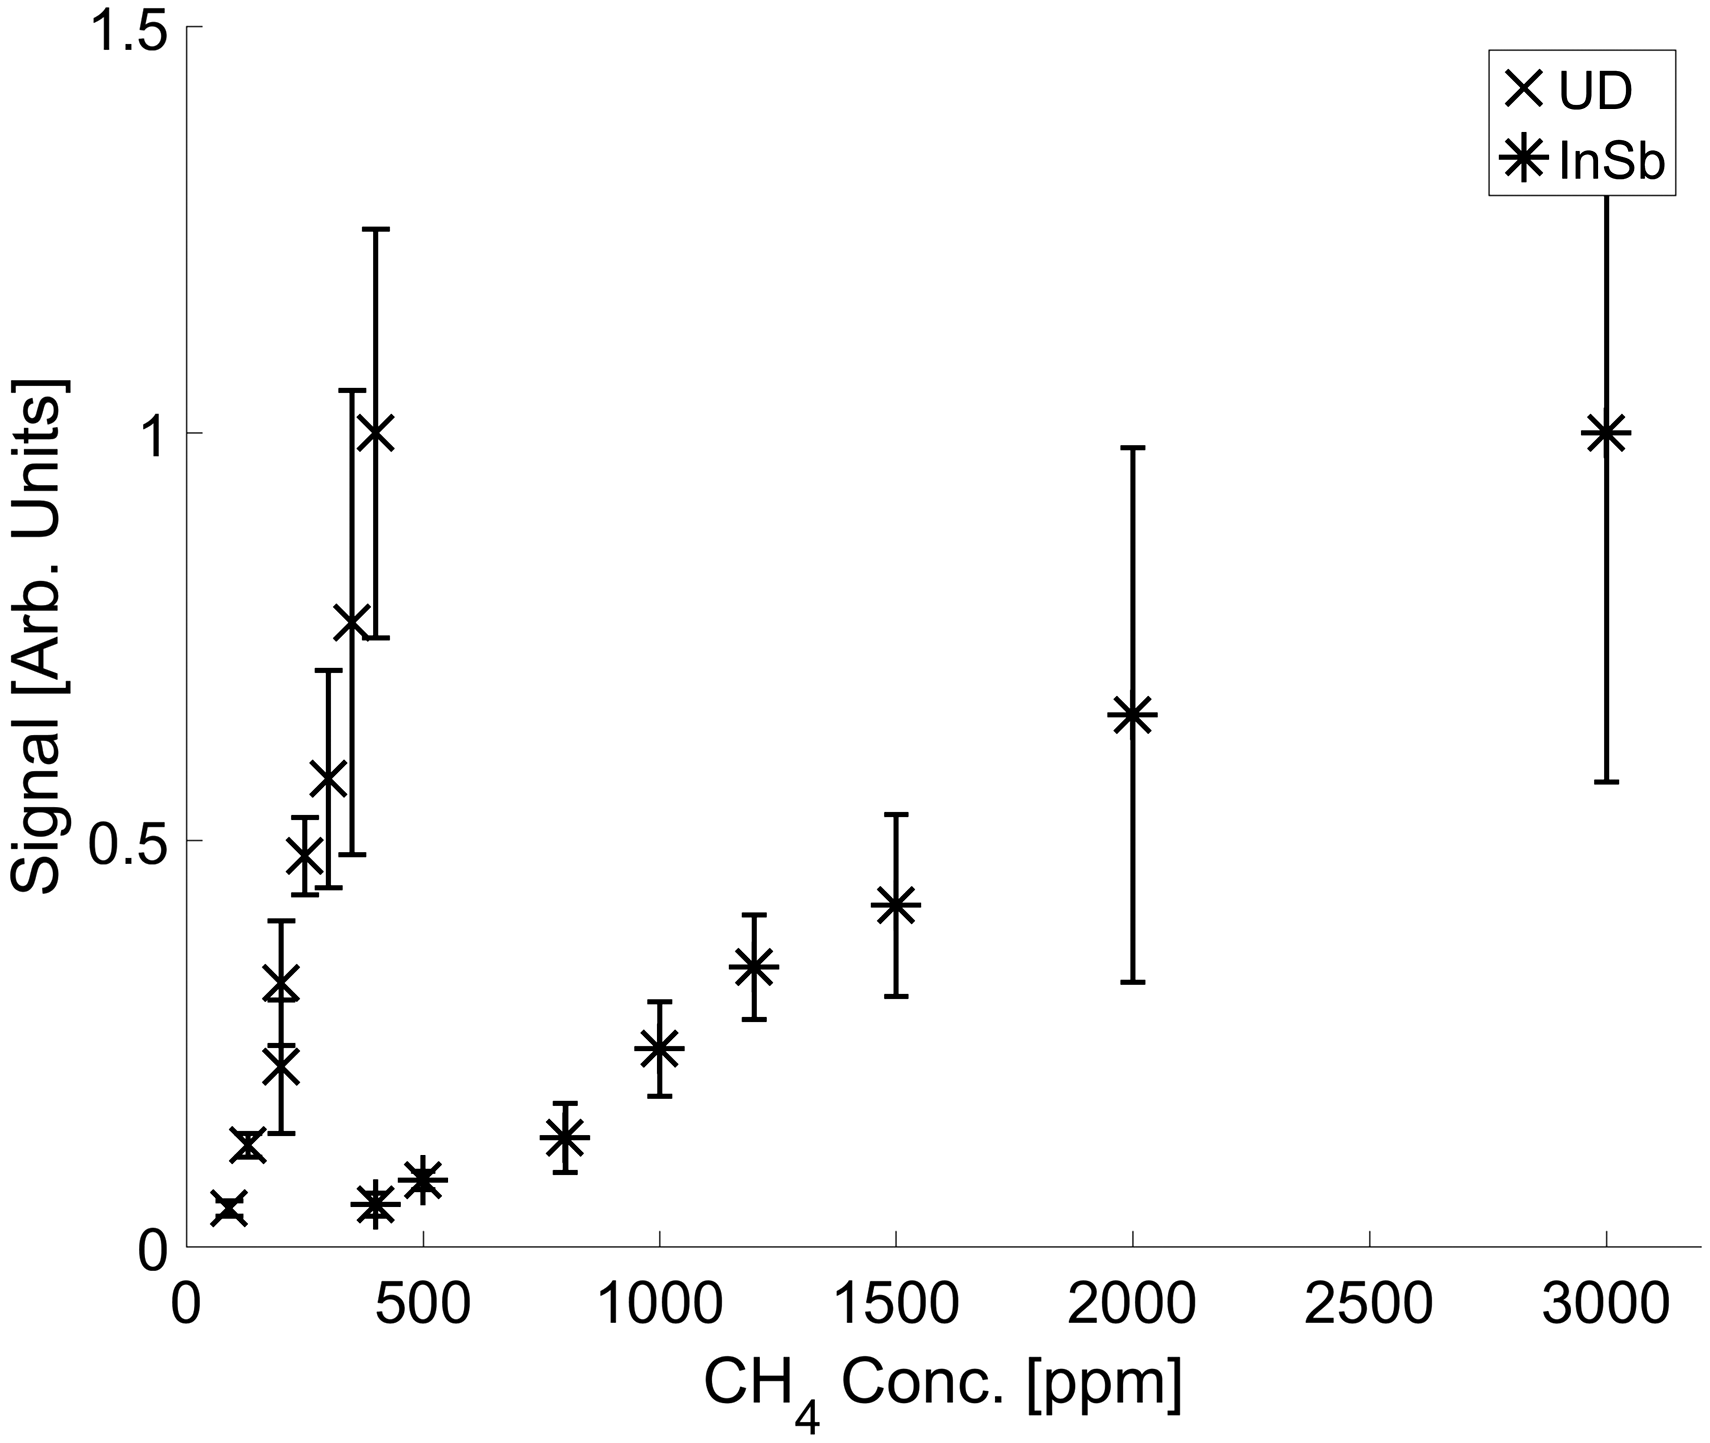
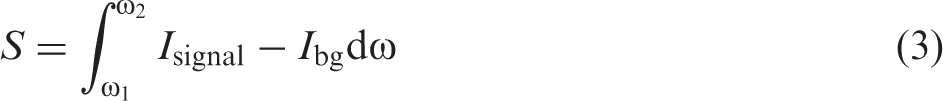
Measurements were made in two series, one for each detector. Known concentrations of CH4 in an N2 flow were made using the MFCs, and the resulting IRPS signals were measured for a range of CH4 concentrations, first with the InSb photodiode, then with the UD. For each measurement point, the IR laser scanned the range 3148–3150 cm−1 five times. The concentration range measured with the UD is 90–400 ppm. At the high end of this range, the UD began to saturate. The line integral of the R(13) line of the v3 band of an averaged scan was used as the signal:
The averaged UD signal from 90 ppm CH4, shown overlaid with the averaged background, and the result when the background is subtracted. The line integral for the signal from both detectors as a function of concentration. The data have been normalized to fit on the same axes.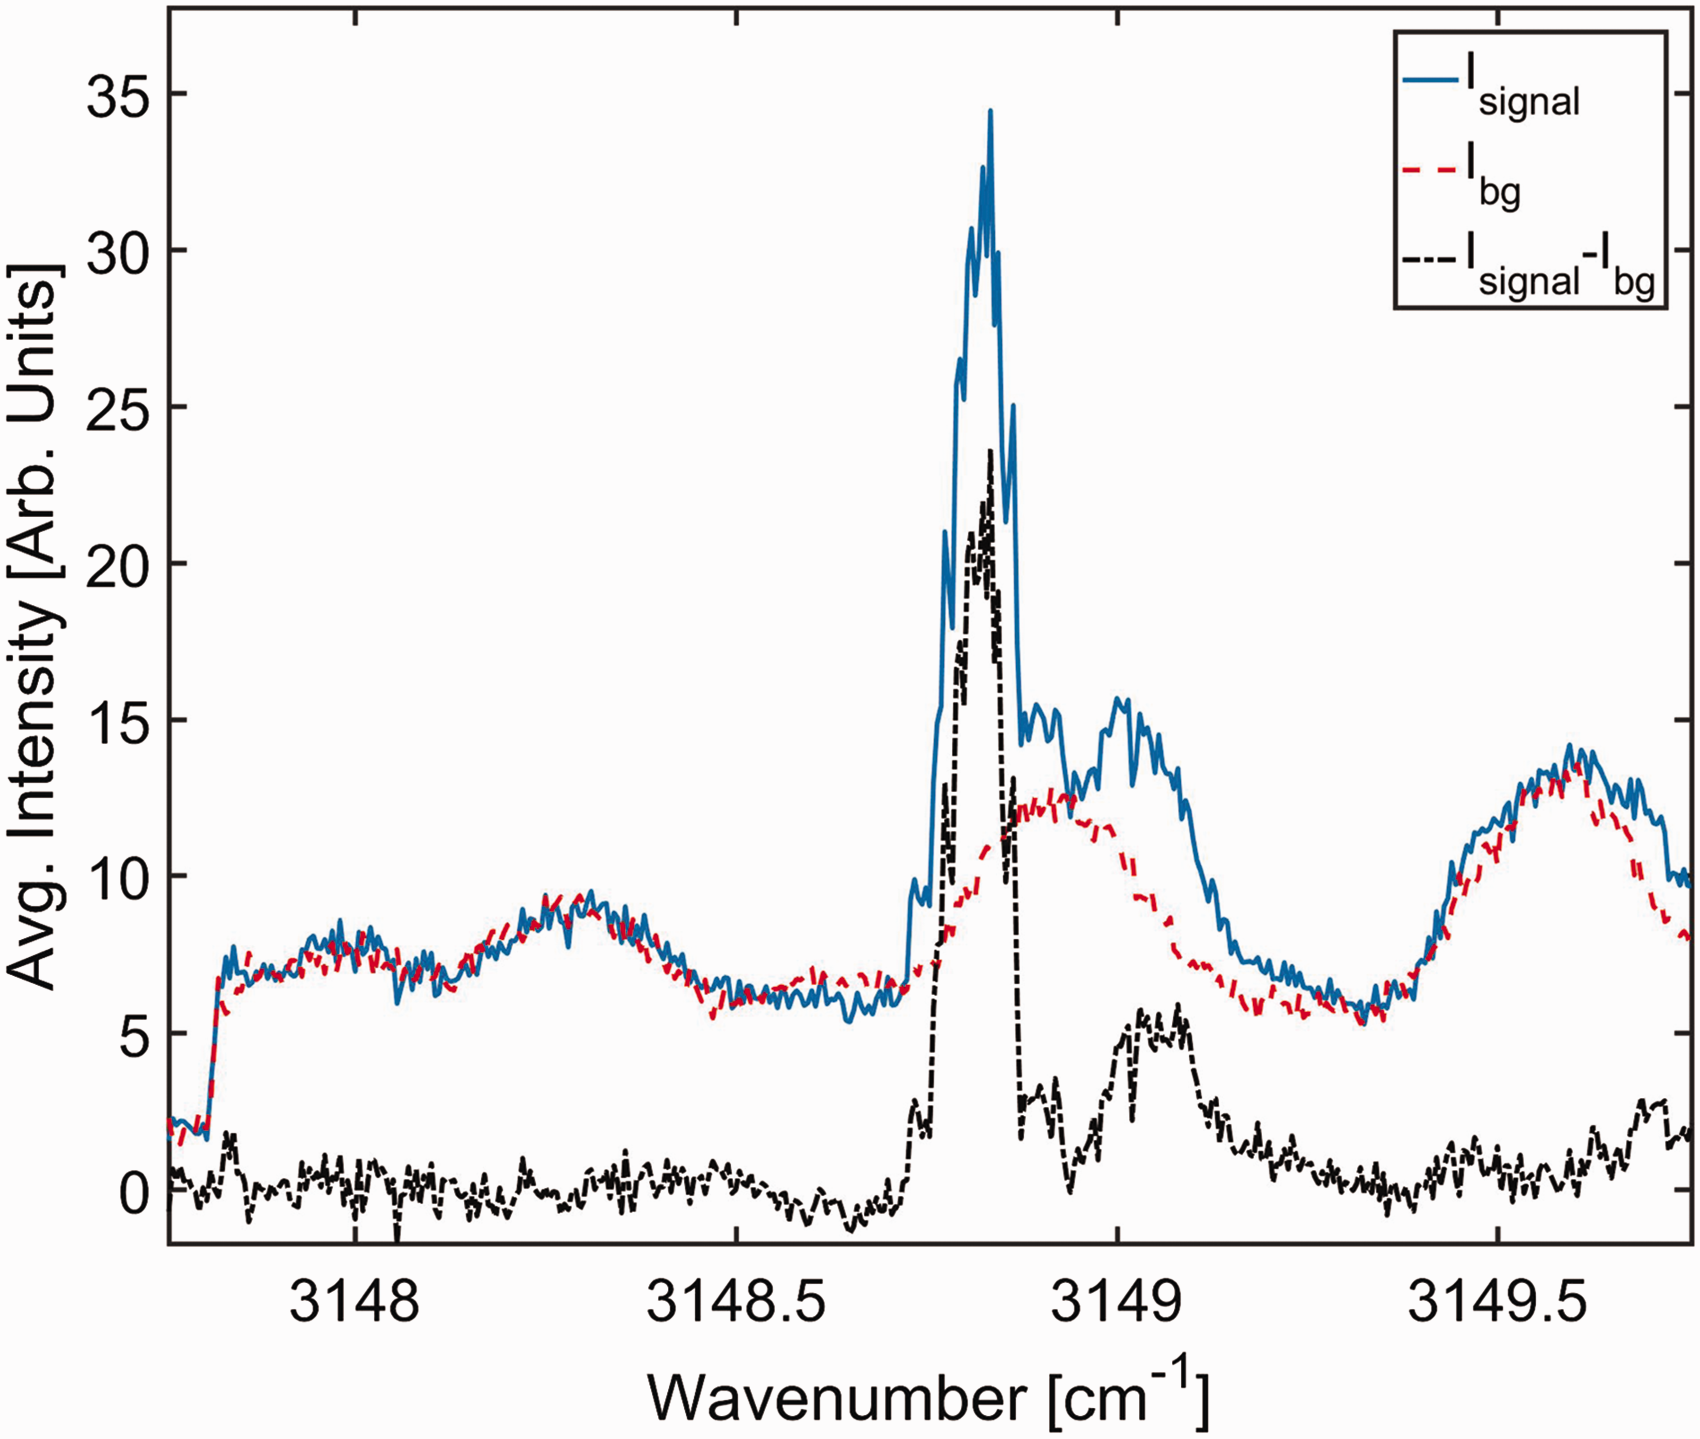
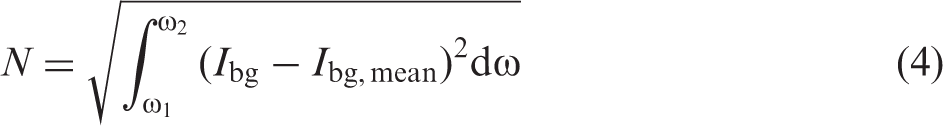
N is the noise power, A comparison of the SNR of signals from the UD and the InSb detector. The fit is made assuming that the signal is proportional to the square of the concentration and all other important factors are kept constant.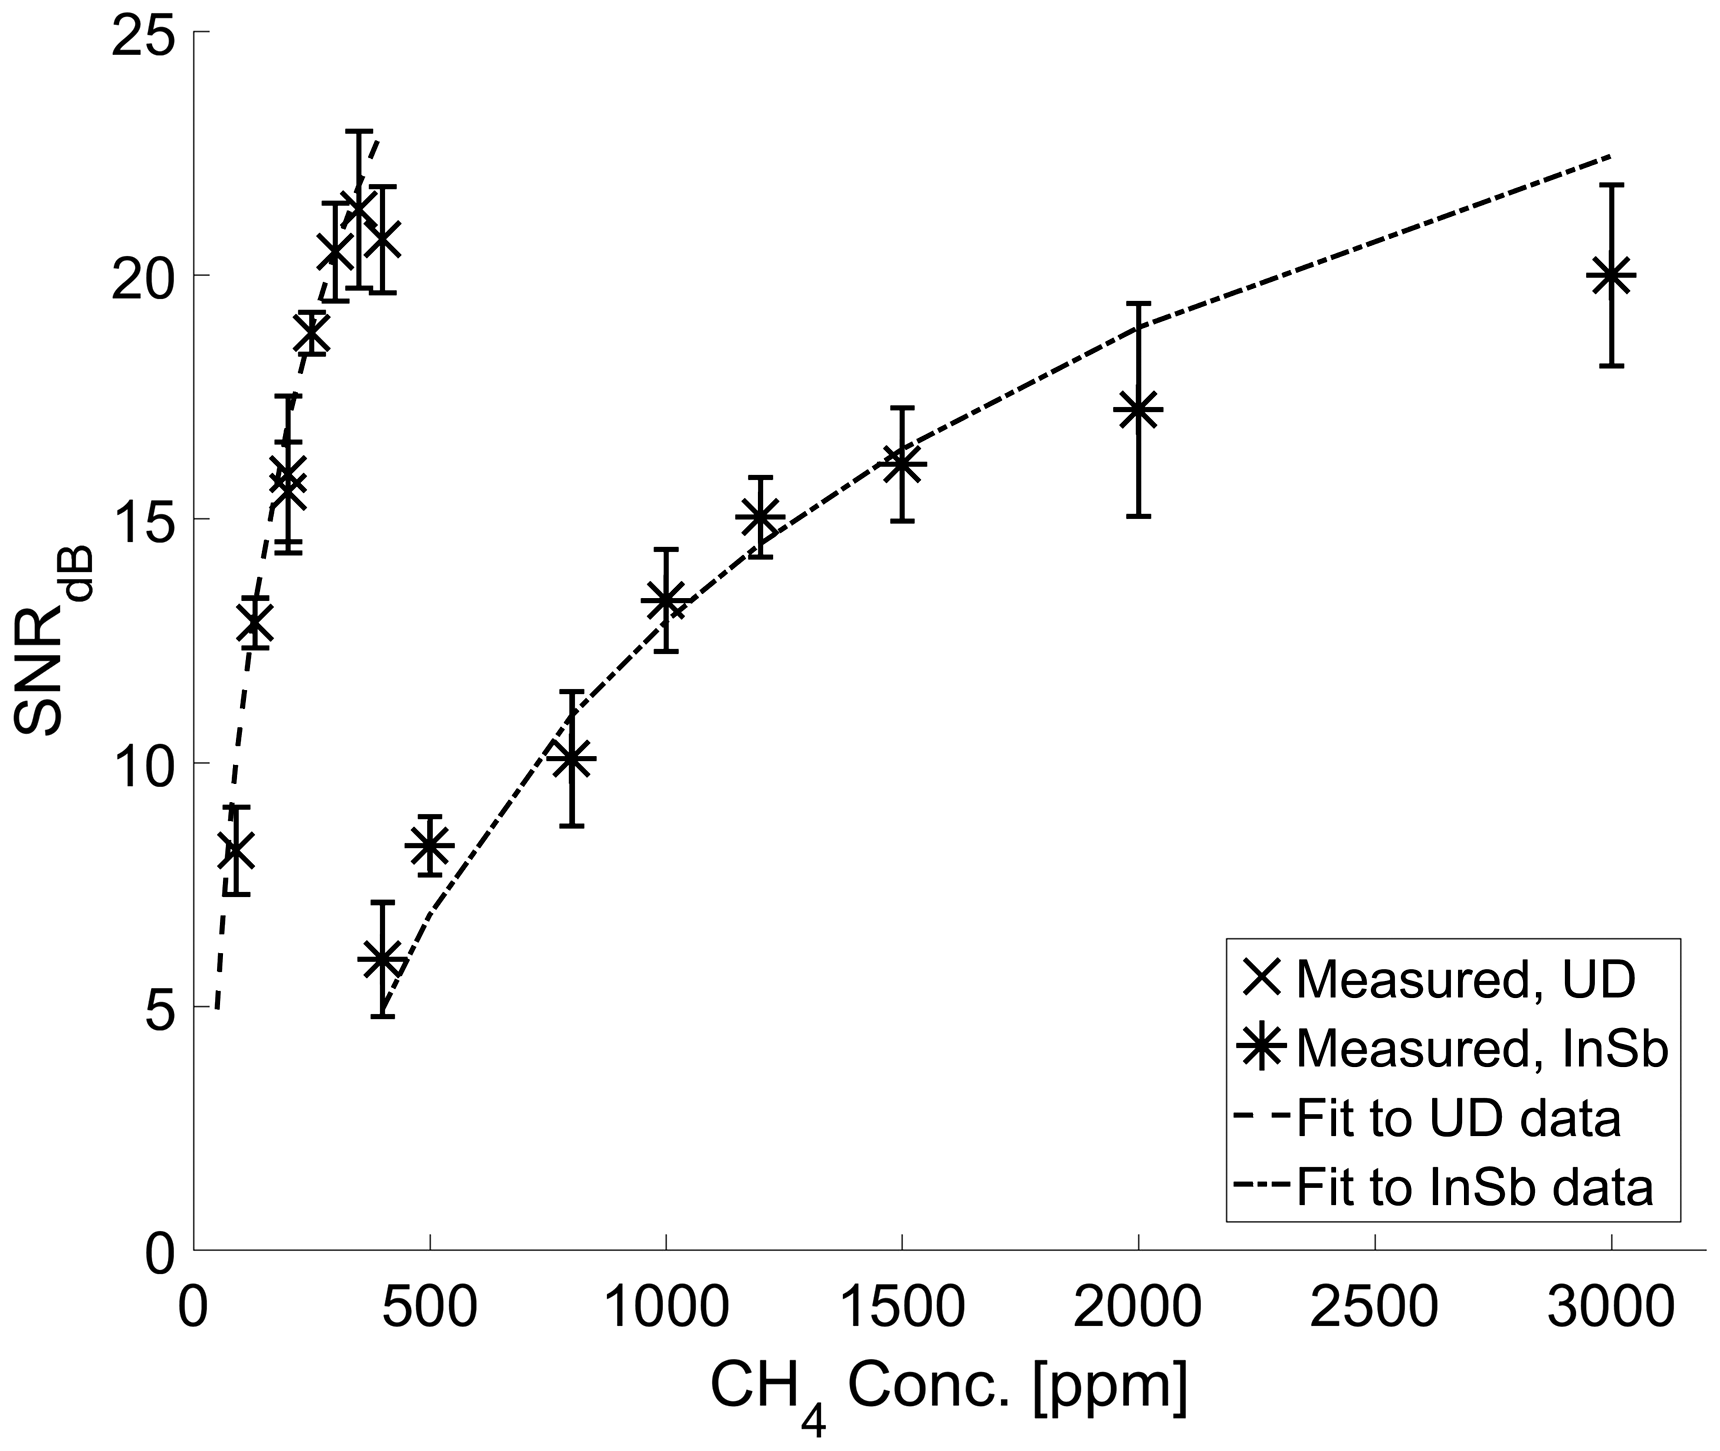

The large uncertainty in the signal has two main sources:
variations in pulse energy, both from pulse to pulse and from scan to scan; and for each pulse, IR laser spectrum consists of two to three longitudinal modes, and the signal will vary depending on how the pulse energy is distributed among these, and this distribution will not be the same for each scan.
To solve these issues, we are working on two possible solutions. The first is using a reference beam to measure the energy of each pulse, to take the variation into account when processing measurements. The second is solution is replacing the current dye laser system with a seeded optical parametric generator. This would remove the longitudinal laser modes and give a more continuous tuning.
The strength of polarization spectroscopy is the high resolution given by the narrow scanning laser and the spatial resolution given by the nonlinear signal generation. These make it possible to use a single absorption line to determine the concentration of a species at different positions in a flame. 4 Alternatively, the ratio of two temperature-sensitive lines can be measured to determine temperature. 9 The end goal of our current work is to increase detection sensitivity and accuracy, so that more minor species can be detected and measured quantitatively, and so that accurate temperature profiles for flames can be determined.
Footnotes
Conflict of Interest
The authors report there are no conflicts of interest.
Funding
Mid-TECHH2020-MSCA-ITN-2014 (642661).