
Abstract
This article reports an evaluation of the impact of horizontal ownership concentration on communications sector access pricing outcomes. Detailed historical data of postacquisition impacts on firms’ access revenue outcomes have enabled analysis for the entire local exchange sector of the United States telecommunications industry. The findings are (1) the sector’s horizontal ownership concentration process has caused key access-providing firms’ average access revenue ratios to be over 16 percent higher; (2) access revenue enhancements, through using market power, by entities belonging to larger groupings, have resulted in aggregate annual fiscal windfalls of between $5 and $6 billion; (3) these windfalls have accounted for between 4.5 and 5 percent of provider firms’ total revenues; (4) on average, each entity evaluated has received approximately between $120 and $150 million in incremental annual revenues via potential overcharge of access rates; and (5) United States telecommunications customers have incurred a between 6 and 7 percent overcharge on monthly bills, over several years, because network access charges have been higher, in part due to horizontal ownership concentration. Access charges are regulated, and horizontal ownership concentration-enhancing deals were allowed only after stringent institutional assessments. The resultant market power exploitation has led to the significant exploitation of United States telecommunications customers. Creation of substantial potential, and across-the-board, inflationary pressures and harm to consumers has been immense. Classic topics, such as access regulation and merger control, remain contemporary, demanding detailed attention, if digital technology is to be ubiquitous in humanity’s service. Concomitantly, key contemporary corporate governance concerns, relating to the emergence of horizontal ownership concentration patterns, also become apposite since the associated outcomes have innate major welfare impacts.
Keywords
I. Introduction
The article evaluates post-acquisition horizontal ownership concentration impact, a major antitrust concern, on firms’ access charge outcomes, an important aspect of regulation, in the local exchange sector of the United States telecommunications industry. In the sector, many incumbent local exchange carriers’ (ILECs) mergers occurred. Sector ownership concentration resulted. 1 Concentration-based market power in network industries is a key concern. 2 Owing to externalities, the impact of such market power exploitation 3 is highly magnified in networks. The analysis evaluates relationships between horizontal ownership concentration, incumbents’ access pricing behavior, and possible market power exploitation, given the role of access charges in digital system. 4 The evaluation is based on detailed, well-documented, publicly available, and extensively used historical data. 5
Equally, corporate ownership markets have become concentrated and monopolized, 6 negatively impacting well-being 7 and enhancing inflationary pressures. Hence, the horizontal ownership concentration issue is germane and provocative. 8 Horizontal ownership concentration 9 occurs via at-least three processes. These are (1) private share placements; (2) stock market dealings by individuals or institutional shareholders 10 ; or (3) merger and acquisition (M&A) deals. 11 Post-M&A market concentration, where deals involve horizontal mergers, when both parties have operated in the same market for products or services, is concerning. 12
Ownership concentration implies that firms coming under horizontal owners’ purview are not, or no longer, independent units as large share block owners exert power over these firms’ decisions. 13 Evidence on horizontal ownership concentration outcomes and market power use, such as its impact on network access charges, is crucial, because of likely risks to competition, likely market power use, and likely stakeholders’ welfare compromises. 14 As ownership gets concentrated, via horizontal processes, a few firms that can deter entry dominate the market space, 15 causing high prices and badly harming consumers. 16 Understanding such concentration’s outcomes is an apposite concern.
II. Article Scope
A. Context
The U.S. telecommunications industry setting is pertinent to evaluate relationships between changing ownership structures and access charges. Network access and interconnections have been important since the sector’s emergence a century ago. With the advent of long-distance calling, networks interconnection provided the means for a call initiated at one point to end at a point some distance away. The sector comprises of layers of numerous networks. All layers access each other, and interconnect with each other to form a network of networks usable by all service providers.
B. General Principles of Interconnection
Access implies the presence of multiple networks operating at different levels, and one network uses another’s facilities for originating or terminating calls. Interconnection is the process of two networks being linked together to provide call origination, transit, and termination services for and among each other. Access and interconnection materially benefit consumers, as anyone can call, or send a message or undertake a digital transaction, with anyone, anywhere, and at any time. Without access and interconnection protocols, the network of networks breaks down and becomes inoperable.
The Internet materially facilitates commerce and communications. Today, most economic activity is web and mobile applications based and Internet-reliant. The Internet depends on interconnected communications network backbones. Local exchange communications carriers deploy the communications network, an essential facility. The communications networks provide platforms for the Internet to work, and the Internet is a network of networks. 17 Thus, networks require continuous multiway connectivity between all elements, for the digital bits to flow from one part of the system to another. 18
All forms of digital communications and transactions, whether for voice, data, commercial, or media uses, also face network access concerns. Unless it is a local call, in the same network, a person calling another person some distance away, merely to talk, will be charged a price for doing so. This price per minute, for call or bit transport and recipient delivery, will include an access pricing element.
C. Charging for Access
How to charge for access, for the supply and usage of a digital network essential facility, is a core issue in digital network economics. 19 Network capital costs are extensive, and operations are extremely costly. Communications network assets are lumpy; they create large sunk costs; and they are expensive. As an example, contemporary infrastructure cost projections estimate a sum of $2.7 trillion for deploying the latest fifth-generation (5G) wireless network systems, of which $1.7 trillion would be needed for the Internet of Things (IOT)-related backbone and backhaul infrastructures and the balance for customer-facing wireless network infrastructures. 20
The costs of supplying connectivity to one part of the network, for digital bits to flow into it from elsewhere, is the access price charged by an essential facility controller. One network firm’s access charges are another network firm’s access cost. In a two-way network, as in all contemporary communications applications, each firm at the edge of a network pays a price for access to the input of the essential network facility provided by another firm. Such transactions occur along a series of horizontal networks, with two firms having reciprocal, but not necessarily equal or symmetric, influence. 21
Spillovers from access charge are consequential. An access charge is a core element of digital-based economic activity, as its determination alters or affects digital goods and services pricing, for almost everything. Yet, it is a price that a final consumer never sees because it is the pricing applied to the costs of the carriage of bits, between many members of a network transporting digital traffic in the background, as a key part of the digital value chain.
A concern is that firms supplying reciprocal access to their networks could charge higher amounts for this access facility. 22 Doing so immediately dampens the scope and extent of digital transactions, and compromises consumer welfare. Being subject to high charging vicissitudes, firms paying for such access would factor in these costs in their own pricing and pass them on to their customers, leading to higher final end-user prices. 23 Conversely, digital competition spreads rapidly when networks have cheap (or free) access to each other’s networks, 24 and the associated network externalities generated increases utility and welfare.
While the access pricing literature is large, 25 the empirical assessments of key conceptual constructs, thoughts, and propositions are absent. Little evidence exists as to what determines access charges and the impact of such charges. Such a lack of evidence and facts engenders debilitating frustration in the designing of digital sector antitrust and regulatory policies.
A reason for limited empirical work on access pricing, and its determinants and consequences, is the lack of appropriate data. Access charges relate to costs borne for wholesale carriage, from higher up the value chain before a customer’s digital service can be delivered. Access charges vary materially. Just as there is no general model of two-way access pricing, there is no one price model defining access relationships. Access charges are based on contractual negotiations and regulatory variations, between each essential facility supplier and essential facility user. These charges relate to many carriage options for different types of bits associated with voice, data, and media transport; and they relate to numerous temporal options since different types of bits have demand for different transportation needs at different times of the day.
D. Unique Data Characteristics
Using distinctive data (as described below) on the relative share of access revenues to total revenues earned by telecommunications companies obviates many factual deficits:
1. For the local exchange sector of the U.S. telecommunications sector, historical data for the full sector, based on facts for the top forty-one firms, making up 99 percent of the sector, are available for a critical historical era between 1988 and 2001.
2. Share of annual access revenues to total revenues earned, by each of the 574 firm-level and time-specific (41*14) observations, from within their territories for transporting third parties’ digital bits on their networks, have been documented.
3. The forty-one entities have each been owned by many horizontal ownership controllers. In the period, numerous ownership change events of these operating companies between horizontal ownership controllers occurred. Such changes led to congeneric mergers, based on horizontal acquisitions of the horizontal ownership controllers.
4. When carried out, the ownership transactions assessed were the world’s largest, involving complete, and not partial, takeovers. They were long-running episodes, over two decades, of then-largest serial consolidation events occurring anywhere.
5. Historical data on all sector takeovers, and for access revenues generated from each unit’s market domain, permits evaluation of horizontal ownership concentration impact on important economic variable for an essential facility.
6. These deals have led to concentration of firms’ ownership and emergence of highly centralized sector asset control. The analysis has evaluated congeneric and not specific horizontal acquisition deals of the type that combining two entities’ businesses in the same market would affect competition in that particular market.
7. Hence, each of the operating companies (ILECs), acquired by one of the horizontal ownership controllers, would not collude or compete with another operating company or ILEC in the same market space owned by a common parent; instead, after ownership consolidation in two separate market spaces, such commonly owned firms could coordinate with sister ILECs to compete strongly with entering competitive local exchange carriers (CLECs), which after 1996 were permitted entry to ILECs’ markets, entering their own specific market domains.
8. A large horizontal ownership controller could control many ILECs in disparate markets and compete strongly against new entrants in these markets via commonly-owned firms. Ownership concentration would lead a few large horizontal ownership controllers to exist. Such large ownership controllers could collude, via presence in multiple local markets, to keep third-party entrants away. These horizontal ownership controllers could ensure that owned ILECs enhance access charges to keep new entrants out of designated markets.
9. If the occurrence of horizontal ownership concentration were to be causally linked to a greater access revenue share, for a cross-section of ILEC firms, the finding would indicate market power exploitation 26 and undermining by local entities of the access charges regime. 27
10. A feature of the present research has been data detail, as follows: [a] ownership identity has been documented at operating company (or ILEC) level; [b] changes to operating company identities, due to horizontal acquisitions, have been tracked; [c] detailed sector horizontal ownership concentration patterns have been compiled; and [d] detailed observation-level access revenue share data obtained.
11. The study uses granular data for a complete sector. For every ILEC, which have been local monopolists for part of the period, explicit access revenue data for the specific markets in which each company has operated, are available.
12. The results obtained comprehensively denote the causal relationships established between horizontal ownership concentration and access charges.
III. Sector Ownership Contingencies
This section (based on details recorded in prior work 28 ) deals with sector ownership changes and asset control centralization. Horizontal ownership evolution has been tracked for the forty-one (41) ILECs operating in its specific territory, in each year, for the entire fourteen-year (14) period.
A. Evaluating Horizontal Ownership Concentration
The unit of analysis for horizontal ownership tracking has been each of the forty-one ILECs, in each year (also called entities), for the fourteen-year period. This part describes horizontal ownership spread at operating company (ILEC or entity) level. 29 At the beginning year (1998) of the analysis, there were fifteen (15) horizontal ownership controllers including seven (7) RHCs. They controlled the forty-one (41) ILECs. Over time, the process of acquisitions has led to a decline in numbers. A smaller ILEC entered the data set in the early 1990s. As at the ultimate year of analysis (2001), because of consolidation and ownership concentration, there were eight (8) horizontal ownership controllers for the forty-one ILECs. These were Verizon, Bell South, SBC, US West, Cincinnati, United, Citizens and Lincoln.
A list of the relative size of the ILECs under each of the horizontal operating company controllers, as at 1988 and 2001, is available. 30 As at 1988 there were fifteen horizontal operating company controllers in existence and the largest was Bell South. Its share of the sector’s total assets was 14.31 percent. The smallest was Lincoln, with a share of sector total assets at 0.16 percent. All horizontal operating company controllers had under fifteen percent share of sector assets. SBC was seventh in the list, and last among all the RHCs, with a share of the sector total assets at 8.93 percent. An Asset Herfindahl Hirschman Index (AHHI) was 1056.45 for 1988.
Of eight entities in existence in 2001, the top four were Verizon, SBC, Bell South and US West. Each of them controlled at least one of the largest among the top five ILECs. United was a very distant fifth in the list. The largest such horizontal operating company controller, ranked by number of companies controlled, was Verizon, which controlled eighteen ILECs. At that time, it was the largest horizontal operating company controller ranked by its share of sector assets.
A few years after the end-date for this analysis, in the mid-2000s, Bell South was acquired by SBC. The combined entity called itself AT&T, though this was not the erstwhile monopolist AT&T to be restructured in the 1980s. With the mid-2000s takeover of Bell South, and the AT&T name re-emergence, the market was further consolidated. SBC re-named itself AT&T and emerged as the dominant United States communications market player. If the asset values, as at 2001, of Bell South and SBC were to be combined, the putative entity would control over 49 percent of the sector’s assets. SBC, now AT&T, has enhanced its share of sector assets from less than a tenth, at the start of analysis date, to half of sector assets in less than two decades. The AHHI value was 2747.65 for 2001, and 3807.83 after adding SBC and Bell South asset shares. The rise in the value of the index shows the extent of concentration to have risen over three-and-a-half times within two decades (3807.83/1056.45).
The process of sector re-concentration is brought out by evaluating the share of the largest, the two largest, the three largest, the four largest and the three smallest entities’ share of assets between the mid-1980s and the mid-2000s, by when the sector was consolidated. 31 The largest entity in 1988 was Bell South, which disappeared in the mid-2000s, with 14 percent share of sector assets. By the mid-2000s, the largest entity was Verizon with control over 35 percent share of sector assets. After consolidation, the largest entity has controlled two and a half times the sector’s assets relative to the largest entity’s asset control prior to the process of consolidation. In the late-1980s, the largest two entities (Bell South and Nynex) controlled 28 percent of sector assets. After consolidation, the two largest entities (Verizon and SBC) have controlled 85 percent of sector assets. This has led to the three times asset control enhancement noted.
In the late-1980s, the three largest entities (Bell South, Nynex and Verizon [originally Bell Atlantic]), controlled 40 percent of sector assets; by the mid-2000s, the three largest entities (Verizon, SBC and US West) controlled 95 percent of sector assets. This has been two and a half times overall enhancement of asset control. In the late-1980s, the four largest entities (Bell South, Nynex, Verizon [originally Bell Atlantic] and Ameritech), controlled 51 percent of the sector assets; by the mid-2000s the four largest (Verizon, SBC, US West and United) controlled 99 percent of sector assets.
The three smallest entities (Cincinnati, Rochester and Lincoln) controlled 2 percent of sector assets in the late-1980s; in the mid-2000s, the three smallest (Cincinnati, Citizens and Lincoln) controlled 1 percent of sector assets. Asset control had been trivial. Even this level of asset control diminished by more than half. Sector re-concentration has been comprehensive. 32
The horizontal operating company controller US West, acquired by Qwest in 2000, was later acquired by Century Link, an Internet services provider (ISP). Qwest lost its communications services provider identity; Cincinnati, United, Citizens and Lincoln have remained communications services providers. These entities have controlled a trivial portion of sector assets. Ownership re-concentration has been all-encompassing. Sector ownership control has become skewed. Horizontal ownership concentration has resulted in two extremely large companies: SBC (now AT&T) and Verizon, controlling 85 percent of the sector; one small-sized company, United (brand name Sprint), and three small companies in very specific markets: Cincinnati, Citizens and Lincoln.
The acquisitions process has continued across technology types. In October 2004, the DOJ approved the $41 billion merger of Cingular Wireless and AT&T Wireless Services. Cingular had been a joint venture of SBC and Bell South, then two large horizontal ownership controllers. Through that deal, AT&T became the market leader, bypassing the previous incumbent, Verizon, which itself was the product of a stream of several acquisitions.
B. Tracking Horizontal Ownership Evolution Processes
This section is based on details obtained from prior works. For each ILEC, its ownership status as belonging to any of the initial fifteen horizontal ownership controllers has been tracked. 33 Any ownership change over time has been coded appropriately. If an entity, with a specific identifiable observation code, was acquired by another horizontal ownership controller, it would come out of the purview of its erstwhile owner and fall under the umbrella of its new owner, as long as that owner kept possession. For full details see the listing in prior work. 34 These include the lists of codes to identify evolution of horizontal ownership patterns. The articles list each ILEC in terms of ownership status and takeover activity, and provide coding process details. A summary of the number of codes assigned to the 574 observations as grouped under each horizontal ownership controller is given in prior work. 35
C. Assessment of Concentration, Control and Oligopoly Emergence
The extent of entities controlled vis-à-vis assets controlled by horizontal ownership controllers is described. The percentage of assets controlled, as at 2001, for the top four groups: Verizon, SBC, Bell South and US West have been, respectively, 35 percent, 34 percent, 16 and 10 percent of sector assets. The four groups controlled about 95 percent of the sector’s assets. The total number of entities (ILECs) coming under each grouping, and the proportion of entities in the total sample controlled by each of the big four were: Verizon 258 entities accounting for 44.95 percent of total entities, SBC 126 entities accounting for 21.95 percent of total entities, Bell South 14 entities accounting for 2.44 percent of total entities, and US West 14 entities accounting for 2.44 percent of total entities. The four groups together controlled 72 percent of entities but 95 percent of assets.
Based on details in prior analyses, 36 an imbalance index of the share of assets and entities controlled by the big four horizontal ownership controllers versus the rest has been constructed. The share of assets controlled in 2001 by the top four has been at 95 percent, and the rest at 5 percent. The share of entities (ILECs) controlled in 2001 by the top four has been 72 percent, and the rest, at 28 percent. The ratio of asset control to entity (ILEC) control is 1.32 times for the top four groups, while this ratio is just 0.18 times for all the other smaller sector entities. An imbalance index, of the extent of asset share versus entity share for top four groups versus the rest of the smaller groups controlling the smaller entities (ILECs) is 7.39 times (1.32/0.18).
IV. Empirical Analysis
A balanced annual data panel obtained from the FCC Statistics of Common Communications Carriers (SCCC) is used for causality analysis. 37
A. Outcome Access Revenue Variable
Total access revenues earned, as well as total access costs incurred, details are provided in the SCCC. The dependent variable evaluated has been the ratio of firms’ average access revenues to total revenues (Access). This is a granular measure of firm-level access income that ever can be obtained, given the paucity of exactly specific access charges data. ILECs have earned access revenues by providing two types of access: vertical access and horizontal access. Vertical access relationships have arisen when ILECs have permitted long-distance carriers’ calls to ILECs’ customers to terminate on its network. Conversely, ILECs would pay access costs if its own customers made calls to long-distance carriers and these calls would terminate on such operators’ networks. These sums would be other operators’ access revenues.
After competition introduction, following the Telecommunications Act of 1996 (TA 1996), ILECs would engage in horizontal access relationships with new entrants, and these entrants would not only seek call termination for calls originating on their networks on ILECs’ networks, but also use portions of ILECs’ networks for carriage of their own traffic, by piggy-backing on these networks. 38 This feature arose after the introduction of TA 1996, after which CLECs could purchase unbundled network elements (UNEs) from ILECs to provide services to their own customers, and this step might obviate the investment by CLECs in expensive network facilities.
Dominant network firm can use access charge decisions to deny access to essential inputs produced, hence enabling market foreclosure and degrading rivals’ businesses. In the case of vertical relationships, which the ILECs interactions were with downstream long-distance providers whose calls had to be transported to ILECs’ networks, and vice-versa, foreclosure would provide ILECs the monopoly power on the downstream market for long-distance providers’ business models to turn sour.
In addition, competitor entry had increased after introduction of TA 1996. 39 In the case of horizontal relations, which ILECs entered into with CLECs, after TA 1996 promulgation, foreclosure could result in a network with a dominant group architecture in which the larger entity would enjoy superior rents and perpetrate network tipping so that then all customers would gravitate to the larger network.
Internet service providers may deal with the access problem being dealt with using a nonprice foreclosure strategy based on a choice of interconnection quality levels between two backbones. 40 With asymmetry, and unequal market shares, if the network with most customers were to offer low-quality interconnection to other networks, this would lead to market tipping and dominance of the larger network as smaller network customers would leave and gravitate to the bigger, and better, network.
The specific type of competitor could be a reseller, an unbundled lines lessee or a facility-based entrant. CLECs invested large sums in infrastructure 41 ; hence, many entrants would be facilities-based new infrastructure investors incurring large costs and seeking cash flow stability. Such CLECs would be in a reciprocal vertical relationship with the ILECs, and high network access charges by the ILECs could cause CLECs fiscal crises. ILECs’ ability to enjoy a relatively higher ratio of access revenues to total revenues could denote the use of economic power and market dominance vis-à-vis other network entities.
B. Primary Ownership Explanatory Variables
This subsection deals with ownership identity assignments. For each ILEC, its ownership status as belonging to any horizontal ownership controller has been recorded for each point in time. To generate the primary ownership variable, three variable categories are used. These are (1) small asset control (Small Asset Control), (2) medium asset control (Medium Asset Control), and (3) large asset control (Large Asset Control) categories.
In the small asset control category, in the initial year stand-alone entities Cincinnati, Lincoln, Rochester and SNET, and operating entities belonging to the Centel and United groupings are placed. An individual operating company, Puerto Rico Telephone Company, though under the GTE umbrella, does not operate in any of the 50 States, including Alaska and Hawaii, but in a United States overseas territory and is placed in the small asset control category for the full period.
Should companies that were initially placed in a specific category be taken over in a later year, by a group classified as the medium asset control or large asset control category, the code assigned is appropriately modified from that year onwards to reflect ownership status as an entity now coming under a medium asset control or large asset control umbrella. Citizens is classified as a small asset control category entity from the year it appears in the data and for the rest of the period.
For the initial year, all companies belonging to other horizontal controllers, such as Ameritech, Bell South, Contel, GTE, Nynex, Pacific Telesis, SBC, US West and Verizon, are coded as medium asset control entities. By the end of the study period, Verizon and SBC are the two largest sector asset controllers, and between them, they control 69 percent of the sector’s assets. All operating companies coming under the Verizon and SBC ownership umbrella over time have been classified in the large asset control category. SNET, an independent company, belonged in the small asset control category until its takeover by SBC, and since that year of acquisition has been placed in the large asset control category.
For each year within the entire period, each of the forty-one observations has a specific code assigned to it as to whether it has belonged to the small asset control category, medium asset control category or large asset control category. Of the 574 total observations in the sector, 68, 320, and 186 observations have belonged to the small asset control category, medium asset control category, and large asset control category, respectively. These account for 12 percent, 56 percent, and 32 percent, respectively, of the total observations.
C. Initial Causality Estimates
Treatment effects modeling 42 has been used to assess the horizontal ownership concentration and access charge relationship. Associating with a particular horizontal ownership controller is a treatment an observation receives. 43 The counter-factual effects of horizontal ownership on access charges are evaluated as an outcome in comparison to a control group of firms not experiencing ownership by a horizontal operating company controller.
Using a binary treatment variable, (value of 1 as indicating an observation coming under the purview of a horizontal ownership controller, and 0 as the nonhorizontal ownership control), potential outcomes are defined for each observation as results under treatment (under a specific horizontal ownership category) and control (not under that specific horizontal ownership category) conditions. Difference in outcomes, for each firm if it had experienced a particular ownership contingency for the period and relative to other companies in its cross-section, are thereby evaluated.
D. Controlling for Transaction-Affecting Access Revenue Volumes
Access revenue shares are a function of both access price and transaction volumes. Many factors drive business volumes, as other firms seek to access ILECs’ networks. To strip out transaction volume effects affecting access revenue shares, isolating access price effects only, key variables are included. These isolate the access charge variations arising due to ownership concentration effects. Co-variates capture scope, scale, density, and other volume-impacting volume effects in networks.
1. Network Quality
First, the quality of network technology deployed by an ILEC 44 (Hatfield et al 2005) could generate demand for its access services, as external parties would seek greater connectivity to a better network with more scope for generating a variety of services. Hence, the first control variable has been a measure of network quality measured as digital lines’ extent (Digital) in the network.
2. Network Competition
Second, the greater the number of competitors in a networked market, the greater could be the demand for access and interconnection. Thus, a count variable (Competition) has been used as a measure of the number of competitors to have entered each firm’s territory.
3. Network Size
Third, network size (Size) would generate greater network effects, 45 and these would be an inducement for firms seeking interconnecting access to ILECs’ networks. The variable measured as the log of total revenues further strips out the scale and network magnitude concerns in isolating what may have precisely affected access charges.
4. Urban Density
Business volumes would be affected by the scope and quality of an ILEC’s commercial environment, because of density effects, affecting access revenues shares. Interconnectors would prefer to deal with urban-based ILECs. To control for such possible urban-density effects on access revenue shares, an Urban variable is used. The urban population ratio (Urban) has been the weighted average ratio of urban population to total population in each firm’s territory. This ratio has been weighted by the fraction of lines a firm possesses operating rights to in a state or states.
5. Business Customers
Interconnectors would also prefer dealing with ILECs that have a greater proportion of high-spending, and lower price elasticity, business customers. A business lines construct has been created as the ratio of total business to total access lines for each firm (Business).
6. Market Share
ILECs were mandated as local monopolies, and a market share construct has been used to proxy for possible residual market power an ILEC might exercise in generating higher access revenue levels. The market share variable has been constructed by taking the ratio of a firm’s total number of lines across the states operated in relative to the total number of all lines in these states (Share).
E. Primary Estimates
Figure 1 displays average values for the Access variable, computed as an average of the variable for all firms in all territories, over each period. Between 1988 and 1995, there were ups-and-downs in growth patterns, and many years of negative growth. Between 1996 and 2001, there has been continuous growth in this variable. This could have been due to generic market-opening effects and ILECs’ exploitation of market options after TA 1996 promulgation.
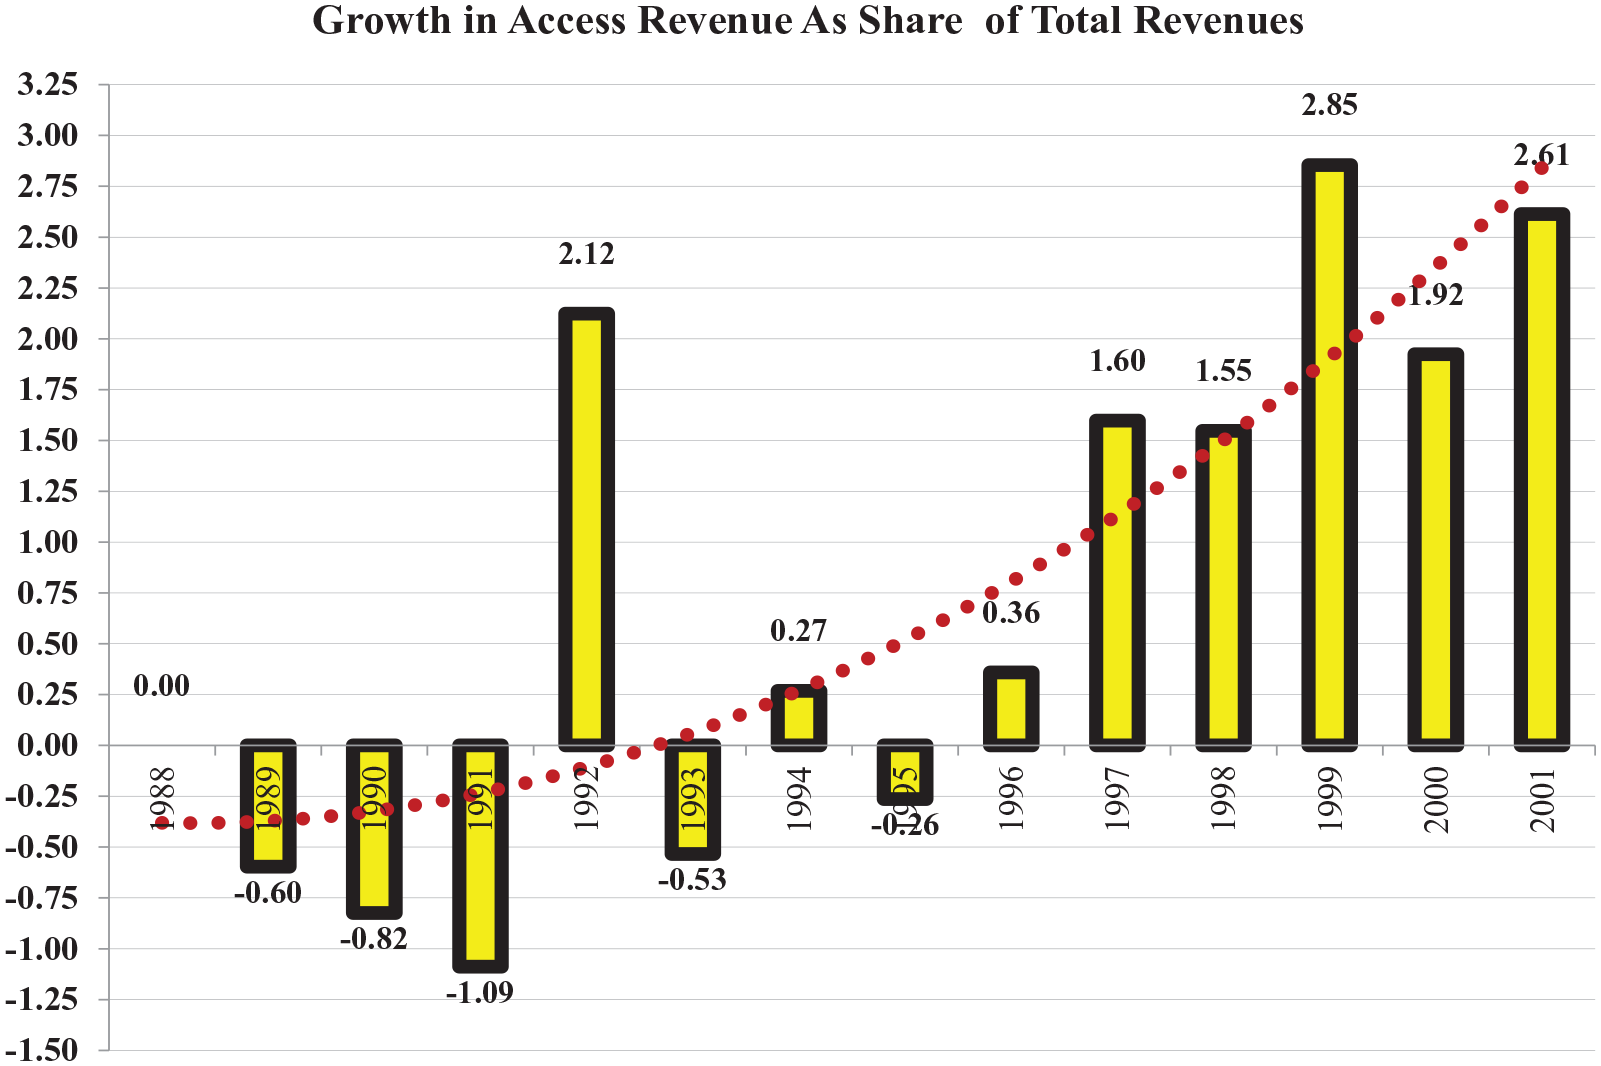
Access revenue growth patterns.
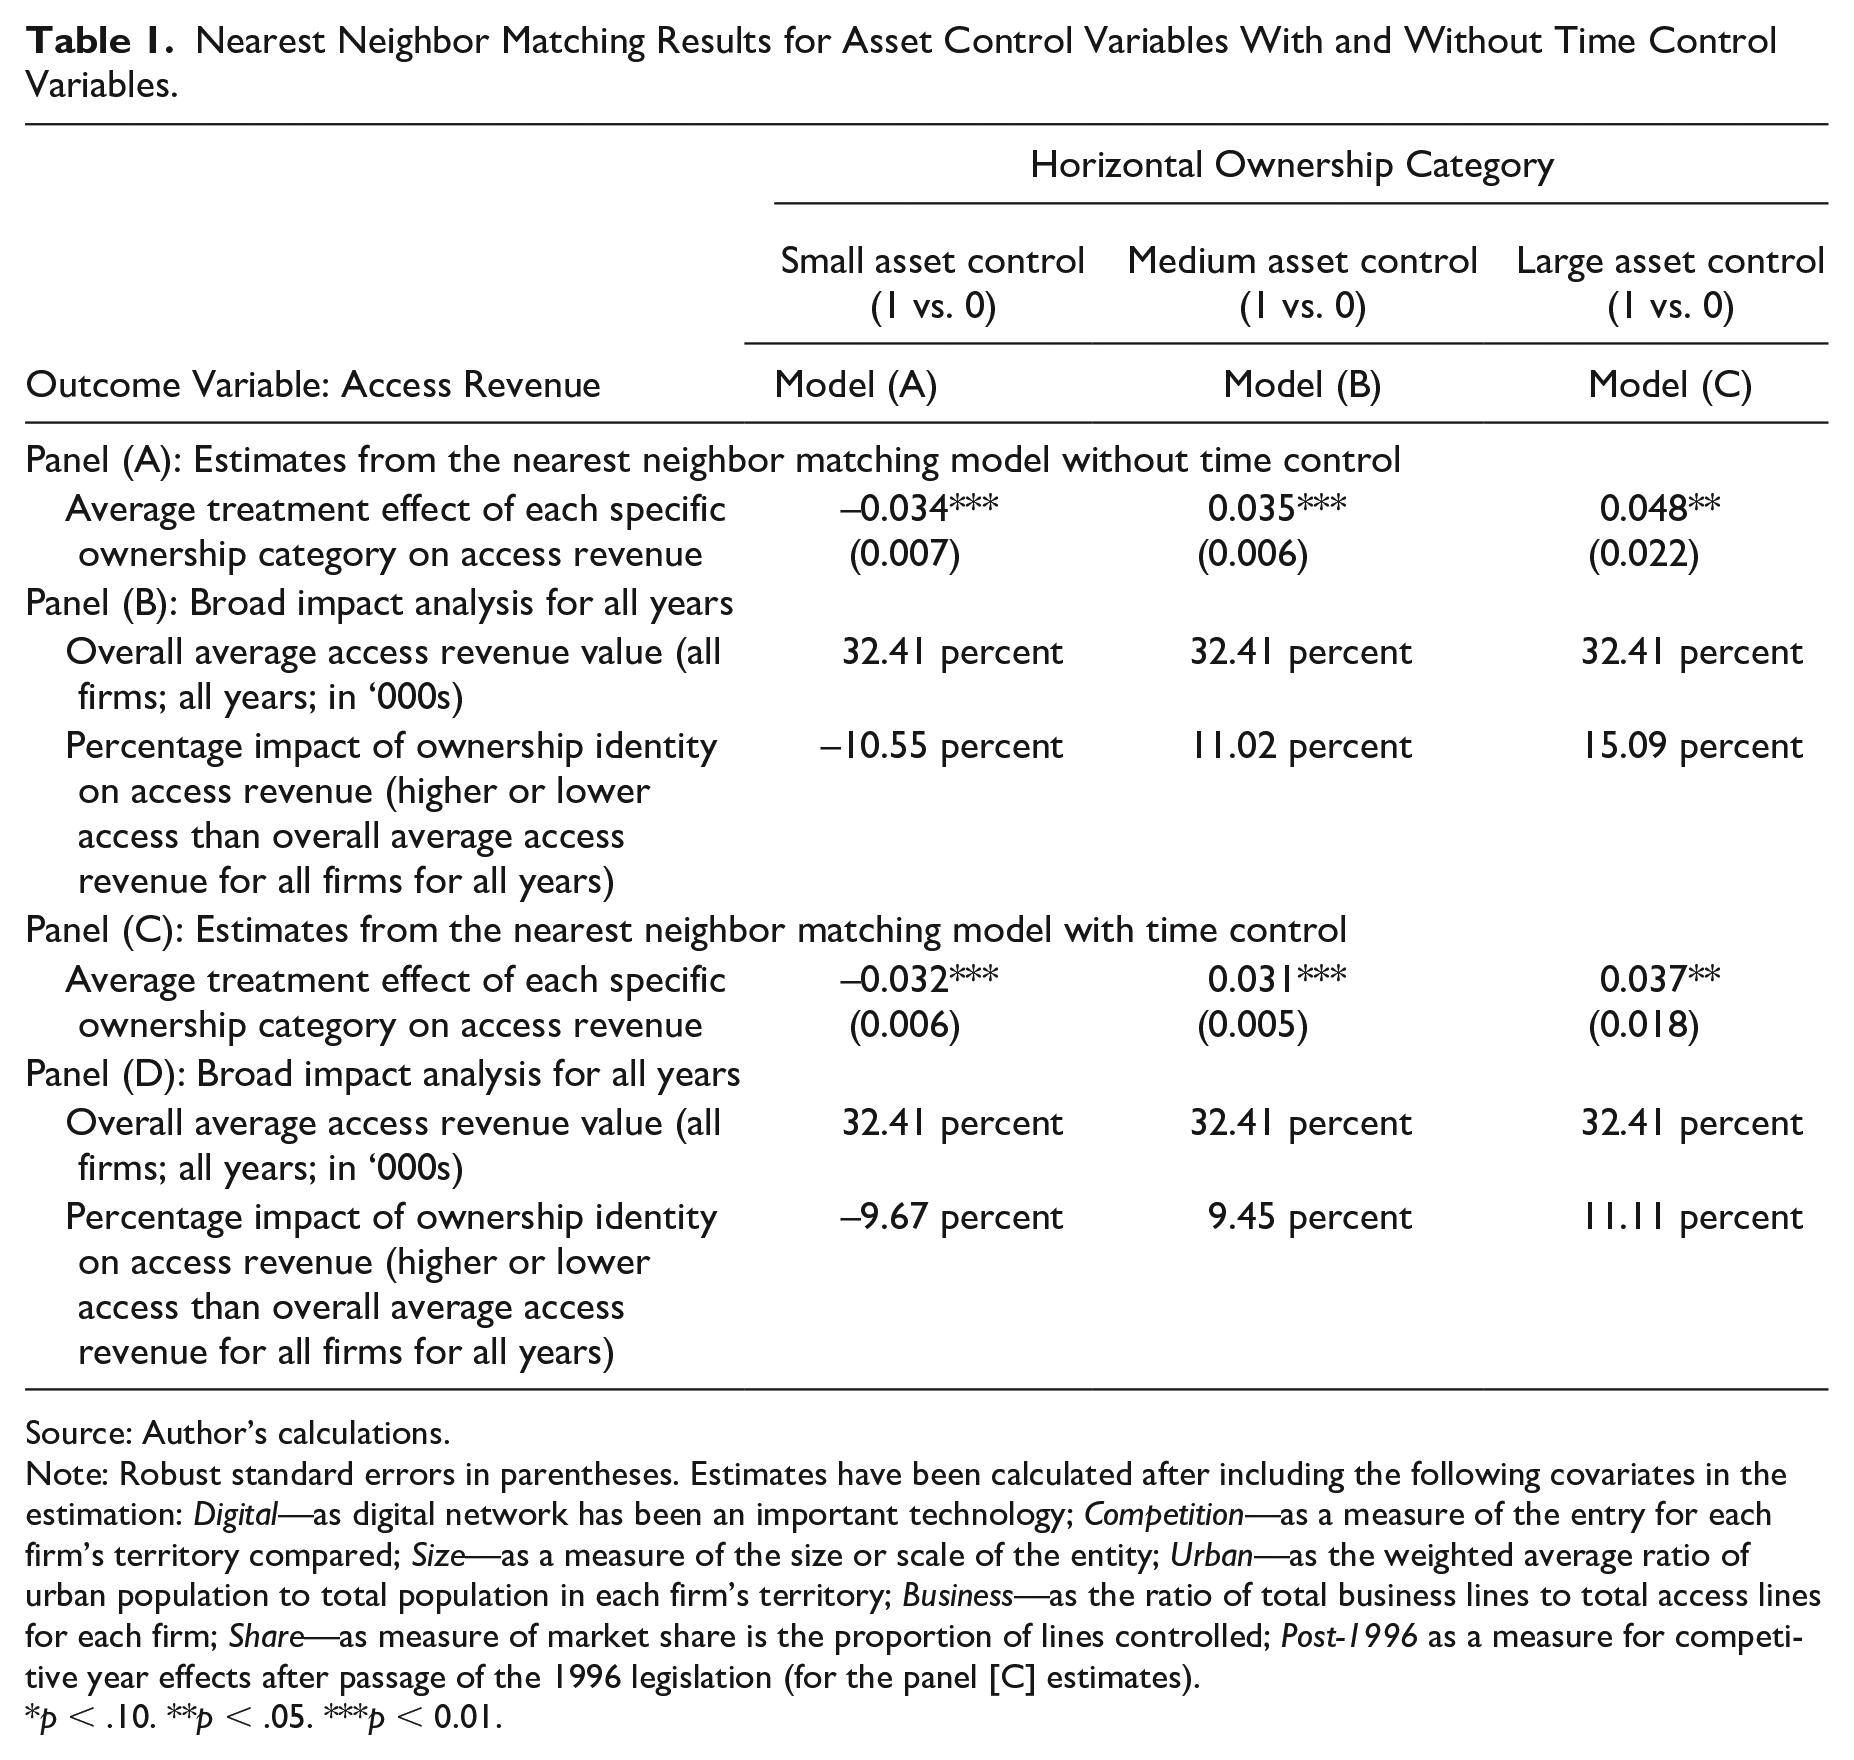
The first set of estimates evaluates the determinants of Access based on the nearest neighbor matching technique, both with and without a time control variable. The first set of results are given in panel (A) of Table 1. Model (A) relates to the impact of Small Asset Control on Access, and this variable is negative and significant. In other words, controlling for the various scope, scale, and density effects that would influence a firm’s access revenue share, ownership concentration has negatively affected some firms’ access revenue shares. Opposite results are, however, obtained for the Medium Asset Control (model [B]) and the Large Asset Control (model [C]) variables. These estimates are negative and significant.
Nearest Neighbor Matching Results for Asset Control Variables With and Without Time Control Variables.
Source: Author’s calculations.
Note: Robust standard errors in parentheses. Estimates have been calculated after including the following covariates in the estimation: Digital—as digital network has been an important technology; Competition—as a measure of the entry for each firm’s territory compared; Size—as a measure of the size or scale of the entity; Urban—as the weighted average ratio of urban population to total population in each firm’s territory; Business—as the ratio of total business lines to total access lines for each firm; Share—as measure of market share is the proportion of lines controlled; Post-1996 as a measure for competitive year effects after passage of the 1996 legislation (for the panel [C] estimates).
p < .10. **p < .05. ***p < 0.01.
The commercial environment changed after TA 1996, as competition was allowed and the Internet took off. Figure 1 shows the average annual growth in the access revenue share to have been positive every year after 1996. Commercial factors would independently generate access demand, affecting access revenue share. Thus, a Post-1996 variable controls for random external volume-drivers and residual time effects. The results stay stable, with estimates sizes only lowered somewhat, once time effects affecting access revenue shares are stripped-out after incorporating of the Post-1996 variable.
Based on details given on panels (B) and (D), the economic impact assessment implies that relatively small ownership concentration presence is associated with an almost 10 to 11 percent reduction in relative access revenue share. Conversely, the presence of medium or large levels of ownership concentration is associated with a 9 to 11 percent enhancement, for the medium category, and 11 to 15 percent enhancement in comparative share of access revenues for the large asset ownership category. Hence, controlling for various factors affecting access charge volumes, ownership concentration has caused firms to enhance access charges.
F. Controlling for Selection Effects
In foregoing analysis, average treatment effects have been calculated to evaluate differences in access revenue shares between ownership categories. Ownership category inclusion, for any unit, may have been influenced by other factors. There would be firm-specific differences between acquired and nonacquired firms, driving selection into an ownership treatment. Treatment selection methods account for heterogeneity effects and yield consistent estimates.
Treatment effects models, accounting for selection, evaluate ownership category impact on access revenue share. These models help evaluate the outcomes of natural experiments, where some firms experience a policy shift and others do not. First, a selection equation models the ownership category choice. Second, the impact of ownership category on the access revenue share has been evaluated in an outcome equation, controlling for volume factors affecting access revenue share. A standard approach is used. Separate models have been estimated for the Small Asset Control, Medium Asset Control, and Large Asset Control variables.
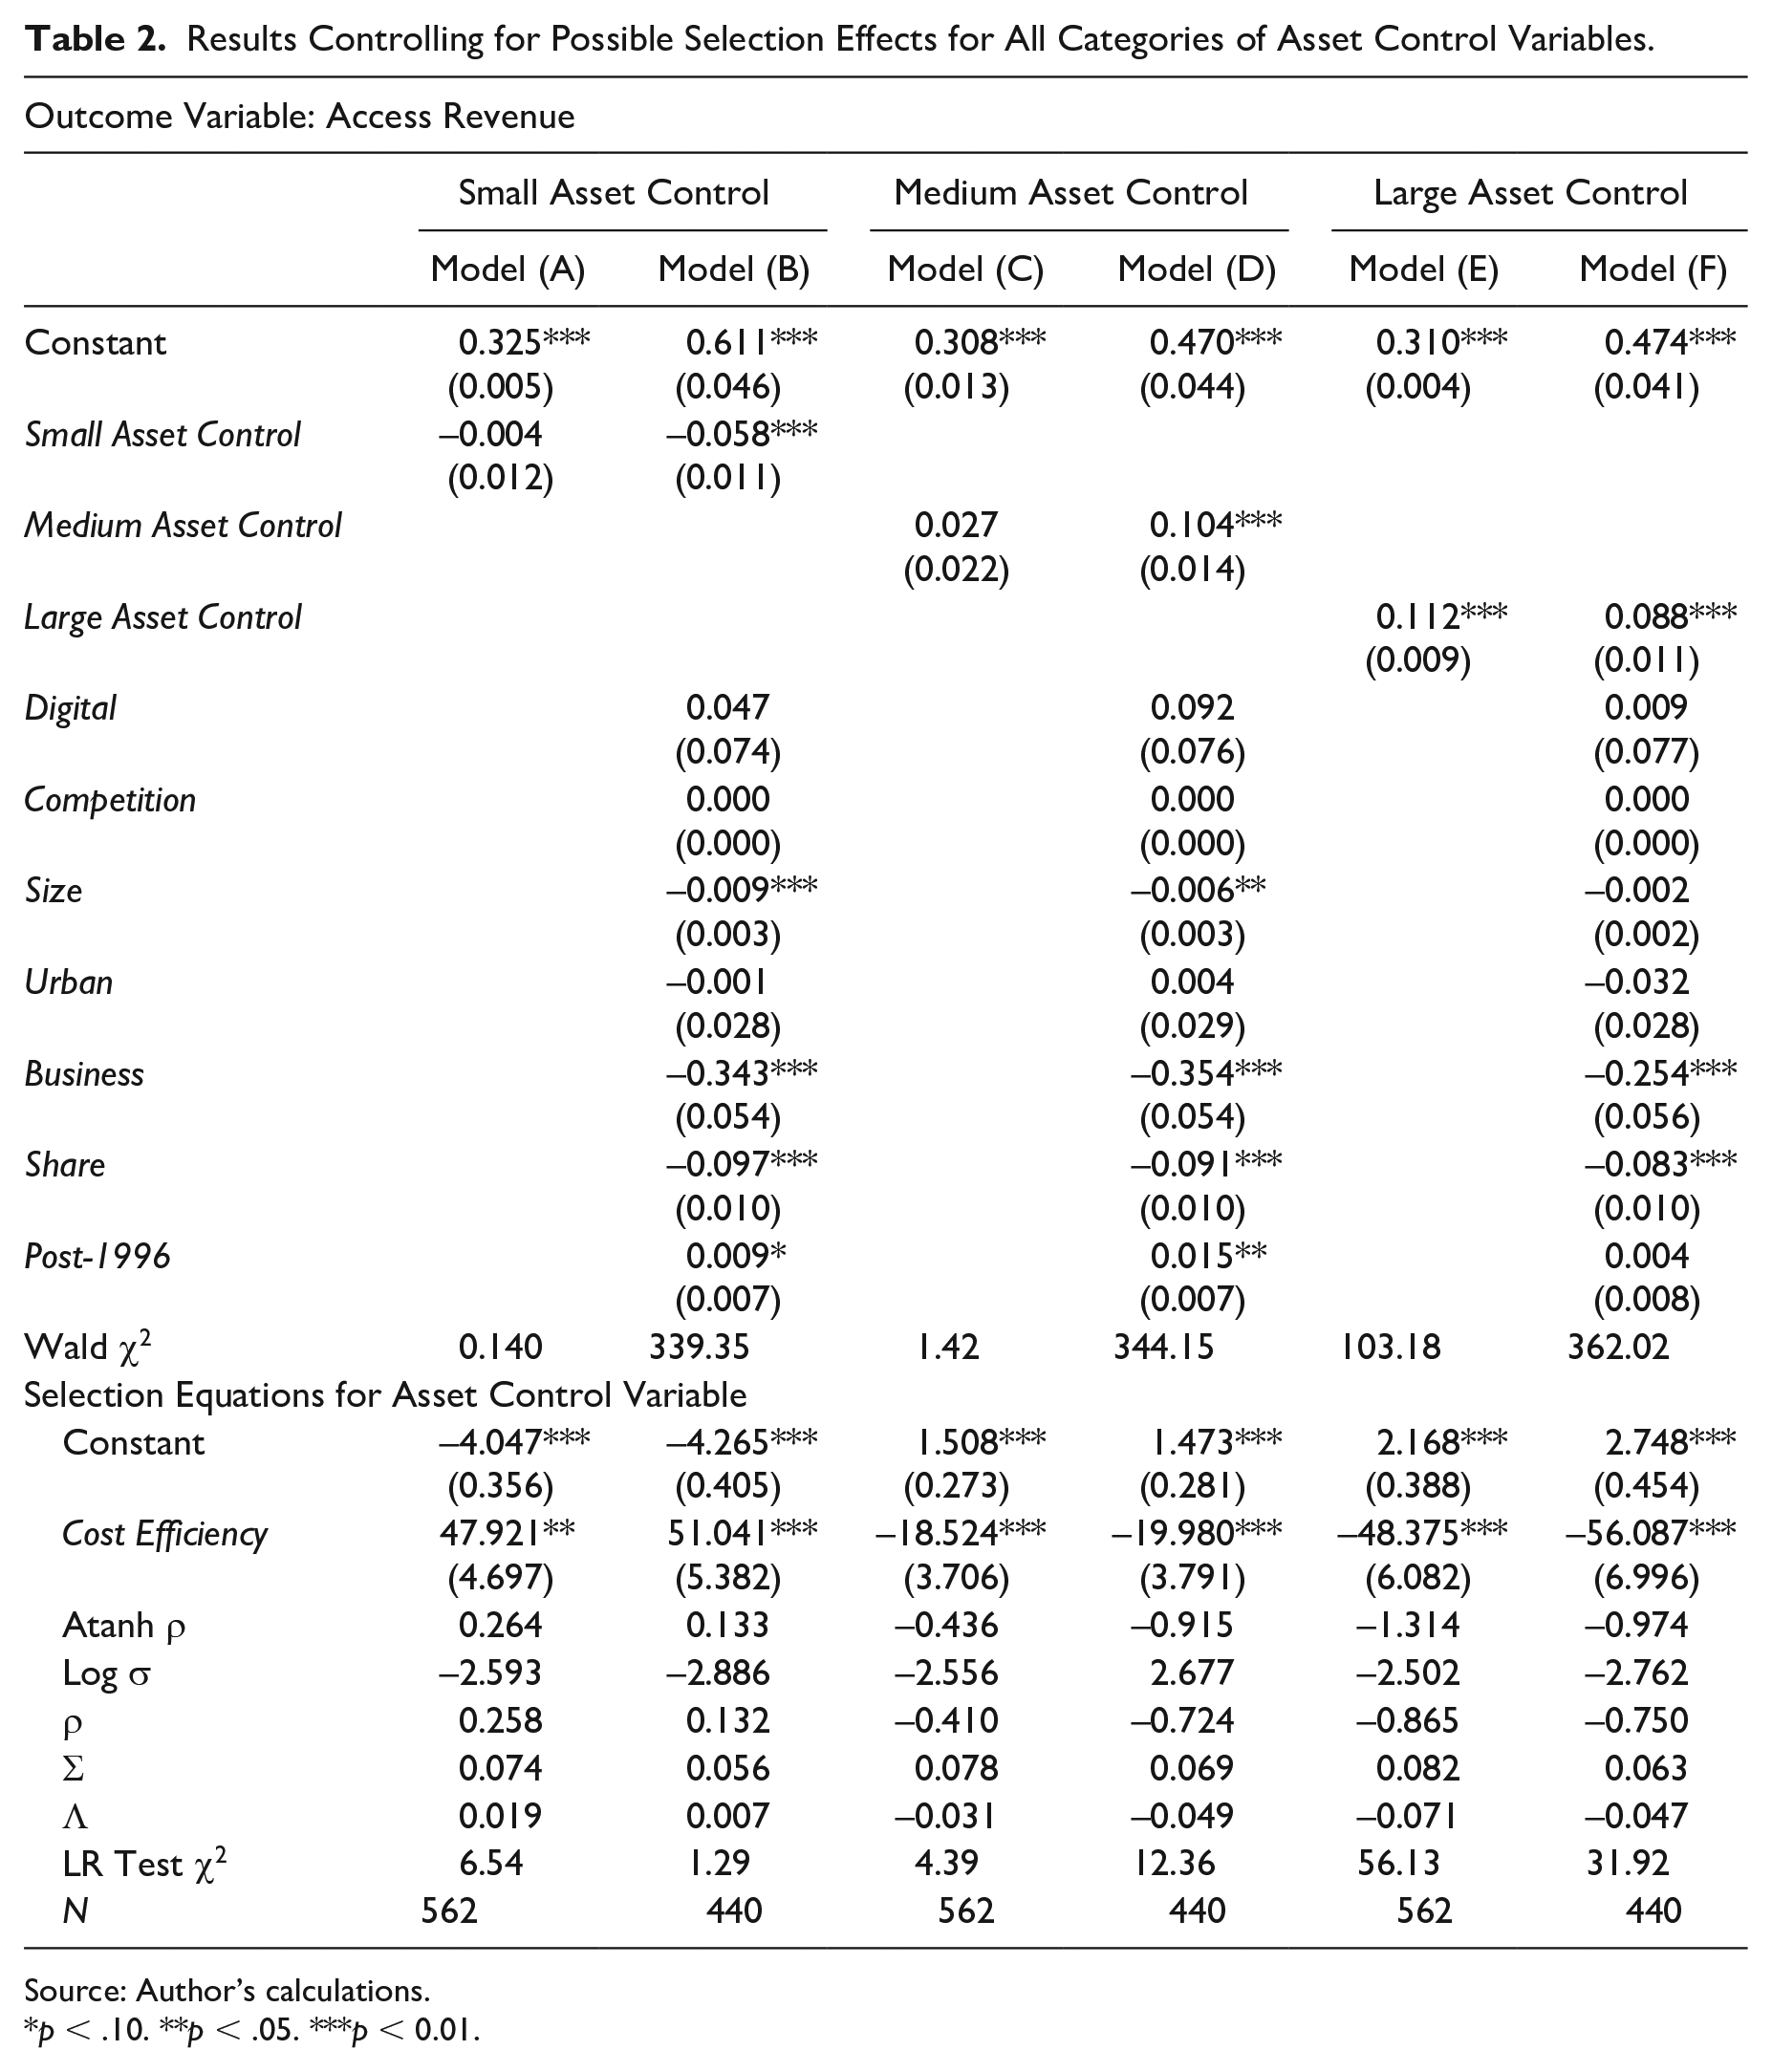
Many factors condition the likelihood of firms coming under a specific ownership category. Efficiency is a key reason; 46 thus, firms’ past performance drive acquisitions. A variable, calculated as the ratio of total plant operating costs to total assets (Efficiency), has been used as a factor influencing category inclusion. Estimates (in Table 2) support prior results of ownership concentration enhancing access revenue shares.
Results Controlling for Possible Selection Effects for All Categories of Asset Control Variables.
Source: Author’s calculations.
p < .10. **p < .05. ***p < 0.01.
Models (A) and (B) relate to the Small Asset Control Variable; model (A) has the ownership category variable included, and the estimate for that remains negative but nonsignificant. Once transaction volume-driving covariates [Digital, Competition, Size, Urban, Business, Share and Post-1996] are included, the negative Small Asset Control is significant (p < 0.01). In model (C), the Medium Asset Control variable is positive but not significant, while in model (D) it is negative and significant. In models (E) and (F), the Large Asset Control variable is both times positive and significant.
G. Panel Data Estimates
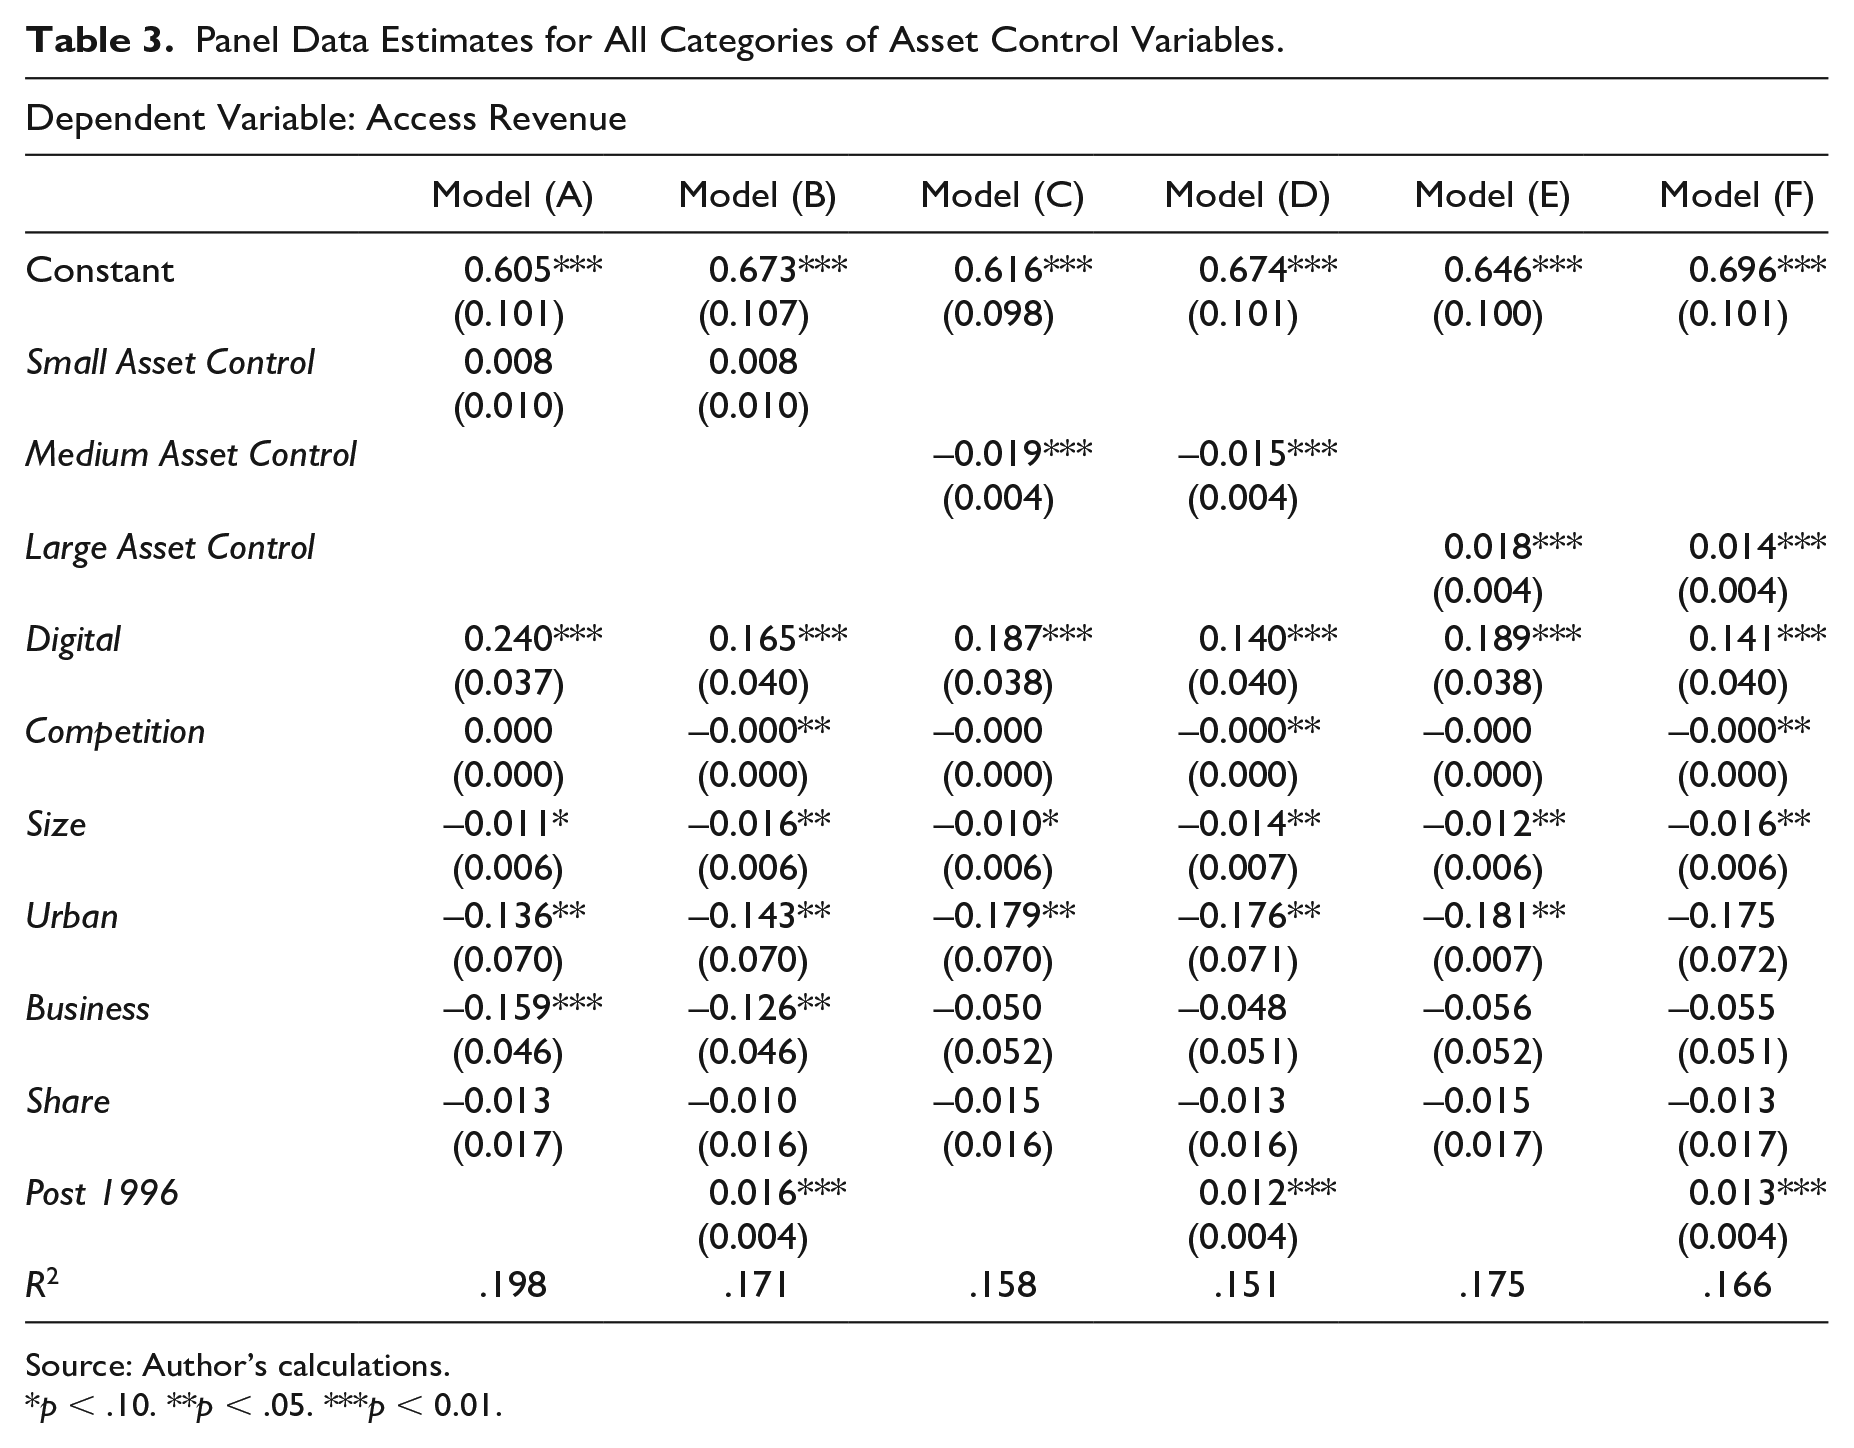
Table 3 reports results after correcting for cross-sectional heteroscedasticity and time-series auto-correlation effects. Models (A) and (B) are in respect of the Small Asset Control Variable, and model (A) has all the covariates bar the Post-1996 variable, while model (B) includes the Post-1996 variable to control for institutional effects plus associated market-opened volume effects. The Small Asset Control variables are positive but nonsignificant in these estimations, while similar results for the Medium Asset Control variable (models [C] and [D]) generate negative and significant results. Models (E) and (F) display positive and significant results for the Large Asset Control variable. These are consistent with previous findings for the ownership category. The conclusion stands that horizontal ownership concentration is associated with higher access charge levels.
Panel Data Estimates for All Categories of Asset Control Variables.
Source: Author’s calculations.
p < .10. **p < .05. ***p < 0.01.
V. Discussion
A. The Economic Issue
Networked industries display considerable supply-side economies of scope, scale, and density. Increasing returns effects are magnified. Demand-side externalities are driven by increasing returns to connectivity. These demand-side externalities affect all aspects of a digital economy. In the presence of supply-side and demand-side factors, Metcalfe’s law, positing that the value of a network is the squared product of the number of connection nodes, becomes effective. As more nodes are connected, network value rises exponentially.
A network industry cannot function without access and interconnectivity. Provided that digital bits are seamlessly transported through the network, consumer welfare benefits are vast. Seamlessness glitches arise when access price rise. High concentration has severe implications, via the access charges mechanism. Network tipping is an effect of concentration and high access charges. 47 Expecting better service, interconnection-seeking customers move to the largest network and cause tipping.
A dominant firm with the largest installed base has no incentive to allow interconnectivity to its network for firms with smaller networks. 48 Consumers could infer that the largest network provider would degrade interconnectivity with smaller networks and charge higher amounts to nonnetwork users, to provide an incentive for users to switch.
The unwillingness to provide good quality cheap access may increase switching motivations of network participants, engendering monopolization. With a captive installed base, a dominant firm may mark-up access charges massively over costs. Plus, lock-in situations, as an inefficient network becomes dominant because of many subscribers, may arise. Access charges are vital in a concentrated network industry, and high access charges have negative externalities and welfare impacts. 49
B. Impact Assessment
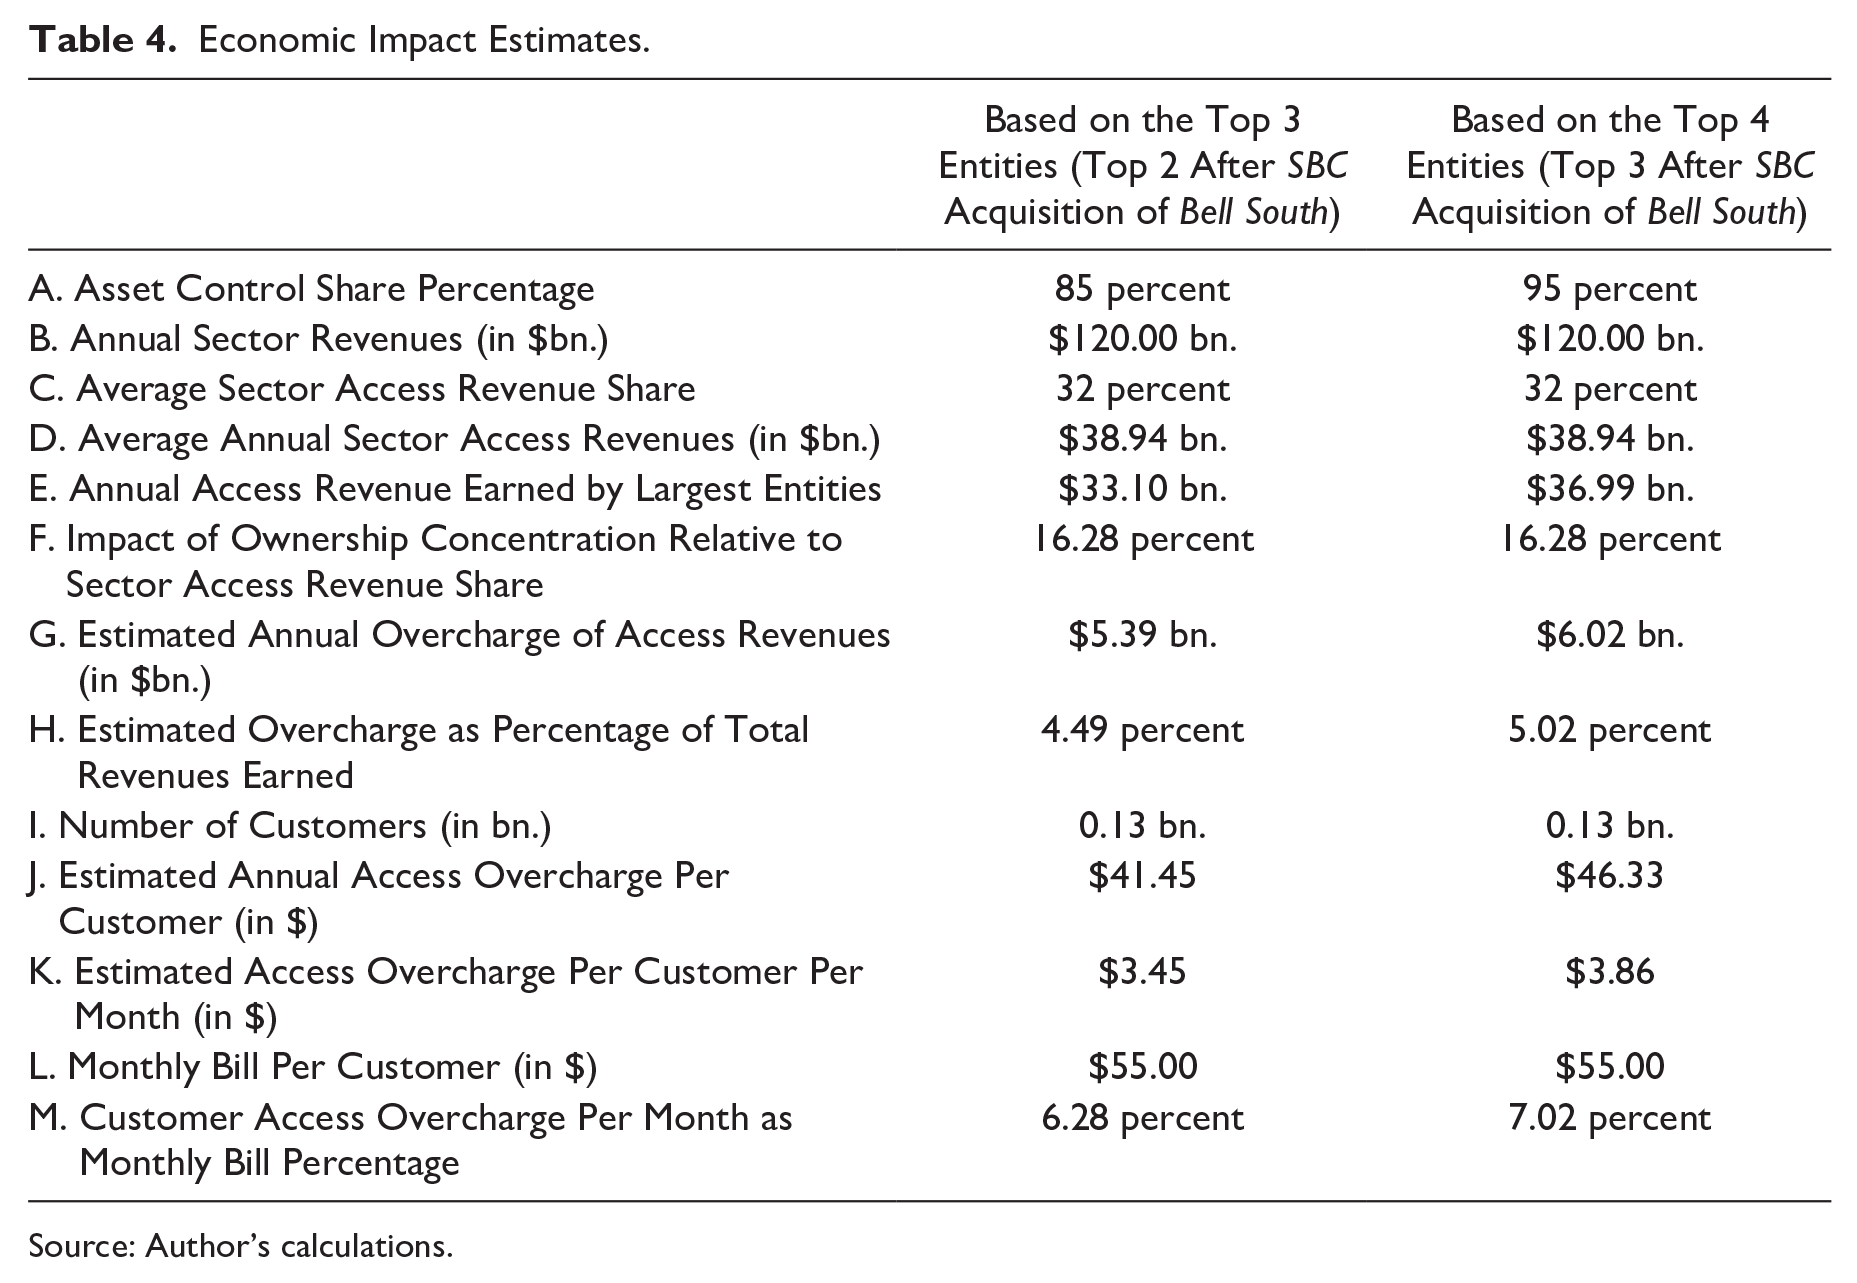
Tables 1 to 3 have listed the estimated coefficients for each category of horizontal ownership controller. The principal entities, SBC, Bell South and Verizon, have controlled 85 percent of the sector’s assets. Adding in U.S. West has meant that 95 percent of the sector’s assets have been controlled by four entities (down to three in the mid-2000s; see Table 4). Over time, the asset concentration ratio has risen over three-and-a-half times. Ownership has become highly concentrated, and estimates for the Large Asset Control variable have all been found to be positive and significant. The sector’s horizontal ownership concentration has caused access price rises. Economic consequences are discussed next.
Economic Impact Estimates.
Source: Author’s calculations.
The calculations, as presented in Table 4, are based on the estimated coefficients for the Large Asset Control variable, across the regressions, as this category has had maximum market power to exercise over others. Across Tables 1 to 3, the average value of the coefficient estimate comes out to be 0.053 (the values used to calculate the average are 0.018, 0.112, 0.048, 0.014, 0.088, and 0.037). The average value of the access revenue share variable (Access Revenue) has been 0.324, across firms and time, implying that a third of entities’ revenues have been driven by interconnectivity and network use by others. The impact of the estimate works out at a 16.3 percent access price enhancement due to horizontal ownership concentration.
Based on annual total sector revenues totaling $120 billion, on average, this has implied that about $39 billion worth of access revenues have been earned by entities annually. Of these, the three largest (top two after Bell South acquisition by SBC) entities have earned $33 billion (85 percent asset control eventually), and the over-charging of access revenues have resulted in annual fiscal windfalls of $5.4 billion (16.3/100*$33 billion). If the share of sector asset control of the top four (top three after Bell South acquisition by SBC), at 95 percent, was to be considered then annual overcharges would work out to $6 billion (16.3/100*$37 billion). The fiscal windfalls arising from higher access charges have accounted for between 4.5 and 5 percent of the total revenues for the entities evaluated.
On average, there have been 130 million networked customers, in the United States. The entities’ overcharging windfall, based on exploitation of their market power, works out annually to $41.50 per customer, or to $3.50 per customer per month. Customers then would have spent around $55 on average monthly telecommunications bills. Calculations based on the largest entities’ share of the sector asset control at 85 percent, suggest customers incurring a 6.2 percent ($3.50/$55*100) monthly bill enhancement simply due to access over-charging. If calculations were based on the largest entities’ share of the sector asset control, at 95 percent, the results suggest that customers would be incurring a 7 percent ($3.90/$55*100) enhanced monthly bill due to access over-charging.
C. Market Composition Implications
A consequence of rising access charges, consequent to acquisitions, and creating of horizontal ownership concentration, would be collapse of competitors’ business models. 50 Such competitors would have sought interconnection to ILECs’ networks, to exploit the gains from network externalities, and faced with high access charges would quit the market. Data 51 show interesting patterns of capital spending by incumbents and entrants from the period when TA 1996 went into effect and in 2003. These facts suggest major entrant fatalities and support the notion of incumbents’ use of an anticompetitive stance, with the access charges mechanism deployed as a likely weapon to behave in an anti-cooperative manner. Details are in Table 5.
Sector Incumbents’ and Entrants’ Patterns of Capital Spending.
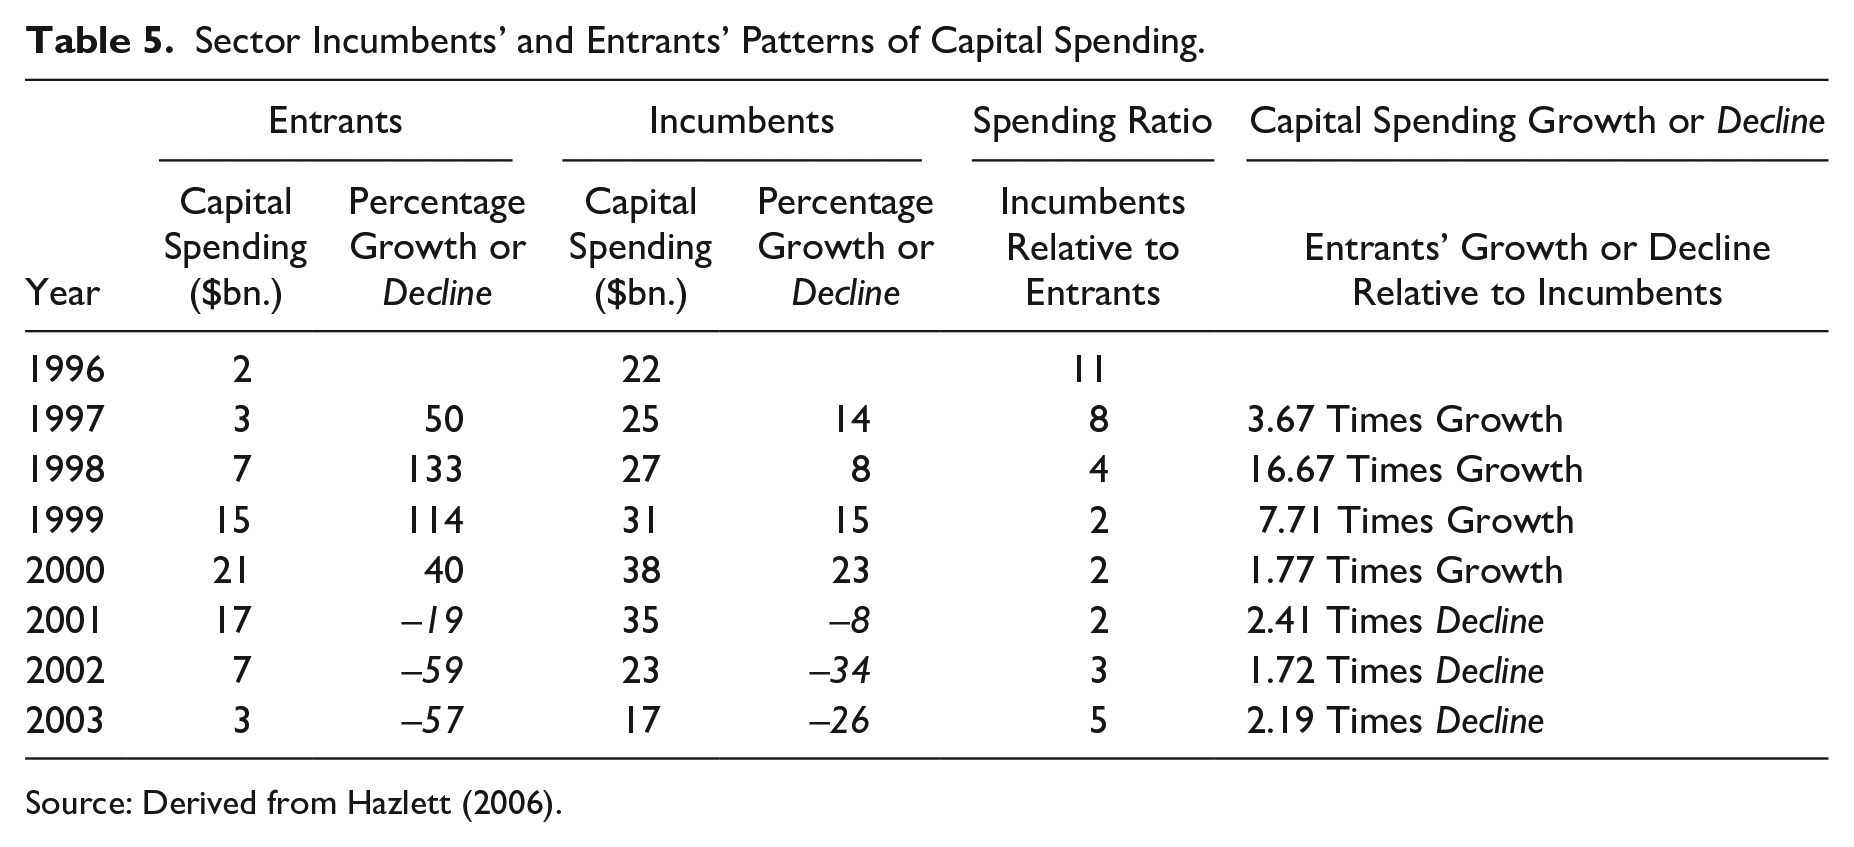
Source: Derived from Hazlett (2006).
From 1996, entrants’ capital expenditures increased from $2 billion, in 1996, to $21 billion in 2000. Then, they fell back to $3 billion by 2003. Growth was in triple digits from 1996–97 to 1999–00, by which time incumbents responded strongly. Incumbents’ capital expenditures were $22 billion in 1996, rising to $38 billion in 2000. The incumbents were larger. Yet, the entrants also money spent considerably and the ratio of incumbents’ to entrants’ spending, at eleven times in 1996, before competition set in, had dropped to about two times between 1999 to 2001. Thus, entrants could also become formidable facilities-based competitors. The last column shows that entrants’ capital spending growth was more than three times, over sixteen times and almost eight times’ incumbents’ spending growth for the years 1997, 1998, and 1999, when competition took off.
In the late 1990s and early 2000s, many ILEC mega-acquisition deals were cemented, leading to almost-complete control over sector assets by the incumbents. This structural feature, coupled with an access price rise actuated by the horizontal concentration process, led sector entrants to wither away. For the years 2001 to 2003, capital expenditures declined at 19, 59, and 57 percent annually. 52 Just as entrants had spent heavily, relative to the incumbents, they then also lost heavily. The last column shows that decline in entrants’ capital spending was 2.41 times, 1.72 times and 2.19 times’ incumbents’ spending decline in the 2001, 2002, and 2003 periods. In a decade, new competition in the sector was fully eliminated.
D. Summary
The analysis has examined relationships between horizontal ownership concentration and access revenues shares of communications market incumbents. The consents given for horizontal acquisitions, by regulatory and antitrust agencies, have permitted sector ownership to become significantly concentrated and an oligopoly to form. Controlling for volume effects, the analysis isolates patterns of increase, or decrease, in access charges relative to the average. Positive relationships between higher horizontal ownership concentration and average access charges are observed.
These findings support prior results that enhanced horizontal ownership concentration have caused higher prices, 53 and also support findings 54 that mobile communications sector market concentration have led to higher customer prices. Access and interconnection are the key drivers of a competitive digital sector. Dominant network providers have few incentives to give competitors cheap facilities access. Hence, applying an essential facilities doctrine (a classic regulation idea) involving regulation of wholesale access, supervision and periodic reviews of pricing decisions would be the relevant welfare-enhancing solution.
E. Postscript
While competition, in the territories of incumbent firms studied, was eliminated, complementary intermodal competition emerged across the sector as a whole. In the key intermodal wireless segment, retail prices fell 79 percent in the 1993 to 2002 period, from 57 cents per minute to 12 cents per minutes, and the minutes of wireless use rose from 19 billion to 619 billion minutes. Plus, cable television systems, providing alternative fixed-line intermodal functionalities, to permit the delivery of VOIP communications and digital services, had passed by 99 percent of American households (Hazlett, 2006). The erstwhile AT&T had bought McCaw Cellular, and then Cingular Wireless in 2004. In 2005, SBC acquired the erstwhile AT&T, and re-named itself AT&T. By 2018, AT&T bought Time-Warner, which included a large cable business. Hence, horizontal ownership concentration of digital distribution facilities, and vertical ownership concentration processes, of content creation pipelines, `via the many simultaneous acquisitions of wireless, cable and media content providers, have created oligopolies across all digital technology platforms. Thus, the welfare of hundreds of millions of United States communications sector customers and trading partners has been severely compromised.
VI. Concluding Thoughts
Assessments of horizontal ownership concentration impact on access charges for the United States telecommunications industry have yielded findings revealing a sordid saga of epic plunder, with the following being noted:
I. The sector’s horizontal ownership concentration process has caused average access revenue ratios to be over 16 percent higher than need be;
II. Over-charging of access fees have led to total annual fiscal windfalls between $5 and $6 billion;
III. These windfalls have ranged between $120 million and $150 million annually per firm;
IV. Such windfalls have ranged between 4.5 percent and 5 percent of firms’ revenues; and
V. Customers have incurred a 6 percent to 7 percent monthly overcharge on their monthly bills, due to higher access charges, in part due to horizontal ownership concentration.
A digital ecosystem need not be operated by a system-wide monopolist. An ecosystem is a digital relay in which one service provider passes the baton, or a packet of digital bits, to the next entity for transport to continue. Access functionalities make digital transactions ubiquitous. A principle of (1) anybody, (2) anywhere, (3) doing anything, (4) at any time, (5) on any service provider, is upheld due to system-wide interconnections.
Because of sensible pricing, numerous service providers mutually energize transaction flows and transport digital bits across the ecosystem. The dominance of an entity, and high access charges, upsets a delicate welfare balance by impeding bits transport. There are ultra-high ripple-through effects of such anticompetitive behavior in the economy. Access charges, and access revenues and its share, are regulated. Horizontal ownership concentrating acquisitions have been assessed by regulatory and antitrust authorities before being allowed. Yet, post-occurrence market power exploitation has been significant. U.S. telecommunications customers have been subject to licensed plunder, and the approvals of ownership change actions by institutional bodies have been complete blunders.
Web-based platforms organize almost all of our contemporary economic transactions. Multi-stakeholder connectivity is axiomatic; and Internet presence efficiently connects all stakeholders. Therefore, an always-connected Internet broadband functionality is a primary and basic need in all human societies. It is as vital as food and air. Education and health care, as contemporary examples, are two sectors that are very heavily dependent on broadband Internet.
In remoter places today, broadband connectivity is needed for undertaking basic tasks for sheer existence. It is supplied by local infrastructure providers that will have received the digital bits, for delivery, from upstream carriage providers. In the transport of bits, to the lowest local level for customer delivery, there would be many interconnection points involving the handover of bits at a price that is reflected in the access charges.
There is an argument that a connectivity infrastructure provider, faced with lumpy assets and heavy sunk costs, needs the rewards of high access prices as incentives for funding investments. In that case, the notion of whether connectivity infrastructures are public goods arise, also raising questions about public funding and ownership of connectivity infrastructures.
Allowing carriers to take advantage of a needs urgency, and charge high prices, leads to plunder via the overcharging of interconnection access rates. Such access overcharging, and cost pass-through, makes the “final thousand feet” connectivity pricing ultra-costly. This creates substantial inflationary pressures that unconscionably hurts all stakeholders, but particularly those weaker members of societies who have urgent needs for basic digital carriers’ portfolios of services.
Hence, the hardly controversial needs of the day are continuing political and policy reviews of access charging regimes, after extremely detailed and rigorous analyses, and hopefully effective checks on market consolidation processes, to stop the occurrence of concentration processes and the associated continuing plunder, plus also the reversal of past blunders, so as to enhance the welfare of humanity.
Footnotes
Author’s Note
Useful feedback was received from Bill Curran, Nishant Kathuria, Diana Moss, Mike Peng, Ingo Vogelsang, Keith Waehrer, and Dennis Weisman.
Declaration of Conflicting Interests
The author(s) declared no potential conflicts of interest with respect to the research, authorship, and/or publication of this article.
Funding
The author(s) received no financial support for the research, authorship, and/or publication of this article.
1.
Expecting efficiencies, the sector-controlling entities engaged in serial acquisitions of other horizontal controllers. See Calvin Goldman et al., The Role of Efficiencies in Telecommunications Merger Review,
2.
Catherine Tucker, Network Effects and Market Power: What Have We Learned in the Last Decade, 32
3.
See Alan Wertheimer, Exploitation (1996), and George Akerlof & Robert Shiller, Phishing For Phools: The Economics Of Manipulation And Deceit (2015), on the mechanisms used for exploitation.
4.
William J. Baumol & Greg Sidak, Toward Competition In Local Telephony (1994); David E. M. Sappington & Dennis L. Weisman, Designing Incentive Regulations For The Telecommunications Industry (1996).
5.
Facts from many earlier works are utilized. The analysis extends prior similar but not identical work. It is based on the same historical data used previously. See Sumit K. Majumdar, The Bigness Complex Redux: Horizontal Ownership Concentration and Efficiency Conundrums, 65
6.
As have goods and services markets; see the recent work by
7.
Einer A. Elhauge, Horizontal Shareholding, 129
8.
C. Scott Hemphill & Marcel Kahan, The Strategies of Anticompetitive Common Ownership, 129
9.
The key horizontal ownership defining mechanisms are: horizontal mergers and acquisitions; partial ownership of shares, for example of two or more firms’ joint investments in a rival competing in the same market, thus creating a conduit to influence and soften competition through control of operational decision making, a phenomenon called cross ownership; ownership shares in multiple rivals, by institutional investors, which dampens incentives for firms to compete, this being the phenomenon of common ownership; and joint ventures, such as in R&D activities as collaborations among rivals to develop new products through joint or cross-licensing of patented technology, which can result in anti-competitive outcomes if there are only a few rivals. Einer A. Elhauge et al., Confronting Horizontal Ownership Concentration, 66
10.
Along with M&As, see
11.
M&A deals have featured in ownership and control markets for decades; annual deals’ values of $2 trillion account for around ten percent of United States GDP; see Carl Shapiro, Protecting Competition in the American Economy: Merger Control, Tech Titans, Labor Markets, 33
12.
Diana L. Moss, Merger Policy and Rising Concentration: An Active Agenda for Antitrust Enforcement, 33
13.
See Martin C. Schmalz, Common-Ownership Concentration and Corporate Conduct, 10
14.
Eric A. Posner et al., A Proposal to Limit the Anticompetitive Power of Institutional Investors, 81
15.
Dennis Carlton, Why Barriers to Entry Are Barriers to Understanding, 94
16.
Eric Posner, Policy Implications of the Common Ownership Debate, 66
17.
Jeffrey MacKie-Mason & Hal R. Varian, Economic FAQs About the Internet, 8 J.
18.
Mark Armstrong, Network Interconnection in Telecommunications, 108
19.
Mark Armstrong et al., The Access Pricing Problem: A Synthesis, 44
21.
Ingo Vogelsang, Price Regulation of Access to Telecommunications Networks,
22.
Thomas Hazlett, Rivalrous Telecommunications Networks With and Without Mandatory Sharing, 58
23.
Mark Armstrong, The Theory of Access Pricing and Interconnection, IN
24.
Vogelsang, supra note 21.
25.
Armstrong et al., supra note 19, Armstrong, supra note 23, Vogelsang, supra note 21, Mark Armstrong & David E. M. Sappington, Regulation, Competition, and Liberalization,
26.
John Kirkwood, Market Power and Antitrust Enforcement, 98
27.
Federal Communications Commission,
28.
Majumdar, supra note 5 (2020); Majumdar et al., supra note 5.
29.
See Majumdar, supra note 5 (2020), at 635, for full details.
30.
See Majumdar, supra note 5 (2020), at 635 and 636, for these details.
31.
See Majumdar, supra note 5 (2020), at 635 and 636, for details.
32.
This was also noted by Eli Noam, Deregulation and Market Concentration: An Analysis of Post-1996 Consolidations, 58
33.
See earlier works Majumdar, supra note 5 and Majumdar et al., supra note 5.
34.
See Majumdar et al., supra note 5, at 129 to 131, and Majumdar, supra note 5 (2020), at 648 to 650.
35.
See Majumdar, supra note 5.
36.
See Majumdar, supra note 5 (2020), at 635 to 637.
37.
See Majumdar et al., supra note 5. Other sources are the Federal-State Joint Board Monitoring Reports, FCC Competition in the Telecommunications Industry reports, NRRI reports, and US Census Bureau reports.
38.
Two-way access concerns have existed in telecommunications environments for generations. They became important after the 1984 divestiture of United States ILECs and are even more important after the passage of the Telecommunications Act of 1996.
39.
See Glen A. Woroch, Local Network Competition, IN
40.
Jacques Crèmer et al., Connectivity in the Commercial Internet, 48
41.
Hazlett, supra note 22.
42.
James J. Heckman, Micro Data, Heterogeneity and the Evaluation of Public Policy: Nobel Lecture, 109
43.
James J. Heckman & Edward Vytlacil, Structural Equations, Treatment Effects, and Econometric Policy Evaluation, 73
44.
Dale N. Hatfield et al., Emerging Network Technologies, IN
45.
Jeffrey H. Rohlfs, Bandwagon Effects in Network Industries, IN
46.
Joseph Farrell & Carl Shapiro, Scale Economies and Synergies in Horizontal Merger Analysis, 68
47.
Crèmer et al., supra note 40.
48.
Michael L. Katz & Carl Shapiro, System Competition and Network Effects, 8
49.
Armstrong, supra note 23.
50.
Gene Kimmelman et al., The Failure of Competition Under the 1996 Telecommunications Act, 58
51.
Hazlett, supra note 22.
52.
Id.
53.
See Schmalz, supra note 14.
54.
See Genakos et al., supra note 14.