
Abstract
This study investigated whether a novel index of stress hyperglycemia might have a better prognostic value compared to admission glycemia alone in patients with ST-segment elevation myocardial infarction (STEMI) undergoing percutaneous coronary intervention (PCI). The acute-to-chronic glycemic ratio was expressed as admission blood glucose (ABG) devided by the estimated average glucose (eAG), and eAG was derived from the glycated hemoglobin (HbA1c). A total of 1300 consecutive patients with STEMI treated with PCI were included. Baseline data and outcomes were analyzed. The study end point was a composite of in-hospital all-cause death, cardiogenic shock, and acute pulmonary edema. Accuracy was defined with area under the curve (AUC) by a receiver–operating characteristic (ROC) curve analysis. After multivariate adjustment, both ABG/eAG and ABG were closely associated with an increased risk of the composite end point in nondiabetic patients. However, only ABG/eAG (odds ratio = 2.45, 95% confidence interval: 1.24-4.82, P = .010), instead of ABG, was associated with the outcomes in diabetic patients. Compared to ABG, ABG/eAG had an equivalent predictive value in nondiabetic patients but a superior discriminatory ability in diabetic patients (AUC improved from 0.52-0.63, P < .001). Taken together, ABG/eAG provides more significant in-hospital prognostic information than ABG in diabetic patients with STEMI after PCI.
Keywords
Background
Abnormal glucose metabolism remains a leading contributor to high rates of mortality and morbidity in cardiovascular (CV) diseases despite the crucial advances in medical therapy have been made worldwide over the last decades. 1 Stress hyperglycemia in hospitalized patients with acute myocardial infarction (AMI) is particularly associated with an increased risk of subsequent adverse events even after successful revascularization with percutaneous coronary intervention (PCI). 1 –4 Therefore, the early recognition and appropriate treatment of stress hyperglycemia may have clinical implications in the management of AMI.
Previous studies regarded admission blood glucose (ABG) as the indicator of stress hyperglycemia 5 –8 ; however, ABG values are subject to both acute stress condition and chronic glycemic levels. This may limit the utility of ABG in identifying the true acute glycemic rise. Recently, a novel index of stress hyperglycemia (acute-to-chronic glycemic ratio or stress hyperglycemia ratio) was proposed. 9 This ratio was defined as ABG divided by the estimated average glucose (eAG); eAG was derived from the glycated hemoglobin (HbA1c). 10 The performance of ABG/eAG was developed and validated in acutely ill patients, showing a better prognostic value than the absolute hyperglycemia. 9,11 Furthermore, the ABG/eAG ratio has been proved to be a powerful predictor of prognosis in “all-comer” patients treated with PCI, and particularly in diabetic patients hospitalized with AMI. 12 –14 However, data on the discrimination of ABG/eAG in patients with ST-segment elevation myocardial infarction (STEMI) undergoing PCI are scarce.
In the present study, we investigated whether the ABG/eAG ratio could predict in-hospital adverse events following STEMI after PCI and whether the prognostic power of this ratio might be better than the ABG alone.
Methods
Study Population
A total of 1426 consecutive patients with STEMI undergoing PCI were admitted to the Cardiac Care Unit at the cardiovascular center of Beijing Friendship Hospital between January 2013 and June 2018. Data on ABG and HbA1c were not available in 126 (8.8%) patients. Final analysis was therefore performed on 1300 patients.
All patients were treated with optimal medical therapies according to current guidelines and recommendations, including aspirin, clopidogrel or ticagrelor, low-molecular-weight heparin, statin, angiotensin-converting enzyme inhibitor or angiotensin receptor blocker, and β-blocker. 1 These drugs were routinely prescribed and were continued after discharge unless there were contraindications. Primary PCI was performed in patients whose ischemic symptoms were less than 12-hour duration or in patients with cardiogenic shock or acute heart failure irrespective of time delay from symptom onset. If patients failed to receive primary PCI on arrival, delayed PCI was subsequently initiated during hospitalization. Interventional procedures were performed at the operator’s discretion using standard techniques, 2 including percutaneous transluminal coronary angioplasty, the second-generation drug-eluting stent implantation, aspiration thrombectomy, and/or mechanical circulatory support with intra-aortic balloon pump (IABP). The in-hospital adverse events were checked using medical records by a team of independent research physicians not involved in the treatment.
In the present study, diabetes (DM) was defined as having a history of DM or having newly diagnosed DM with HbA1c ≥6.5%, fasting blood glucose ≥7.0 mmol/L, or 2-hour plasma glucose ≥11.1 mmol/L in an oral glucose tolerance test. 15 Dyslipidemia was defined as low-density lipoprotein cholesterol concentrations ≥3.4 mmol/L (130 mg/dL), high density lipoprotein cholesterol concentrations <1.0 mmol/L (40 mg/dL), triglyceride concentrations ≥1.7 mmol/L (150 mg/dL), or patients who were taking lipid-lowering medication. 16 Chronic kidney disease was defined as renal structural abnormality or progressive functional loss, estimated glomerular filtration rate (eGFR) <60 mL/(min × 1.73 m2), lasting for >3 months according to the Kidney Disease Improving Global Outcomes criteria. 17
This study was approved by the Ethics Committee of Beijing Friendship Hospital and was conducted in accordance with the Declaration of Helsinki. Written informed consent was obtained from all participants.
Data Collection
The patient data were retrieved from Cardiovascular Center Beijing Friendship Hospital Database (CBD BANK). Information on demographic, clinical, laboratory, and angiographic characteristics at baseline were obtained from in-person interviews and medical records. Blood glucose was measured at hospital admission (ABG) using standardized biochemical assay. The HbA1c levels were routinely tested with a high-performance liquid chromatography analyzer in hospitalized patients with STEMI, regardless of whether they had preexisting DM. As reported, 6 the eAG was derived from HbA1c and was calculated using the following equation: eAG (mmol/L) = (1.59 × HbA1c [%] − 2.59). The acute-to-chronic glycemic ratio was calculated using the formula “ABG/eAG,” where the ABG was divided by eAG, indicating a relative glycemic increase correcting for recent chronic average glycemia. 9 The eGFR was calculated using the Chronic Kidney Disease-Epidemiology Creatinine equation. N-terminal B-type natriuretic peptide and cardiac troponin I (TnI) were monitored dynamically, and peak values were recorded. Left ventricular ejection fraction (LVEF) was measured using the biplane Simpson method with echocardiography. Coronary angiograms were analyzed by 2 experts, and the Gensini score system was used to evaluate the severity of coronary artery lesion. 18 Discrepancies were resolved by consensus.
Outcomes and Definitions
The study end point was the combination of the most clinically relevant hemodynamic consequences after STEMI, including in-hospital mortality, cardiogenic shock, and acute pulmonary edema. According to the 2017 scientific statement from the American Heart Association, 19 cardiogenic shock was defined as prolonged hypotension (systolic blood pressure ≤90 mm Hg), ineffective cardiac output, and decreased tissue perfusion in both clinical and biochemical manifestations with evidence of severe left ventricular dysfunction requiring IABP and/or inotropic agents. Acute pulmonary edema was defined as excessive fluid accumulation in the lung, resulting in severe respiratory distress and orthopnea with rales over the lung fields and arterial oxygen saturation <90% on room air before treatment with oxygen.
Statistical Analysis
Continuous variables were expressed as mean ± standard deviation (SD) or median with interquartile range. Categorical variables were described as a number (n) with percentage (%). Differences were analyzed using independent sample t test or Mann-Whitney U test for continuous variables and Pearson χ2 or Fisher exact test for categorical variables. The logistic regression analysis was performed to identify the association between glucometrics and the risk of composite end point. To ascertain the independent contribution to the outcomes, the prognostic effect of ABG or ABG/eAG was adjusted for the major confounders in the multivariate model, including age, gender, peak TnI, timing of PCI (primary or delayed), and the Gensini score. Unadjusted and adjusted odds ratio (OR) with 95% confidence interval (CI) were calculated. The OR was presented as per 1 SD increase in ABG or ABG/eAG.
The predictive value of the glucometrics was assessed using the receiver–operating characteristics (ROC) curve analysis. The cutoff value of ABG/eAG for the composite end point prediction in the entire population was identified. Discrimination was defined with areas under the curve (AUC), and the values were interpreted using the following standard: negligible (≤0.55), small (0.56-0.63), moderate (0.64-0.70), and strong (≥0.71). 20 Differences in AUC were appraised by DeLong test using MedCalc V.11.4 (MedCalc Inc, Ostend, Belgium). 21 All tests were 2-tailed, and a P < .05 was considered significant. Unless otherwise stated, most analyses were performed using the statistical package SPSS V.20.0 (SPSS Inc, Chicago, Illinois).
Results
Baseline Characteristics and Clinical Outcomes Between Groups
Patients were divided into non-DM and DM groups. Each group was further divided according to the median level of ABG/eAG (1.13 for non-DM and 1.24 for DM, respectively). The flowchart of the study is shown in Figure 1.
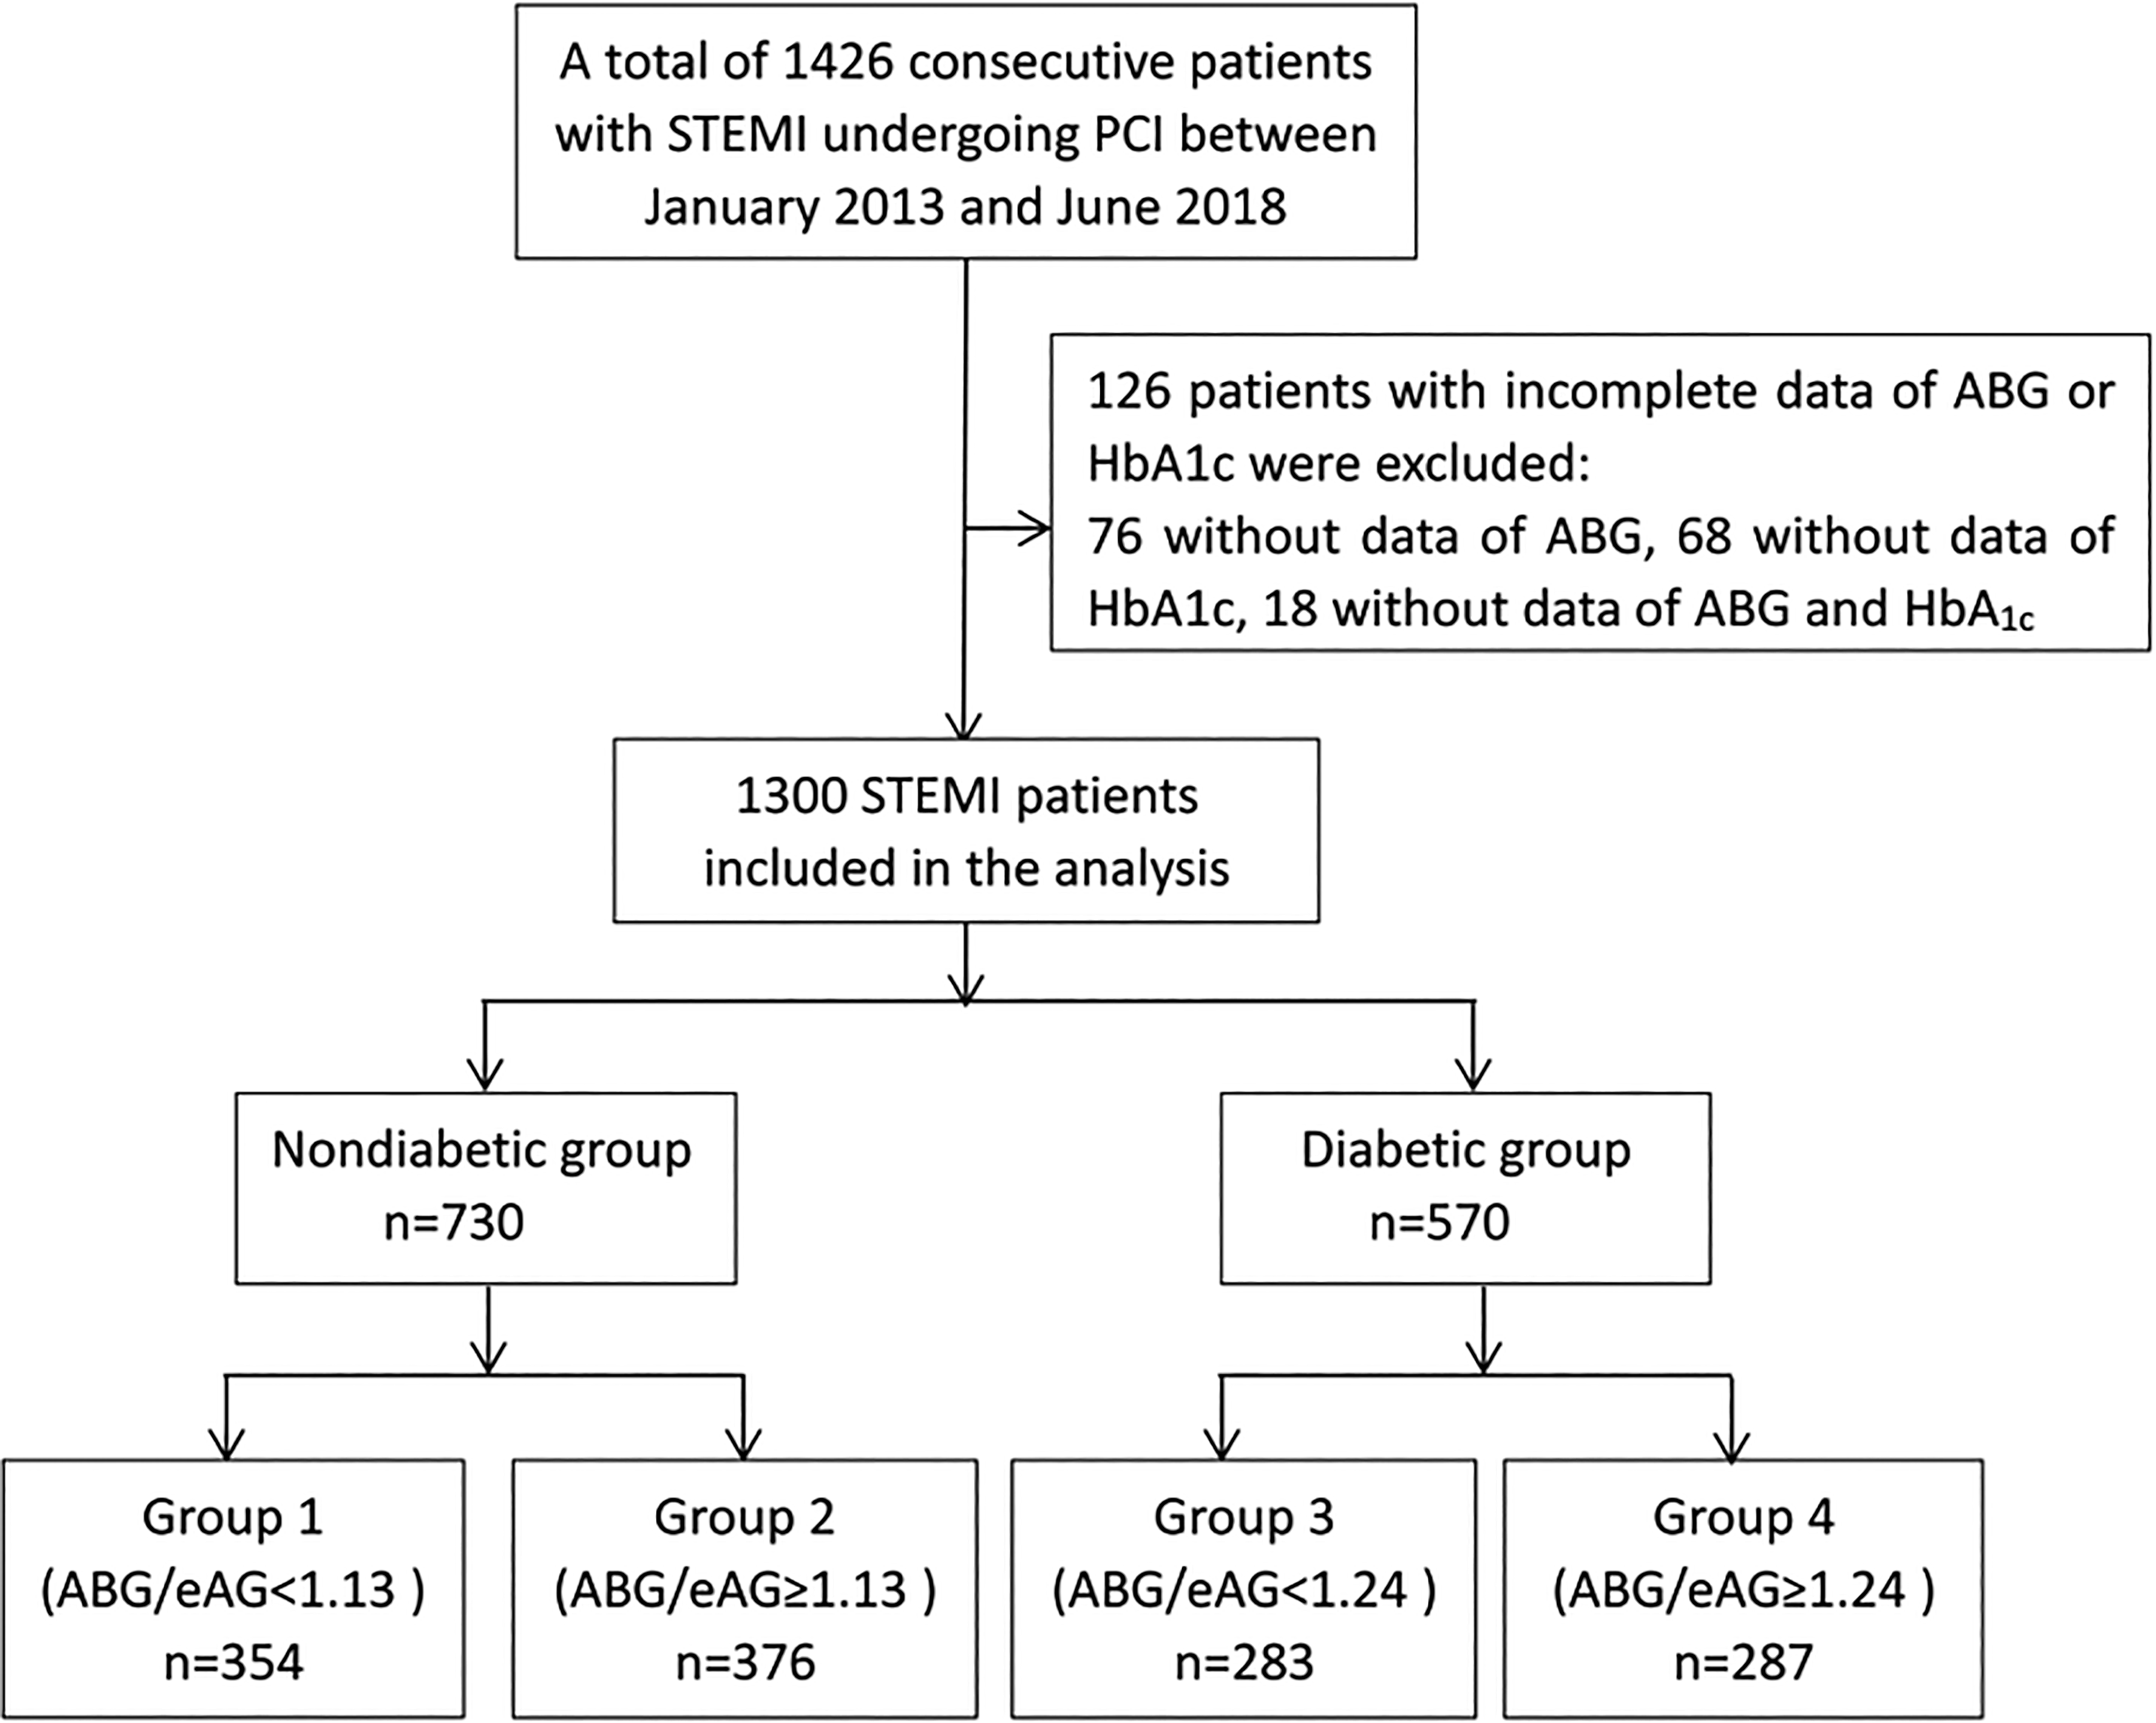
Flowchart of the study. ABG indicates admission blood glucose; eAG, estimated average glucose; HbA1c, glycated hemoglobin; PCI, percutaneous coronary intervention; STEMI, ST-segment elevation myocardial infarction.
As shown in Table 1, non-DM and DM patients with higher median ABG/eAG tended to have higher peak TnI values, more chance to receive primary PCI, and more severe coronary artery lesion as assessed by the Gensini score. Non-DM patients with higher median ABG/eAG also had higher NT-pro BNP, lower low-density lipoprotein cholestorel and more chance to receive thrombus aspiration. However, there were no significant differences in age, gender, CV risk profile, in-hospital medication, culprit lesion, number of stents, and usage of IABP between subgroups within the non-DM or DM groups. As for in-hospital outcomes, non-DM patients with higher median ABG/eAG (≥1.13) had a higher incidence of all-cause death, cardiogenic shock, acute pulmonary edema, and combined adverse events (9.5% vs 4.5%, P = .008). Similarly, the rate of each isolated event and the composite end point (16.7% vs 9.2%, P = .007) were all significantly higher in DM patients with an ABG/eAG above the median level (≥1.24).
Baseline Characteristics and Clinical Outcomes.a
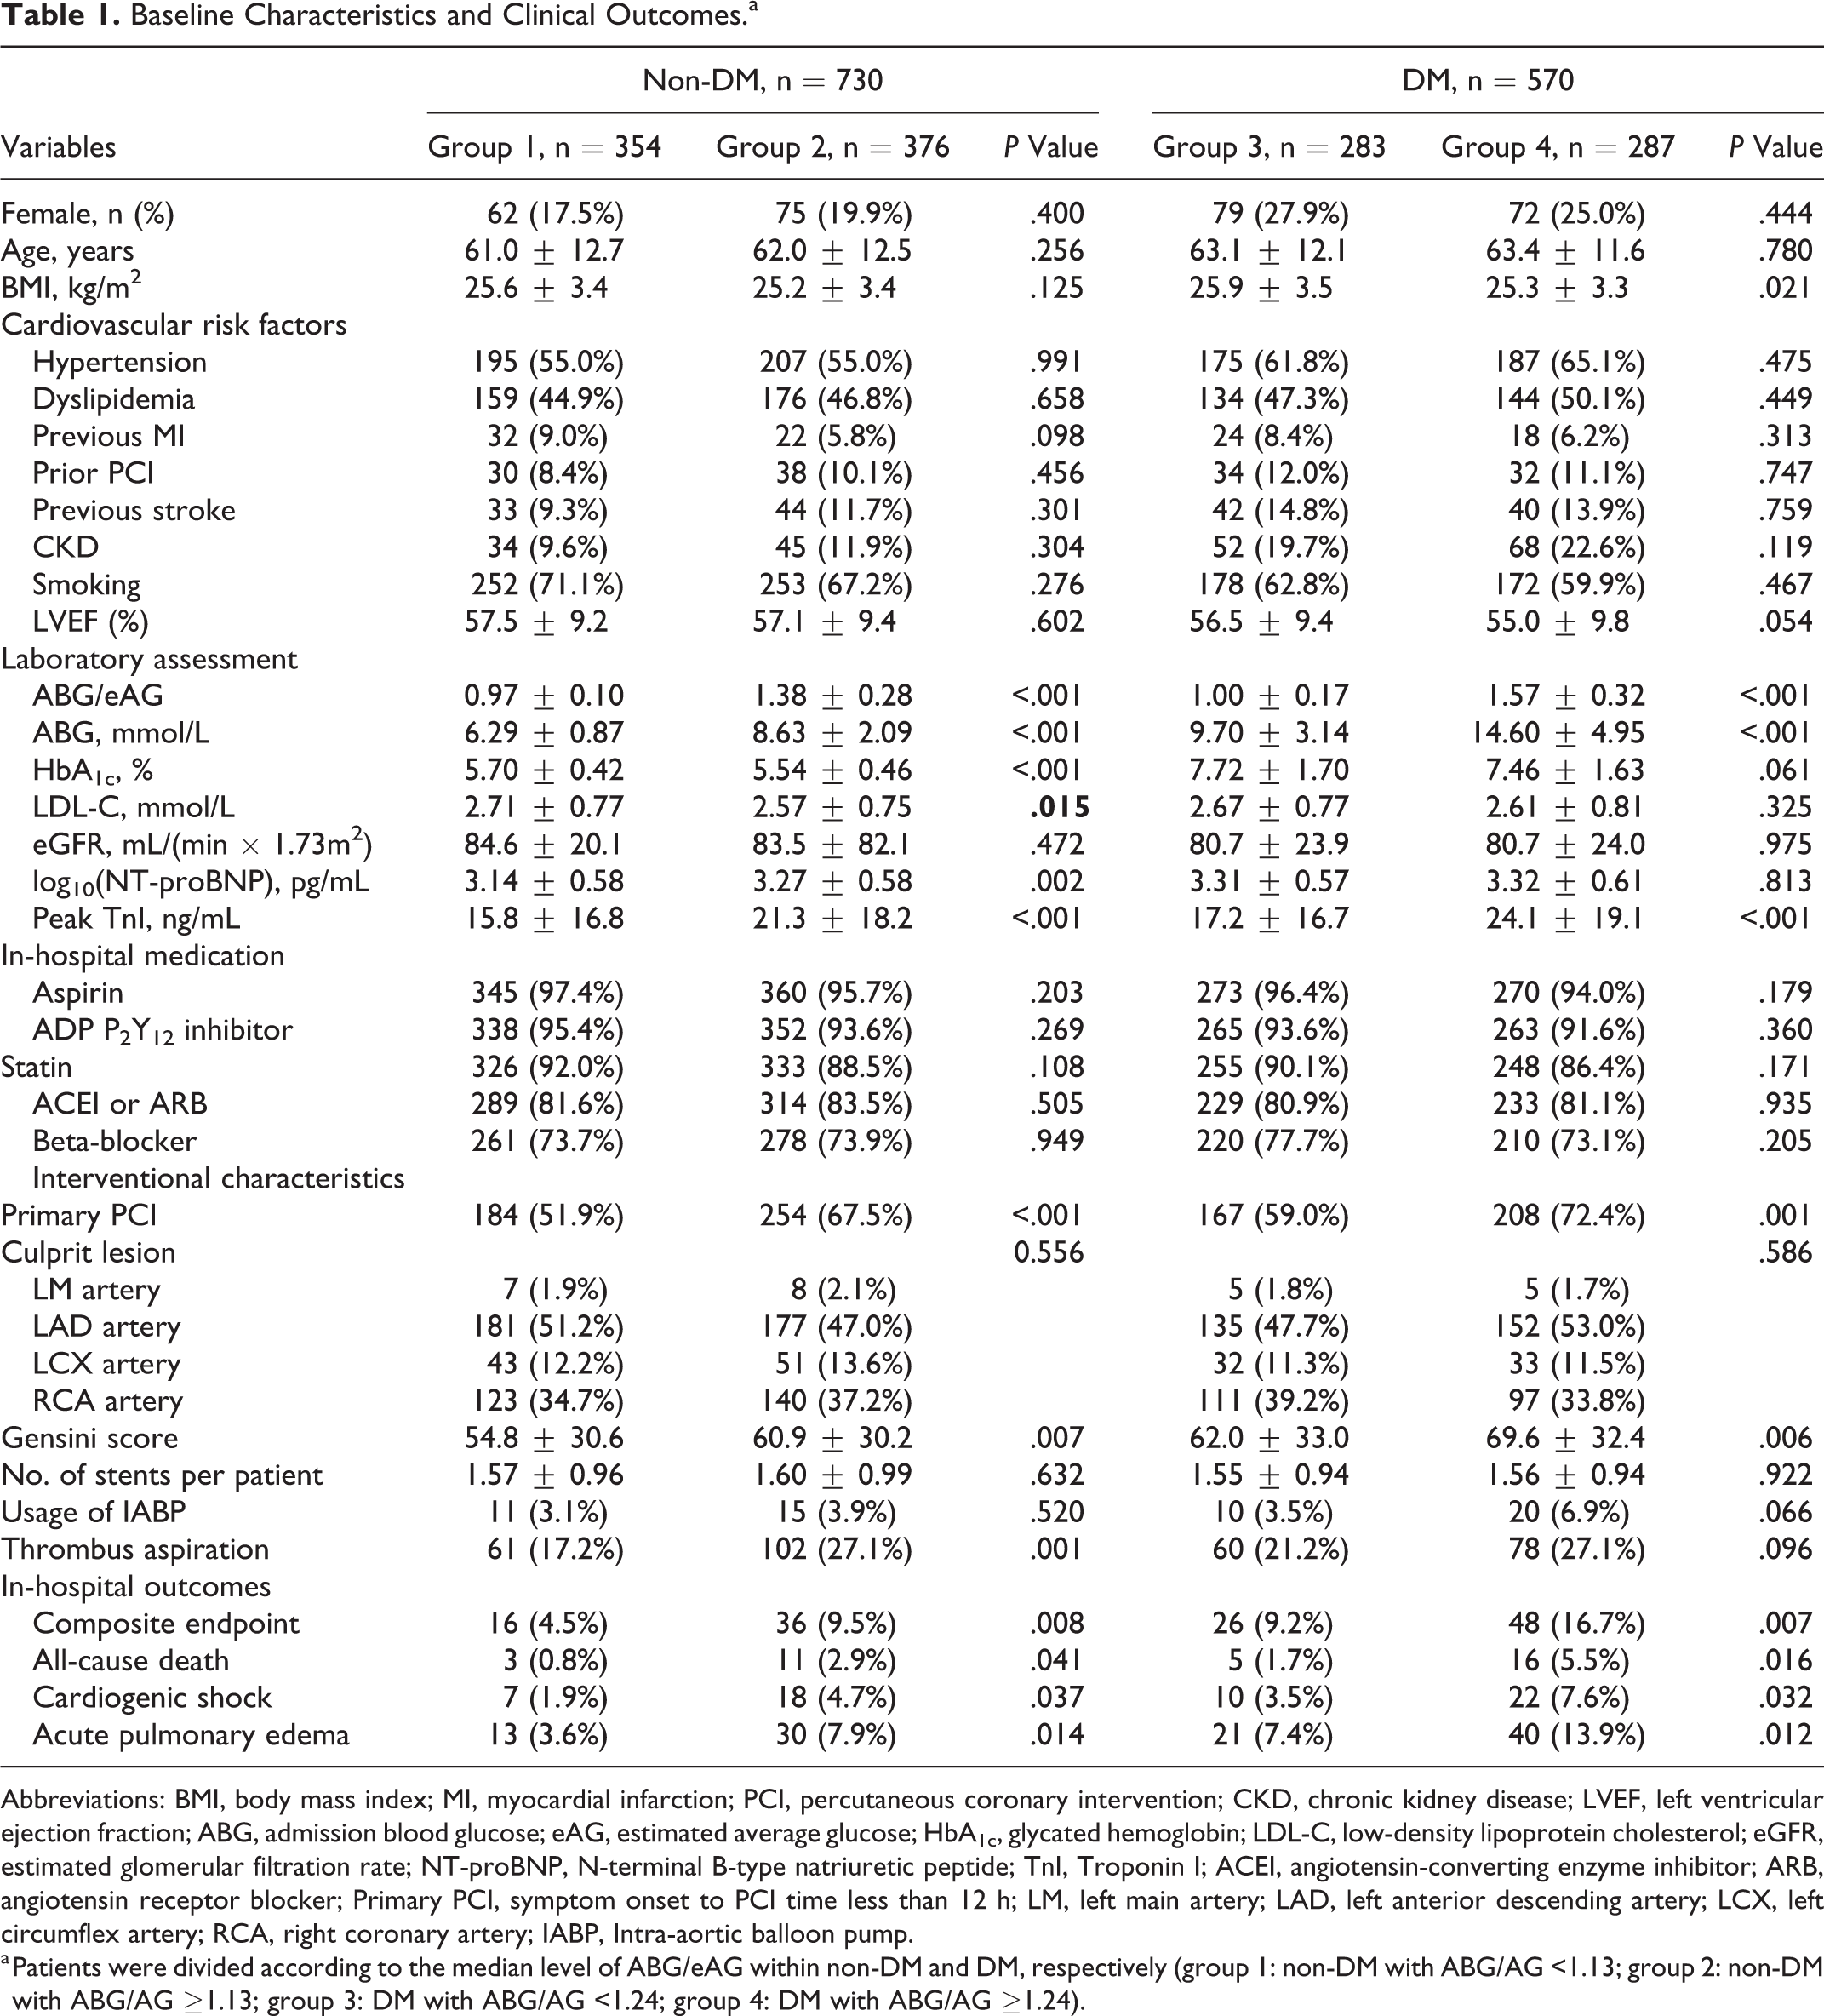
Abbreviations: BMI, body mass index; MI, myocardial infarction; PCI, percutaneous coronary intervention; CKD, chronic kidney disease; LVEF, left ventricular ejection fraction; ABG, admission blood glucose; eAG, estimated average glucose; HbA1c, glycated hemoglobin; LDL-C, low-density lipoprotein cholesterol; eGFR, estimated glomerular filtration rate; NT-proBNP, N-terminal B-type natriuretic peptide; TnI, Troponin I; ACEI, angiotensin-converting enzyme inhibitor; ARB, angiotensin receptor blocker; Primary PCI, symptom onset to PCI time less than 12 h; LM, left main artery; LAD, left anterior descending artery; LCX, left circumflex artery; RCA, right coronary artery; IABP, Intra-aortic balloon pump.
a Patients were divided according to the median level of ABG/eAG within non-DM and DM, respectively (group 1: non-DM with ABG/AG <1.13; group 2: non-DM with ABG/AG ≥1.13; group 3: DM with ABG/AG <1.24; group 4: DM with ABG/AG ≥1.24).
Association Between ABG/eAG Level and In-Hospital Outcomes
The multivariate logistic regression analysis (Table 2) indicated that elevated ABG/eAG and ABG were both strongly associated with an increased risk of the composite end point in non-DM patients (ABG/eAG: OR = 5.84, 95% CI: 2.50-13.66, P < .001; ABG: OR = 1.28, 95% CI: 1.12-1.46, P < .001). In patients with DM, however, the ABG was no longer a risk factor for the composite end point (OR = 1.00, 95% CI: 0.94-1.05, P = .979), while the ABG/eAG was still associated with the outcomes (OR = 2.45, 95% CI: 1.24-4.82, P = .010; Table 2).
Prognostic Effect of ABG/eAG and ABG on the Risk of Composite End Point.a
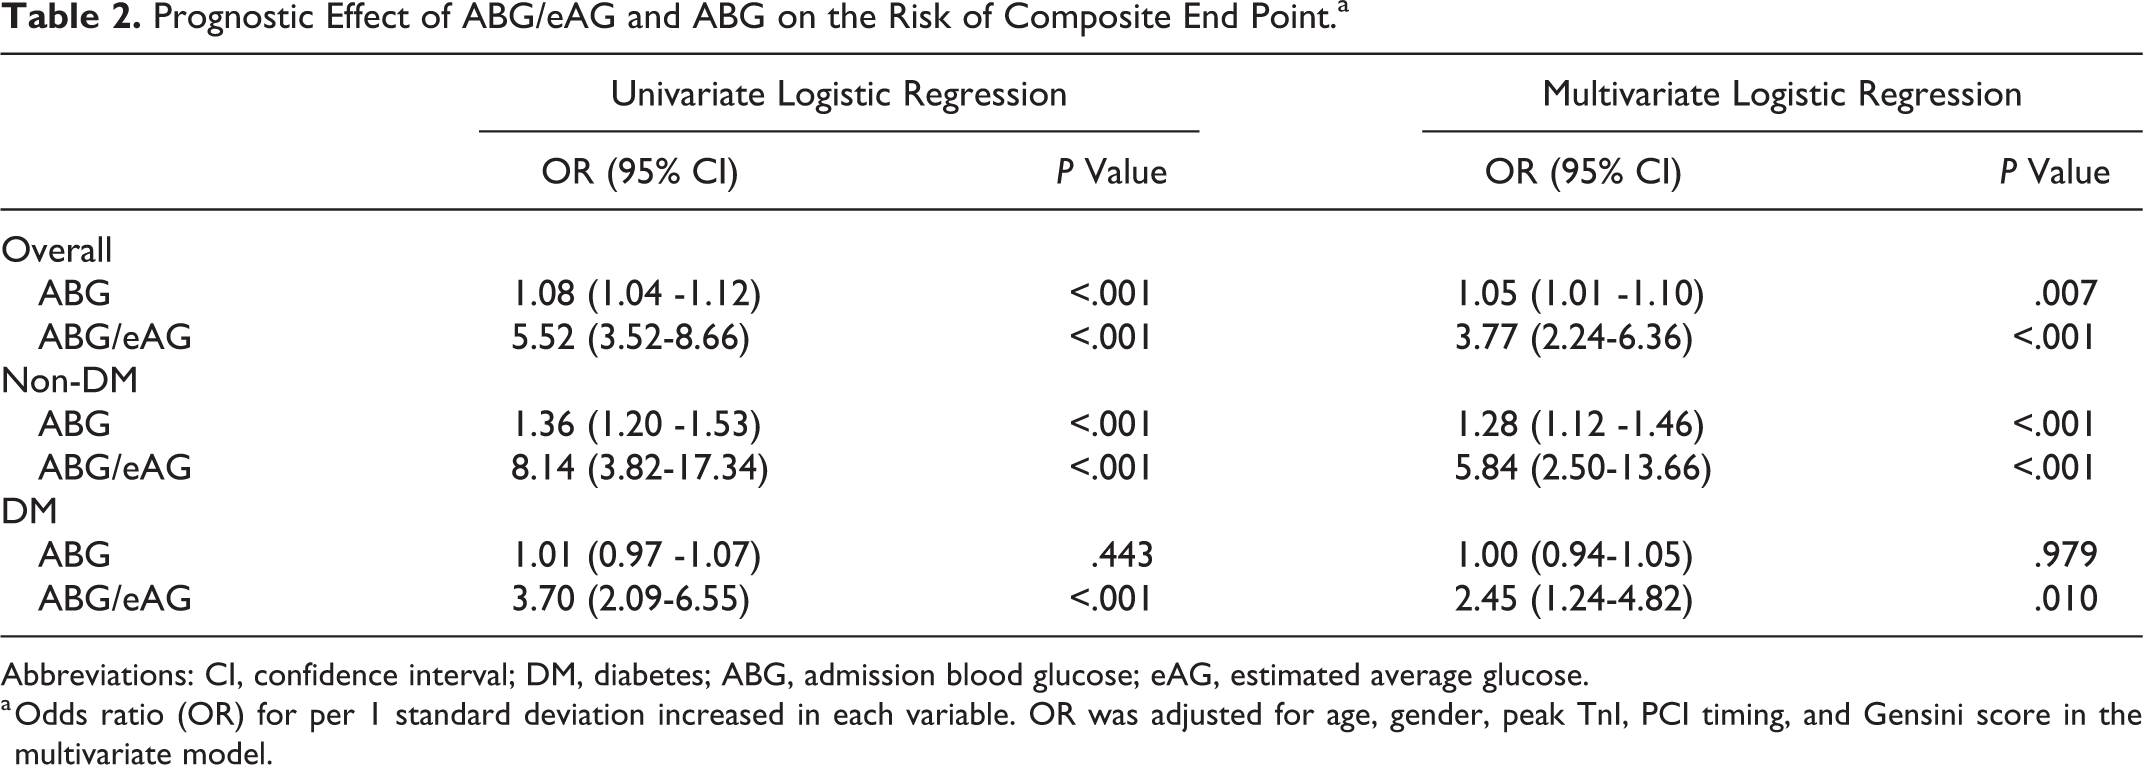
Abbreviations: CI, confidence interval; DM, diabetes; ABG, admission blood glucose; eAG, estimated average glucose.
a Odds ratio (OR) for per 1 standard deviation increased in each variable. OR was adjusted for age, gender, peak TnI, PCI timing, and Gensini score in the multivariate model.
After subgroup analysis, the ABG/eAG remained a robust predictor of prognosis in subsets of patients stratified by the age, gender, hypertension, dyslipidemia, LVEF, timing of PCI, and the Gensini score (All P < .05; Figure 2). We further stratified patients with DM according to diabetic duration, prior treatment method, and baseline glycemic control as assessed by the HbA1c. In each subgroup, the ABG/eAG was still strongly associated with the risk of composite end point (all P < .05), suggesting that the critical relevant factors for DM have little influence on the prognostic effect of the ABG/eAG ratio (Table 3).
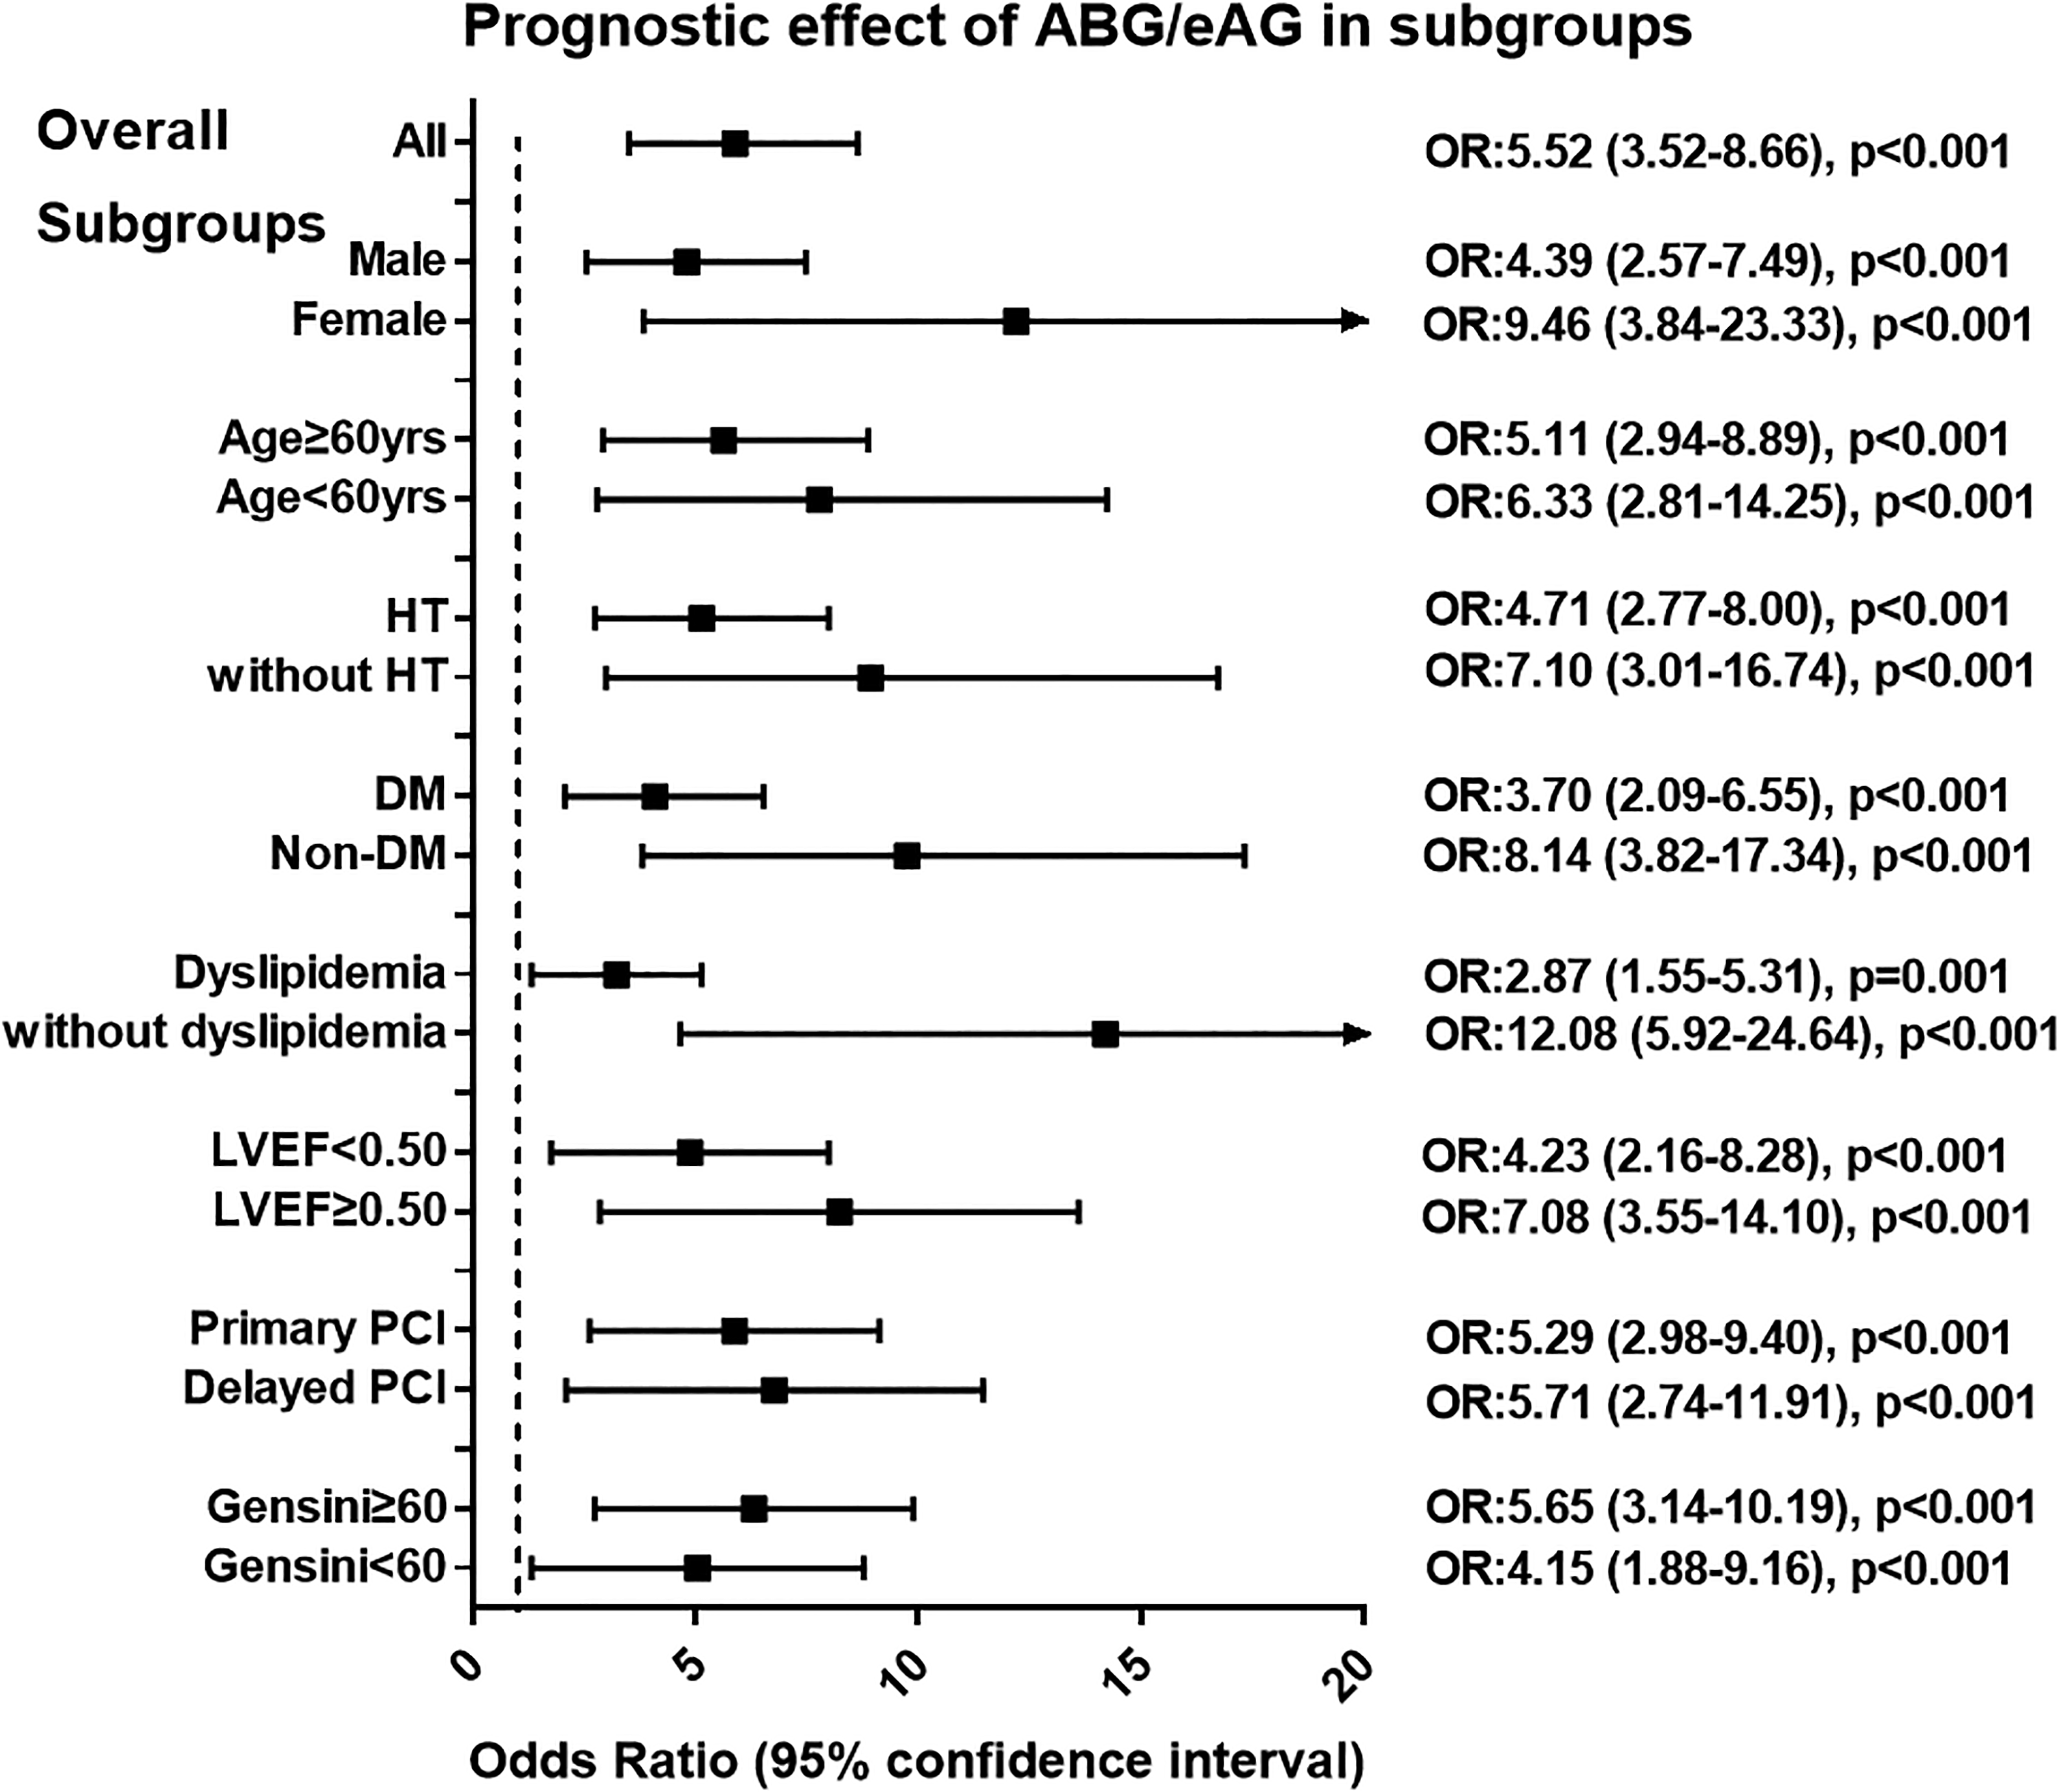
Relationship between ABG/eAG level and the risk of composite end point in overall and in subgroups of patients. Patients were stratified by sex, age, hypertension, diabetes, dyslipidemia, LVEF level, PCI timing, and the Gensini score. Odds ratio (OR) was calculated by the univariate logistic regression analysis. Odds ratio for per 1 standard deviation increased in ABG/eAG. Vertical dotted line indicated the OR value of 1. ABG indicates admission blood glucose; DM, diabetes; eAG, estimated average glucose; HT, hypertension; LVEF, left ventricular ejection fraction; PCI, percutaneous coronary intervention.
Influence of Diabetic Relevant Factors on Prognostic Effect of ABG/eAG.a
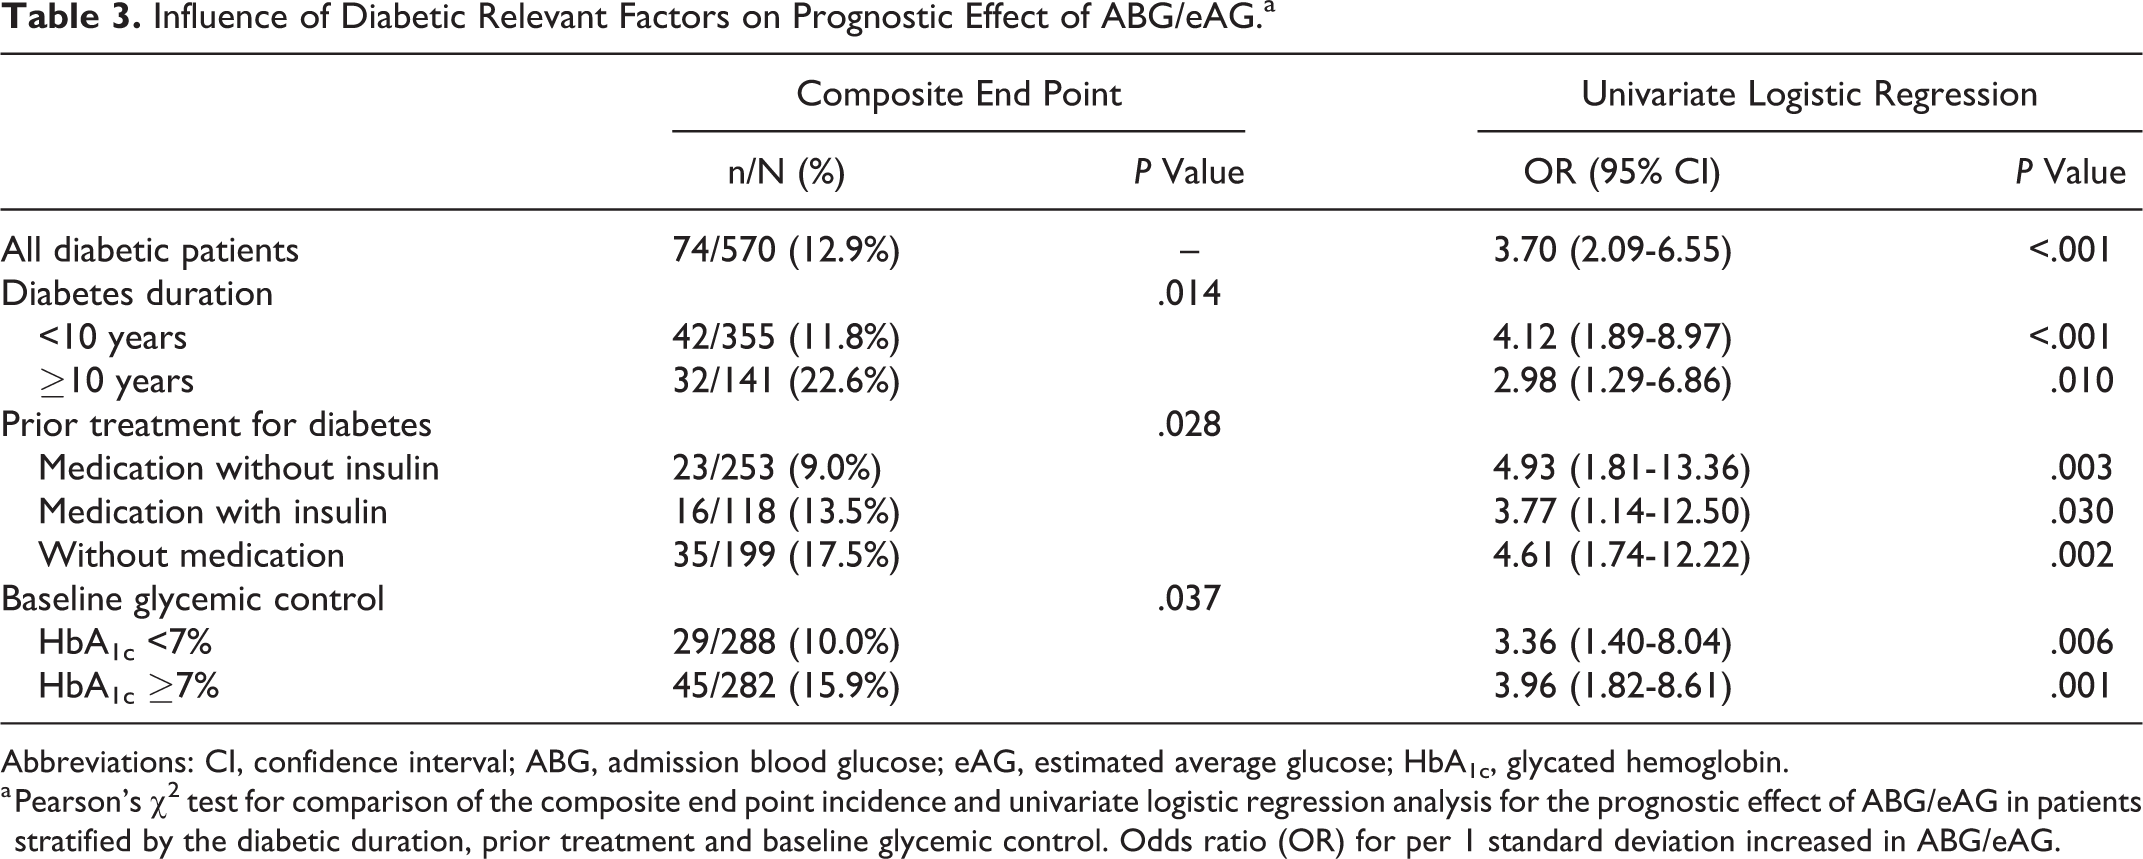
Abbreviations: CI, confidence interval; ABG, admission blood glucose; eAG, estimated average glucose; HbA1c, glycated hemoglobin.
a Pearson’s χ2 test for comparison of the composite end point incidence and univariate logistic regression analysis for the prognostic effect of ABG/eAG in patients stratified by the diabetic duration, prior treatment and baseline glycemic control. Odds ratio (OR) for per 1 standard deviation increased in ABG/eAG.
Predictive Value of the ABG/eAG Ratio Compared to the ABG for In-Hospital Outcomes
At ROC analysis (Table 4, Figure 3), both the ABG/eAG and ABG had a moderate predictive value for the composite end point in non-DM patients. But the prognostic power of the ABG/eAG (AUC 0.52) was much better than the ABG (AUC 0.63) in patients with DM. The difference of discrimination was significant as assessed by DeLong test (P < .001). In the entire population, the cutoff value of the ABG/eAG that maximized the sensitivity and specificity for the composite end point prediction was identified as 1.32. Overall, 31.2% of patients had a ratio above the cutoff. The rate of the composite end point was 17.4% and 6.1% (P < .001) in all patients with an ABG/eAG ratio above and below the cutoff, respectively (adjusted OR: 2.51, 95% CI: 1.66-3.79, P < .001). Similarly, non-DM or DM patients with an ABG/eAG above the cutoff also had more risk of developing the composite end point (all P < .05; Figure 4).
Predictive Value of ABG/eAG Versus ABG for the Composite End Point.a
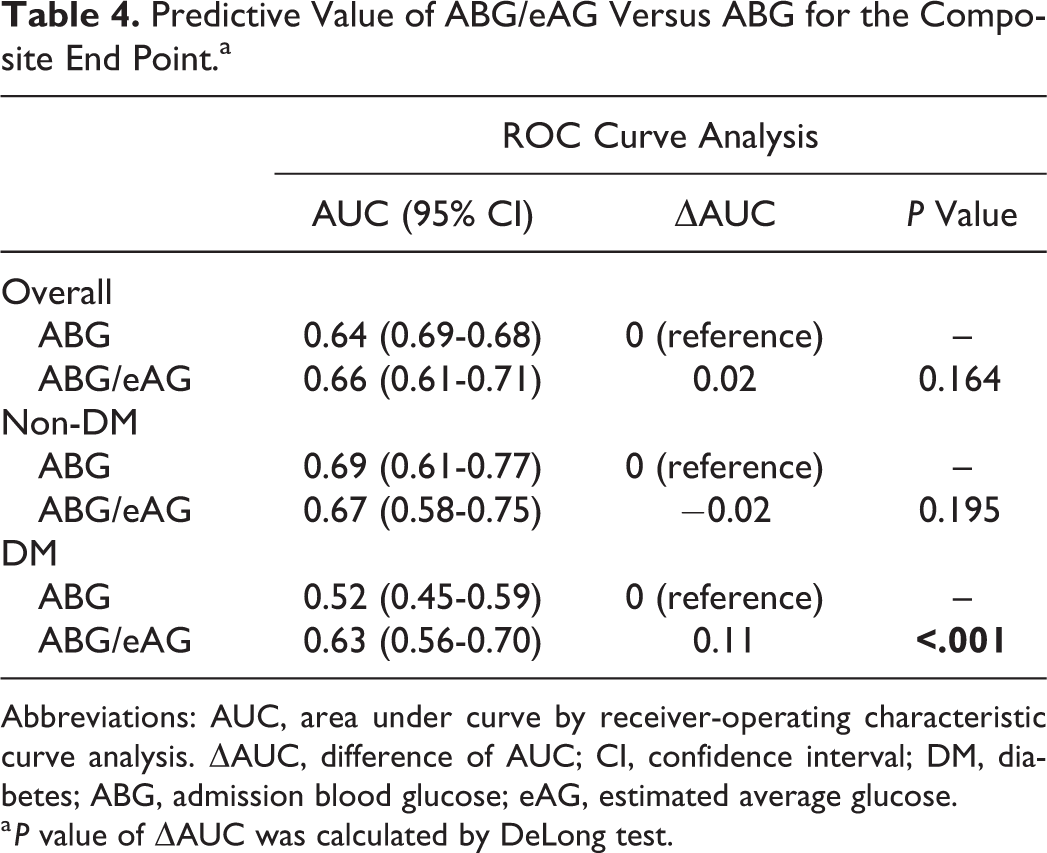
Abbreviations: AUC, area under curve by receiver-operating characteristic curve analysis. ΔAUC, difference of AUC; CI, confidence interval; DM, diabetes; ABG, admission blood glucose; eAG, estimated average glucose.
a P value of ΔAUC was calculated by DeLong test.
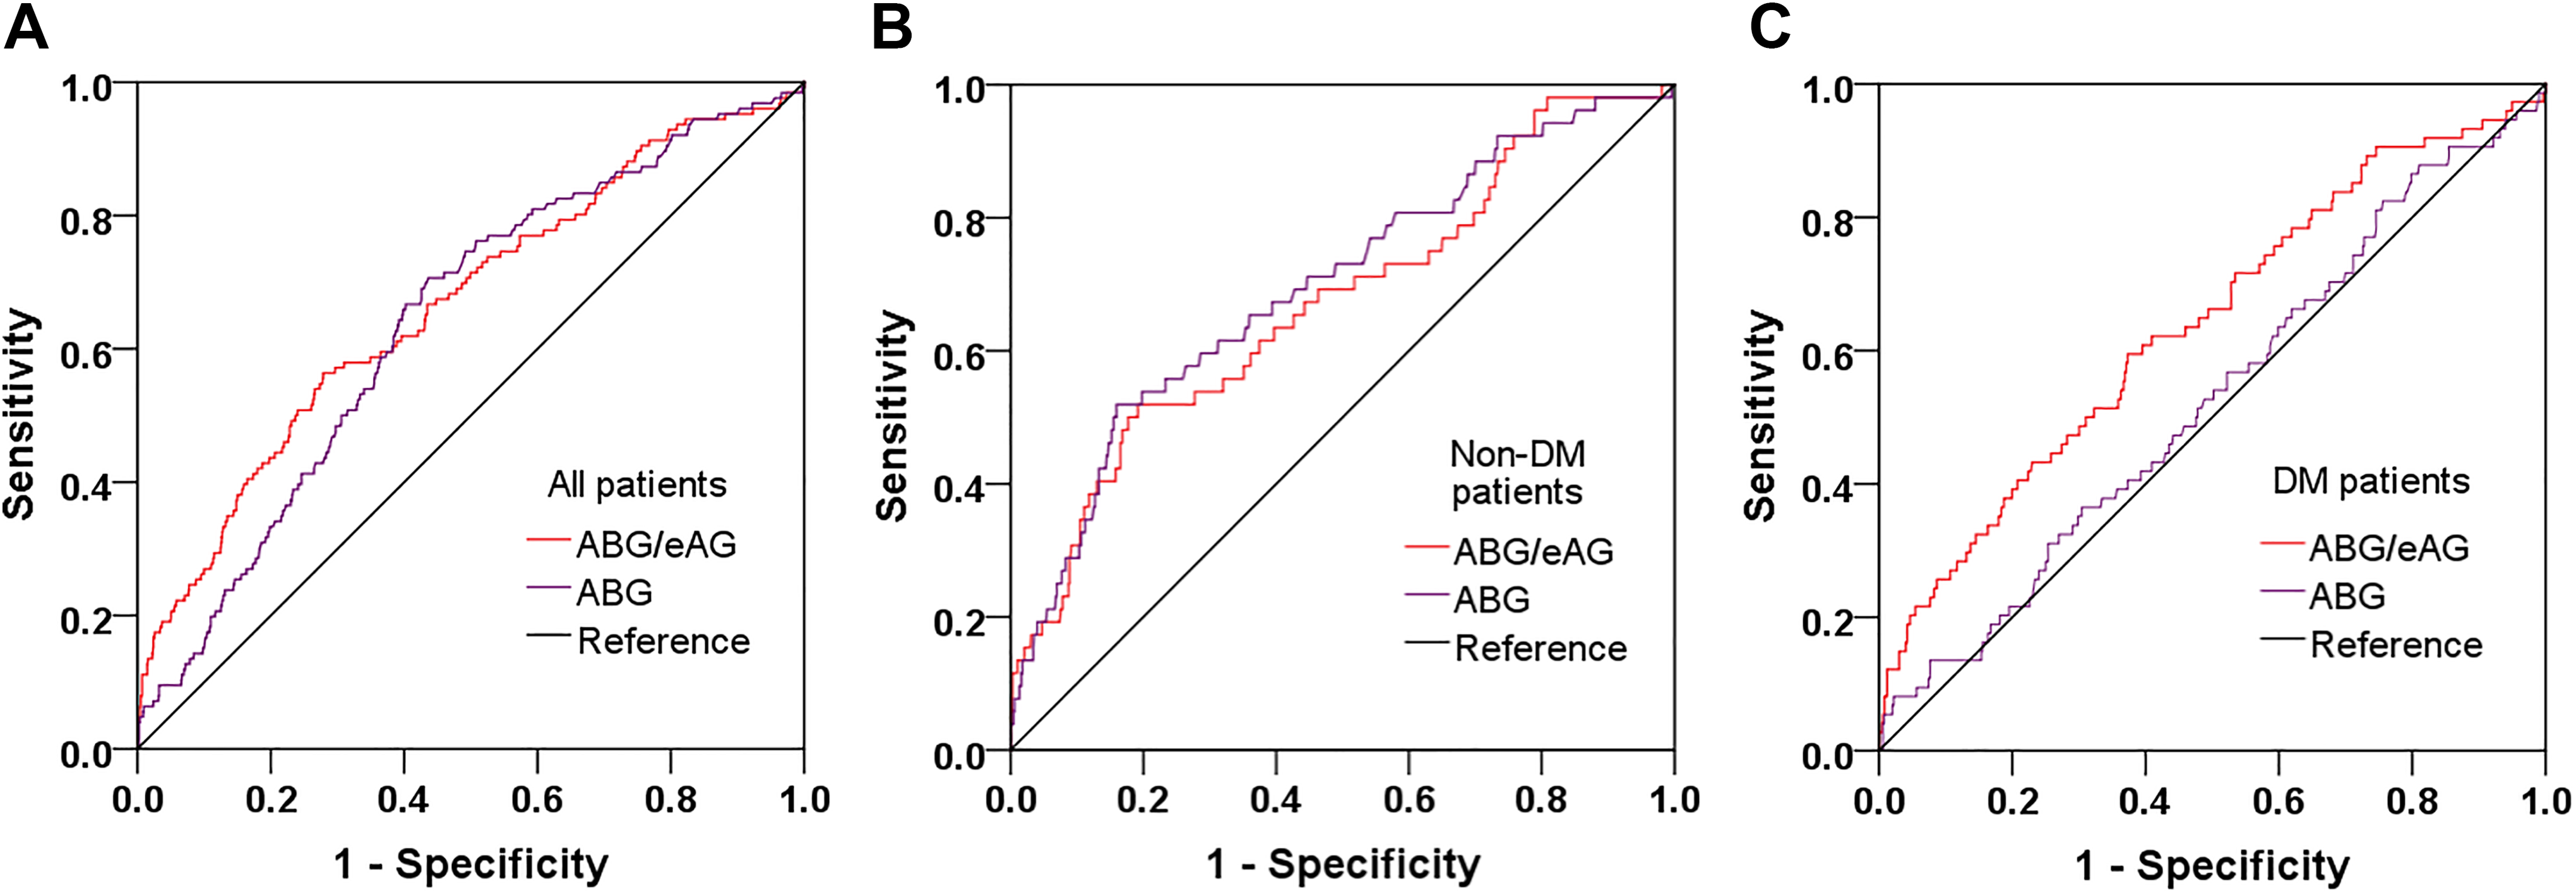
Predictive value of ABG/eAG and ABG for the composite end point. Receiver–operating characteristic curves of ABG/eAG and ABG in overall (A), non-DM (B) and DM (C) patients. ABG indicates admission blood glucose; DM, diabetes; eAG, estimated average glucose.
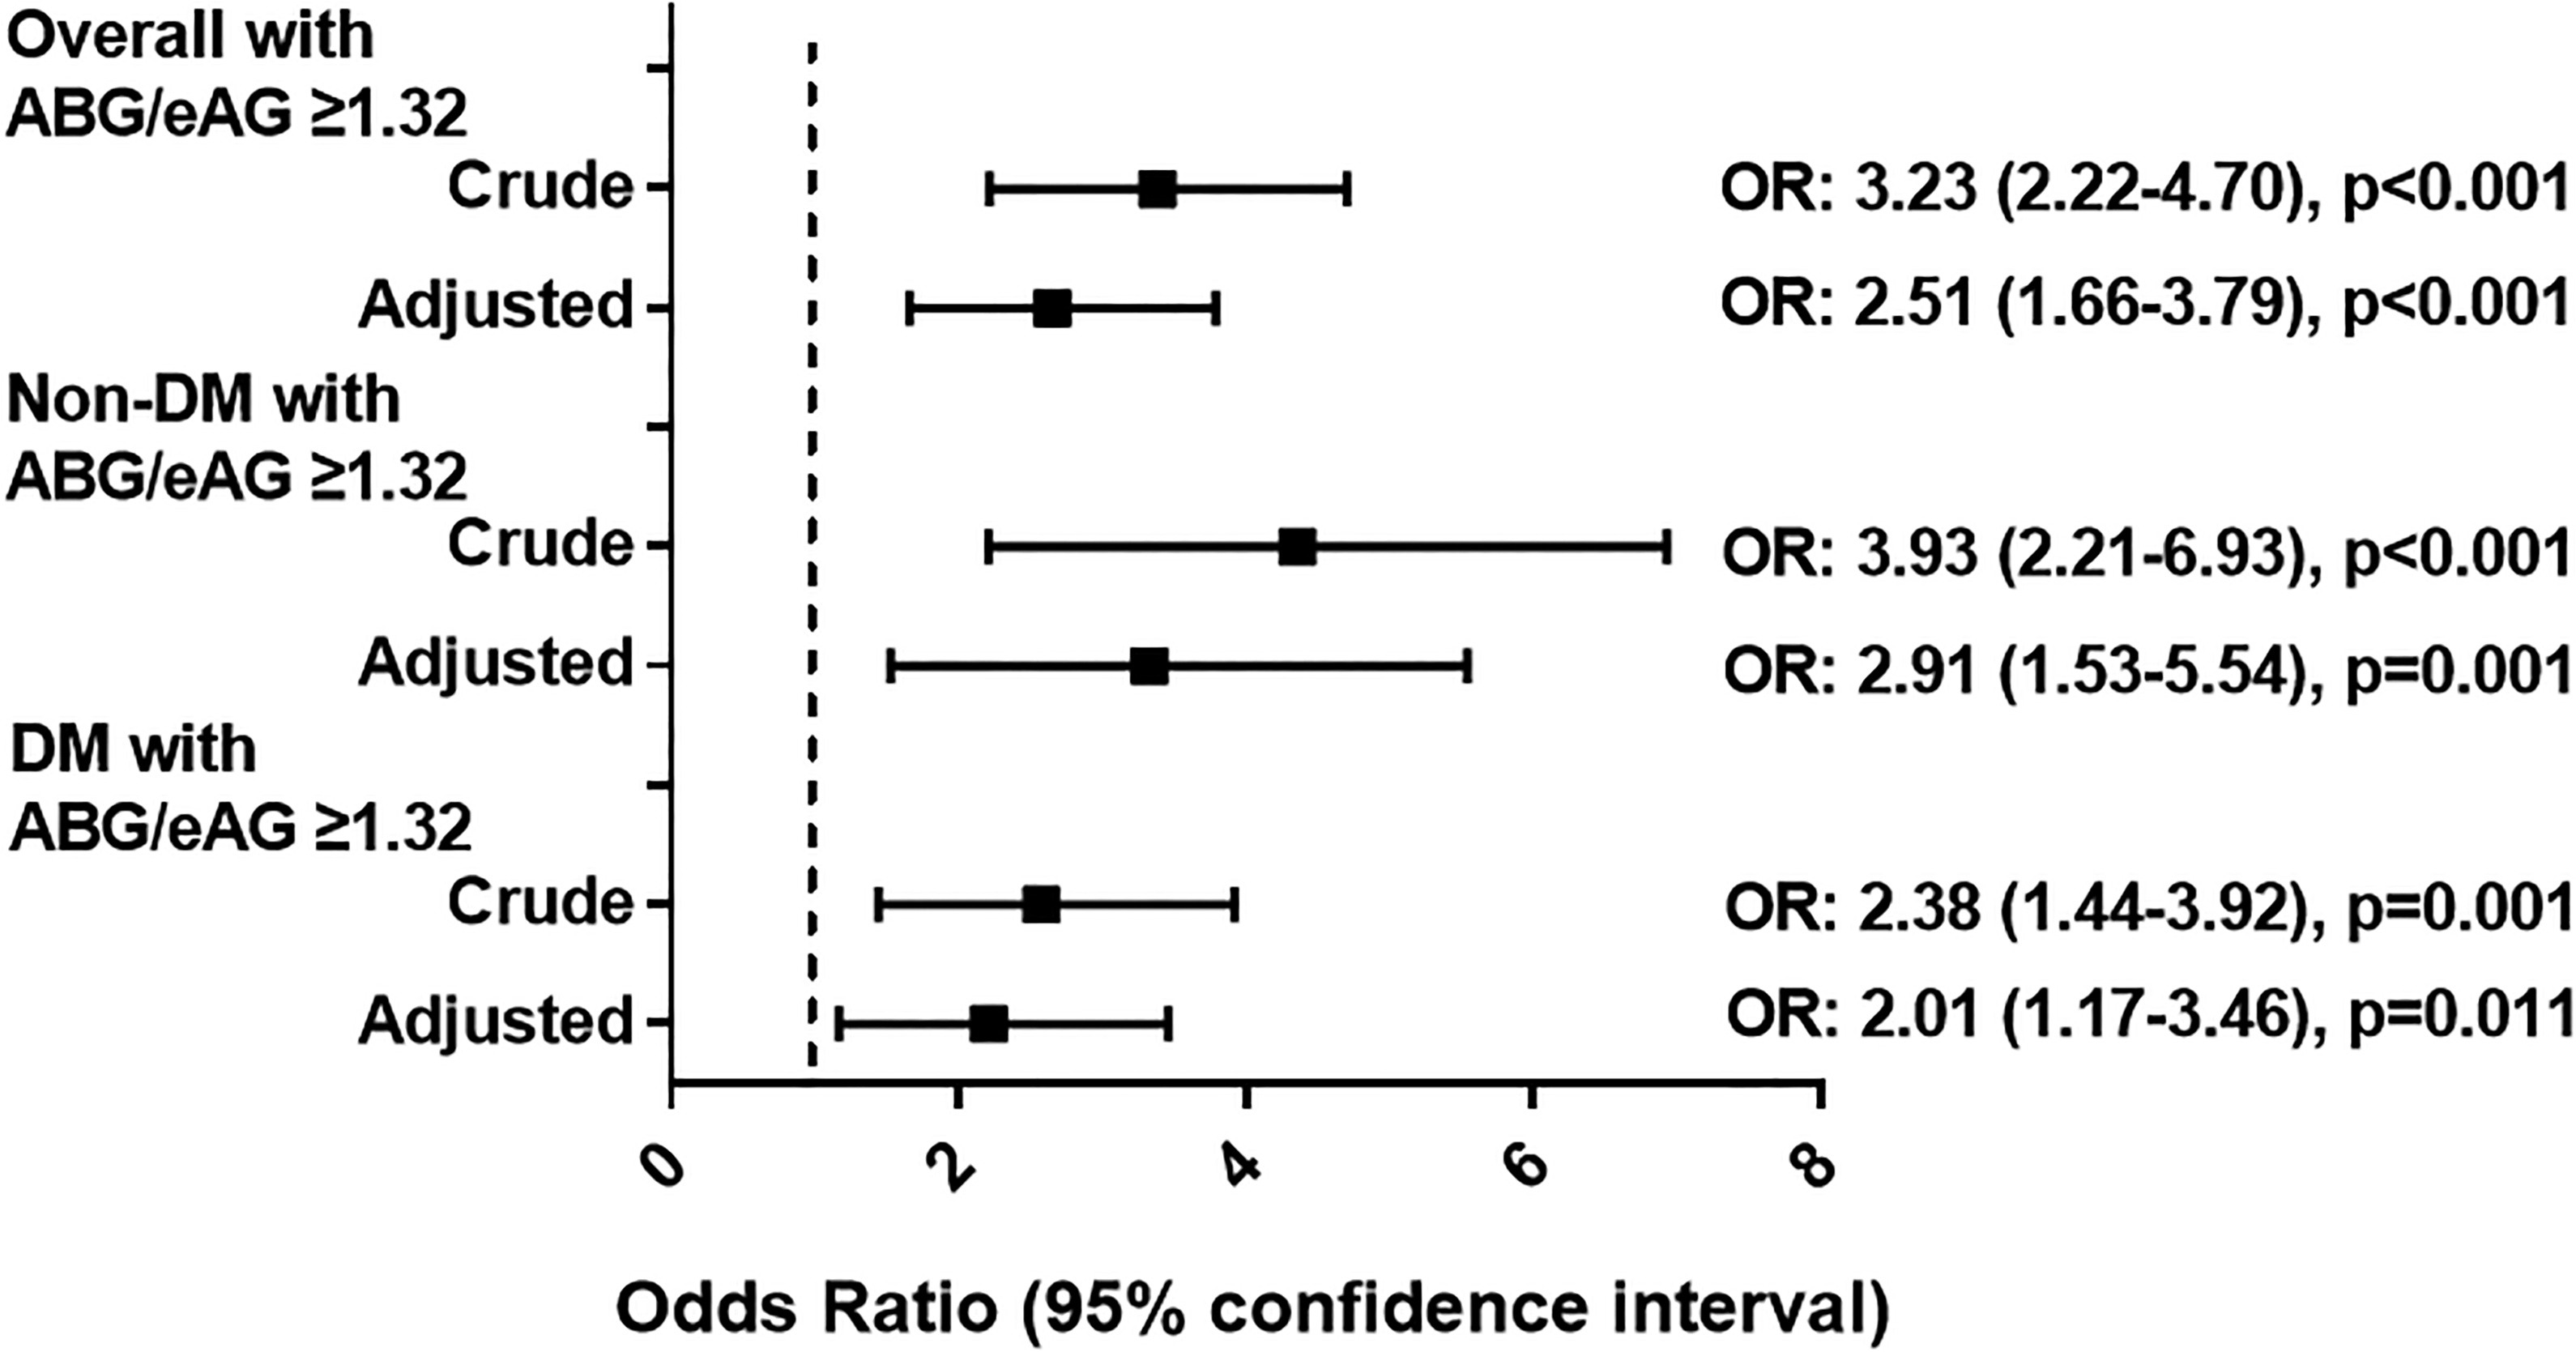
Prognostic effect of the identified cutoff value of ABG/eAG. Logistic regression analysis for the risk of composite end point in overall and in non-DM and DM patients with ABG/eAG above the cutoff value (≥1.32). This value was identified in the entire population for the composite end point prediction. Odds ratio (OR) was adjusted for age, gender, peak TnI, PCI timing, and Gensini score in the multivariate model. Odds ratio for per 1 SD increase in ABG/eAG. Vertical dotted line indicated the OR value of 1. ABG indicates admission blood glucose; DM, diabetes; eAG, estimated average glucose.
Discussion
Major Findings
In the present study, we demonstrated that the novel glycemic index ABG/eAG, also termed as acute-to-chronic glycemic ratio or stress hyperglycemia ratio, was a robust predictor of in-hospital mortality and morbidity in patients with STEMI after PCI. Its prognostic power was particularly prominent in diabetic patients compared to admission glycemia. This enables a more accurate prediction of in-hospital prognosis and thus facilitates clinical decision-making.
Predictive Value of Admission Glycemia for In-Hospital Outcomes After an AMI
Stress hyperglycemia is a concept emphasizing a relative increase in glycemia in response to stress reaction or critical illness. 22 Previous studies have confirmed that stress hyperglycemia is strongly associated with an increased risk of in-hospital mortality in patients with AMI with or without DM. 19 –22 Experimental evidence further clarified the underlying mechanisms. It is reported that an acute glycemic rise aberrantly activates the neuroendocrine system, releases excessive cortisol and catecholamine, triggers inflammation and oxidative stress, aggravates endothelial dysfunction, induces a prothrombotic state, and thus leads to a severe impairment in coronary flow. 23 –25 Moreover, the heart has to use free fatty acids as alternate substrates due to insufficient blood insulin and decreased glycolytic substrate levels. This may further exacerbate the reduced myocardial contractility and markedly increase the subsequent risk of pump failure and arrhythmia. 26 All these pathophysiologic changes would form a vicious cycle and ultimately result in the worse outcomes following AMI. The benefits brought by successful revascularization may thus be attenuated or even abolished.
In line with these studies, we first used admission glycemia (ABG) to define the degree of stress hyperglycemia. The ABG performed well in predicting the combined adverse events in the overall study population and in nondiabetic patients. However, elevated ABG was no longer a predictor of poor prognosis in diabetic patients. There may be several explanations. First, ABG was measured on arrival and could be affected by confounders. Therefore, its predictive value was inferior to the mean hospitalization glucometrics. 27 Second, many diabetic patients had received the optimal glucose-lowering treatment and achieved a good glycemic control, while others had not; thus, a single ABG value did not necessarily reflect the average glycemic level, and its prognostic power might be attenuated in diabetic patients.
A J-shaped relationship between the average glycemia and the in-hospital mortality has been identified for decades. 27 Interestingly, the impact of acute hyperglycemia is more prominent in nondiabetic patients than in those with DM, indicating that ABG might not be an ideal marker to identify a real acute glycemic rise, especially in diabetic patients with chronically elevated glycemic levels. Thus, a more refined index is warranted to describe the intensity of stress hyperglycemia.
Prognostic Power of Acute-to-Chronic Glycemic Ratio in Patients With AMI
As proposed by Roberts et al, the ABG/eAG ratio quantified the magnitude of a relative glycemic rise from chronic glycemia of the past 2 to 3 months and thus was a better biomarker of critical illness than absolute hyperglycemia in patients across the whole glycemic spectrum. Besides, it could better discriminate high-risk patients who had relative hyperglycemia with glucose levels below the conventional threshold (11 mmol/L) for glucose-lowering therapy. 9 Following its introduction, the clinical performance of ABG/eAG has been verified in several studies, basically confirming its good discriminatory properties in acute illness. 11 Recently, a large registry study has validated the prognostic power of ABG/eAG in predicting short- and long-term major adverse CV events in all spectrums of coronary artery disease undergoing PCI. 13 Another study further demonstrated that ABG/eAG was a better predictor of in-hospital morbidity and mortality than ABG in patients with AMI with DM. 14
Our results are consistent with previous studies. We proved that ABG/eAG was strongly associated with the risk of composite end point in patients with STEMI with or without DM, even after adjustment for major confounders. Moreover, ABG/eAG yielded a significantly superior discriminatory ability than ABG in diabetic patients, suggesting that the combined evaluation of acute and chronic glycemic levels could provide more prognostic information in patients with DM than admission glycemia alone.
Clinical Implication of Acute-to-Chronic Glycemic Ratio in Patients With AMI
In clinical practice, a tight glycemic control strategy is not necessarily the equivalent of an improved outcome. 28 For instance, to achieve an optimal glucose target in patients with AMI with hyperglycemia, many studies have tested the efficacy of glucose, insulin, and potassium (GIK) solution. They proposed that GIK could control blood glucose and transfer potassium into the cell by the aid of insulin infusion. It was also hypothesized that GIK could change myocardial substrate utilization from free fatty acids to glucose and thus help to recover the ischemic myocardium. 29 However, the Clinical Trial of Reviparin and Metabolic Modulation in Acute Myocardial Infarction Treatment Evaluation-Estudios Cardiológicos Latinoamérica (CREATE-ECLA) study revealed that the GIK regimen did not demonstrate improved outcomes in patients with AMI. 30 A meta-analysis concluded that GIK did not reduce mortality after an AMI. 31 Apart from GIK, treatment with infused insulin only also failed to show a significant decrease in mortality following AMI. 32–33 Furthermore, the large randomized controlled trials have confirmed a neutral or even deleterious effect of intensive glucose-lowering treatment on CV outcomes in patients with DM. 34 –37 In fact, an intensive lowering of glucose can markedly increase the risk of hypoglycemia and cause acute glycemic variability, thus imposing a detrimental effect on prognosis. Besides, the metabolic glucose memory phenomenon exists in DM, indicating that the prior glycemic control may have a sustained effect that persists even after returning to the current glycemic control. 38 In this regard, a relative glycemic rise rather than admission glycemia alone should be more emphasized during glucose-lowering treatment. That is also the reason for which ABG/eAG is designed and validated. We think the clinical prospect of the ABG/eAG would be promising for its good effectiveness and applicability. It might be reasonable to use ABG/eAG as a reliable and updated index for risk stratification in patients with STEMI and particularly in patients with DM. But far from claiming superiority or perfection, we should note that the accuracy of this novel marker is still moderate, and its performance should to be further verified by external validation. Randomized controlled trials are also needed to investigate whether a glucose-lowering strategy targeted on ABG/eAG instead of ABG may result in a better prognosis following STEMI.
Limitations
Several limitations should be acknowledged. First, this was an observational study at a single center, and the sample size was limited; hence, our findings still need to be verified by multicenter and larger cohort studies. Second, we only considered in-hospital death, acute pulmonary edema, and cardiogenic shock as the composite end point in our study and did not analyze other adverse events, including ventricular arrhythmia, acute stent thrombosis, or stroke. Third, despite major confounders such as clinically relevant or differently distributed variables were adjusted in the multivariate model and the subgroup analysis was performed, there were possibly residual confounding factors that may affect the outcomes. Fourth, we only enrolled patients with STEMI treated with PCI; therefore, our findings remain to be proven in “all-comer” patients with acute coronary syndrome.
Conclusions
In patients with STEMI after PCI, the ABG/eAG ratio was closely associated with in-hospital morbidity and mortality. Compared to admission glycemia alone, the ABG/eAG ratio had an equivalent prognostic value in nondiabetic patients but a superior predictive accuracy in diabetic patients. Physicians may use the ABG/eAG ratio to identify true stress hyperglycemia, to discriminate high-risk patients and to tailor glucose-lowering treatment accordingly in the management of patients with STEMI and particularly in patients with DM.
Footnotes
Acknowledgments
We thank the participating physicians and statisticians for their contribution to the establishment and maintenance of CBD BANK database in Beijing Friendship Hospital.
Declaration of Conflicting Interests
The author(s) declared no potential conflicts of interest with respect to the research, authorship, and/or publication of this article.
Funding
The author(s) disclosed receipt of the following financial support for the research, authorship, and/or publication of this article: This study was supported by National Natural Science Foundation of China (81670315) and Beijing Natural Science Foundation (7172059).