
Abstract
Building on cornerstone traditions in historical sociology, as well as work in environmental sociology and political-economic sociology, we theorize and investigate with moderation analysis how and why national militaries shape the effect of economic growth on carbon pollution. Militaries exert a substantial influence on the production and consumption patterns of economies, and the environmental demands required to support their evolving infrastructure. As far-reaching and distinct characteristics of contemporary militarization, we suggest that both the size and capital intensiveness of the world’s militaries enlarge the effect of economic growth on nations’ carbon emissions. In particular, we posit that each increases the extent to which the other amplifies the effect of economic growth on carbon pollution. To test our arguments, we estimate longitudinal models of emissions for 106 nations from 1990 to 2016. Across various model specifications, robustness checks, a range of sensitivity analyses, and counterfactual analysis, the findings consistently support our propositions. Beyond advancing the environment and economic growth literature in sociology, this study makes significant contributions to sociological research on climate change and the climate crisis, and it underscores the importance of considering the military in scholarship across the discipline.
Keywords
Rich bodies of sociological theory and analyses have significantly advanced scientific understanding of the human dimensions of climate change (e.g., Davidson 2022; Dietz, Shwom, and Whitley 2020; Dunlap and Brulle 2015; Klinenberg, Araos, and Koslow 2020; Norgaard 2018). Distinct research traditions focus on how structural characteristics of societies, usually nation-states, generate different levels and rates of carbon dioxide and other greenhouse gas emissions, and also how relationships between nations shape their unequal contributions to emissions and planetary warming (e.g., Givens, Huang, and Jorgenson 2019; Kelly 2020; Pellow and Brehm 2013; Rice 2007; Rudel, Roberts, and Carmin 2011). While broadening and deepening the presence of environmental sociology in the discipline as a whole (Lockie 2022; Mezey 2020; Scott and Johnson 2017; Smith 2017), this scholarship also contributes to interdisciplinary climate science efforts and policy considerations (Haberl et al. 2020; IPCC 2022; Jorgenson et al. 2019; Longo et al. 2021; Rosa and Dietz 2012; Thomas et al. 2019). 1
Drawing on various disciplinary subfields, the most central question within this area of sociological inquiry concerns the relationship between nations’ carbon emissions and their economic growth (Bohr and Dunlap 2018; Fisher and Jorgenson 2019; Stuart 2021). A suite of critical perspectives, including treadmill of production and metabolic rift theories, argue that economic growth is antithetical to environmental protection, given the increased energy and resource demands, as well as the subsequent environmental harms, associated with such growth (e.g., Clark and York 2005; Foster 1999; Gould, Pellow, and Schnaiberg 2008). In contrast, more optimistic perspectives, such as ecological modernization theory and environmental state approaches, suggest energy efficiency improvement and environmental protection measures often accompany growth (e.g., Fisher and Freudenburg 2004; Hironaka 2014; Mol 2003). Prior research tends to support the more critical perspectives. Analyses consistently show positive associations between carbon emissions and economic growth, with the magnitude of the relationship varying for nations in different structural and temporal contexts (e.g., Dietz 2017; Dietz and Rosa 1997; Jorgenson 2014; Jorgenson and Clark 2012; Rosa, York, and Dietz 2004; Thombs 2018a; Thombs and Huang 2019; York 2012).
To advance sociological research on climate change, it is necessary to gain greater understanding of how other prominent societal characteristics shape the relationship between emissions and economic growth. Although largely overlooked in generalist sociology, studying the role of militaries is a vital direction to pursue, given the emergence of the war economy and defense industry (see also Giddens 1987; Hooks 1990).
2
As Andreski (1968:1) argued decades ago: The problem of the influence of military organization on society has, on the whole, failed to attract the attention of social scientists. To be sure, much has been written about war, its alleged evil or beneficial effects, its causes and the possibilities of its abolition. But the only writers who appreciated the importance of military factors in shaping societies were Max Weber and Gaetano Mosca. This persistent neglect is due, I think, to the insidious utopianism which pervades sociological thinking.
Building on foundational traditions in historical sociology (e.g., Chase-Dunn 1998; Mann 2012; Mills 1956; Tilly 1990) as well as work in environmental sociology (e.g., Hooks and Smith 2004; Smith and Lengefeld 2020) and political-economic sociology (e.g., Boswell 1989; Scanlan and Jenkins 2001), we theorize and investigate with moderation analysis how and why militarization amplifies the effect of economic growth on nations’ carbon emissions. As complex social institutions, the world’s militaries exert a sizable influence on the production and consumption patterns of nations and their economies, and the environmental demands required to support their evolving infrastructure.
The rise of the world’s militaries, especially after the Second World War, led to modern forms of militarization shaping carbon-intensive growth in national and international economies through contracts for research, development, production, and support. The continual preparation for potential conflicts and the desire to maintain national security increases the scale of resource-consuming economic activities within the defense industry. With elaborate communication technologies, larger ships, and faster planes and helicopters, militaries move people and equipment throughout the world more quickly. Extensive production systems and supply chains within the defense industry and other areas of the private sector operate to meet the various needs of militaries’ infrastructures, including their bases and installations scattered around the globe, and the needs of their soldiers and support personnel.
National militaries are increasingly capital intensive, focusing on technologies in weaponry, transportation, and communications. In line with prior research, we use military expenditures per soldier to measure these capital-intensive features of militarization (e.g., Jorgenson and Clark 2009; Kentor and Jorgenson 2017; Kentor, Jorgenson, and Kick 2012; Looney 1990). Likewise, militaries with relatively larger forces require expansive built infrastructures and huge amounts of material goods, such as food and clothing. Consistent with other sociological inquiries, we use military participation rate, which quantifies a nation’s military personnel as percent of total labor force, to capture the relative size of militaries (e.g., Carlton-Ford 2010; Carlton-Ford et al. 2019; Kick et al. 1998; Kleykamp 2007). We suggest that both expenditures per soldier and participation rate measure far-reaching characteristics of militarization that enlarge the effect of economic growth on nations’ carbon emissions. In particular, we argue that each increases the extent to which the other amplifies the effect of economic growth on carbon pollution.
To test our arguments, we estimate longitudinal models of emissions for 106 nations from 1990 to 2016, with a particular focus on the three-way interaction between economic growth, measured as GDP per capita, military expenditures per soldier, and military participation rate. The three-way interaction allows us to quantify the effect of economic growth on emissions at different levels of military expenditures per soldier and military participation rate simultaneously. We treat carbon dioxide emissions per capita as our primary dependent variable, as it reflects international inequities in contributions to global emissions and climate change. We also estimate models of total emissions, which capture scale differences. Across various model specifications for different samples, robustness checks, a range of sensitivity analyses, counterfactual analysis, and for the two carbon measures, the findings confirm our propositions.
Literature Review
Economic Growth and Environmental Change
Sociological research on the human dimensions of global environmental change, including energy consumption and greenhouse gas emissions, largely focuses on the effects of economic growth (Caniglia et al. 2021; Dietz 2015; Dietz et al. 2020). On the one hand, optimistic perspectives argue that as societies experience economic growth, the magnitude of environmental harms is likely to decrease. The reductions in environmental harms are due to the emergence of an environmentally focused state (Dietz et al. 2015; Falkner 2021; Fisher and Freudenburg 2004; Frank 1997; Frank, Hironaka, and Schofer 2000; Spaargaren, Mol, and Buttel 2006) and a growing culture of post-materialism, coupled with a strengthening commitment to sustainability within civil society (Givens and Jorgenson 2013; Inglehart and Baker 2000; Kennedy and Givens 2019; Longhofer and Schofer 2010; Marquart-Pyatt 2012; Running 2013; Vasi et al. 2015). Other theorized mechanisms include emerging technologies driving the ecological modernization of production and distribution systems (Bugden 2022; Huber 2010; Mol 2003; Rieger 2021), as well as the overall greening of organizational culture and practices in the private sector through the adoption of an ecological rationality and the diffusion of corporate social responsibility (Sharkey and Bromley 2015; Vandenbergh and Gilligan 2017; cf. Grant, Bergesen, and Jones 2002; Lim and Tsutsui 2012).
On the other hand, critical perspectives argue that economic growth leads to increased environmental effects, including higher levels of carbon emissions. Economic growth is predicated on the continual expansion of markets, supported by treadmills of production with extensive horizontal and vertical linkages as well as transportation networks and logistics systems moving enormous volumes of raw materials and finished commodities throughout the world (Braswell 2022; Bunker and Ciccantell 2005; Clark, Auerbach, and Longo 2018; Deb 2021; Gould et al. 2008; Pellow 2007; York, Rosa, and Dietz 2003). If left unchecked, these energy-intensive and waste-generating processes disrupt socio-ecological systems, often exceeding natural limits while contributing to a global “carbon rift” (Clark and York 2005; see also Davidson and Andrews 2013; Foster 1999; Foster and Clark 2020; Foster and Holleman 2012).
Although nation-states adopt environmental regulations, they simultaneously prioritize economic growth through the protection of private property, bailing out different sectors and industries when deemed necessary, maintaining energy security, and promoting trade agreements, all of which place increased pressure on the environment (Almeida and Chase-Dunn 2018; Buttel 2000; Elliott and Frickel 2015; Gareau and Lucier 2018; Rudel 2009). The environmental benefits of technology are often reduced if not entirely outpaced, given the contradictory position of the state, the increasing energy and material demands of societies (partly due to efficiency-driven cost reductions that encourage greater production and consumption), and the overall growth and diversification of markets (Adua, Clark, and York 2021; Driscoll 2021; Grant, Jorgenson, and Longhofer 2020; Gunderson, Stuart, and Petersen 2018; Malin et al. 2019; Sanderson and Hughes 2019; Shwom 2011; York and McGee 2016).
A substantial body of sociological research consistently finds positive associations between nations’ carbon emissions and economic growth. Longitudinal studies indicate that the positive relationship increases in magnitude through time for less affluent nations, while remaining large and relatively stable for more affluent nations (Jorgenson 2014; Jorgenson and Clark 2012; Knight and Schor 2014; Thombs 2018a; Thombs and Huang 2019; Vesia, Mahutga, and Buì 2021; see also Adua, York, and Schuelke-Leech 2016; Burns, Davis, and Kick 1997; Greiner 2022; Huang 2018; Huang and Jorgenson 2018; Hyde and Vachon 2019; Kelly, Thombs, and Jorgenson 2021; Mejia 2021; Rosa et al. 2004; Soener 2019; York 2012). This corpus of research supports the general arguments of the more critical sociological approaches, and it has gained increased recognition among the climate change mitigation community (e.g., Haberl et al. 2020; IPCC 2022; Keyßer and Lenzen 2021).
Other studies focus on how certain factors moderate the positive relationship between carbon emissions and economic growth. For example, income inequality intensifies their association in affluent nations (McGee and Greiner 2018), whereas political inequality does the opposite: the positive relationship between emissions and growth is stronger for nations with higher levels of political equality (Thombs 2021). The overall role of renewable energy technology in shaping the emissions and economic growth association is inconclusive (e.g., Davidson 2019; Thombs 2017; York and McGee 2017), and nations more embedded in global environmental civil society experience a modest decrease in the positive relationship between emissions and growth through time (Longhofer and Jorgenson 2017; see also Fisher 2022; Grant and Vasi 2017; Schofer and Hironaka 2005; Shandra et al. 2004; Shorette 2012).
Militarization and Environmental Change
To advance sociological understanding of the causes of climate change, we theorize and test how a powerful yet overlooked dimension of human social organization influences the effect of economic growth on the environment: militarization. War itself destroys the environment through scorched earth practices, the use of biological and chemical weapons, and the killing of flora and fauna (Brauer 2009; Frey 2013; Mitchell 2020; Sills 2014; Wilcox 2011; Zierler 2011). From the mid-1940s to the early 1960s, the atmospheric testing of atomic and nuclear weapons produced radioactive fallout that spread great distances by wind, water, and living organisms, leading to increased cancer rates among downwinders (Commoner 1971; Rice 2015).
The environmental consequences of war in the modern era continue to evolve, as emerging technologies in weapons, transportation, and communications systems shape the scale and precision of destruction (Lengefeld, Hooks, and Smith 2021; Levy and Sidel 2007; Machlis and Hanson 2008). For the more capital-intensive and technologically advanced militaries, this manifests in forms of “risk-transfer militarism” (Shaw 2002, 2005), which shields their homeland’s citizens, minimizes casualties for their soldiers, and decreases loss of machinery, while inflicting damage on human populations, the built environment, nonhuman species, and the overall natural environment of distant locations (Hooks, Lengefeld, and Smith 2021; Lengefeld and Smith 2013; Smith and Lengefeld 2020).
As noted by sociologists advancing the treadmill of destruction perspective, the environmental effects of militarization are not limited to war and weapons testing (Hooks and Smith 2004, 2005; see also Alvarez 2016; Bradford and Stoner 2017; Clark and Jorgenson 2012; Lawrence et al. 2015). In the name of national security, and motivated by geopolitics and risk-transfer militarism, militaries continually invest in and pursue new technologies in weapons, transportation, and communications systems (Alic et al. 2010; Burmaoglu and Sarıtas 2017; Mann 2014). The United States alone has over 900 domestic bases and over 800 international bases in 130 countries, as well as smaller military installations known as lily pads throughout the world (Johnson 2004; Sanders 2009; Turse 2015; Vine 2015). The scale of militaries’ evolving infrastructure, including their transportation systems to move people, supplies, and weaponry by land, air, and water throughout the globe, and their constant research and development activities, involve the consumption of substantial amounts of fossil fuels and petroleum-based items as well as other material resources ranging from steel to cotton (Belcher, Neimark, and Bigger 2020; Lawrence et al. 2015; USDOD 2020). These capital-intensive and scale characteristics of militarization all contribute, directly or indirectly, to greenhouse gas emissions and various forms of environmental degradation (Belcher, Bigger, et al. 2020; Clark, Jorgenson, and Kentor 2010; Gould 2007; Jorgenson, Clark, and Kentor 2010; Roberts, Grimes, and Manale 2003; Smith and Lengefeld 2020).
Driven by risk and cost reduction as well as energy security concerns, and often publicly framed as climate mitigation efforts, the militaries of many nations increasingly focus on enhanced fossil fuel efficiency and the growing use of renewable forms of energy (Bigger and Neimark 2017; Condliffe 2017; Light 2014; Samaras, Nuttall, and Bazilian 2019; USDOD 2020). However, the pursuit of carbon efficiencies and renewable energy is challenging. Militaries traditionally prioritize bigger and faster weapons and transportation systems to gain strategic and competitive advantages over geopolitical rivalries. Modern fighter planes, such as the F-15 and F-16, burn 1,500 to 1,700 gallons of fuel per hour, military helicopters consume approximately five gallons for each mile traveled, and non-nuclear aircraft carriers utilize close to 6,000 gallons of fuel per hour while in operation (Jorgenson and Clark 2016; Levy and Sidel 2007; Sanders 2009). Similar to what occurs in private- and other public-sector contexts (see Grant et al. 2020; Mazur 2013; Mitchell and York 2020; Simpson, Dunlap, and Fullerton 2019; Thombs 2018b), the energy required for militaries’ information technology systems could also involve contradictions and conflicts between increased carbon efficiency, the transition to sustainable energy sources, and overall growth as they become more capital-intensive and technologically focused (Alic et al. 2010; Samaras et al. 2019; Sohag et al. 2021).
Some nations’ militaries have made efforts to become more energy efficient and ecologically sustainable. However, military operations, training exercises, and related land holdings are often exempt from environmental regulations domestically and abroad (e.g., Kramer 2020; Light 2014; Lynch et al. 2017; Smith 2020; Wilcox 2007). A national security justification for such exemptions was articulated by the commander of a military base in response to a community’s concern about pollution and land degradation: “we are in the business of protecting the nation, not the environment” (Renner 1991:152). Scholars have noted the potential for militaries as actors in climate governance (Jayaram and Brisbois 2021), and a growing number of the world’s militaries consider climate change a “threat multiplier” to national security and international stability (Burnett and Mach 2021; Machlis and Hanson 2008; Marzec 2016; USDOD 2010; see also CNA 2007; IPCC 2007; Klare 2019). In spite of this, nations with larger and more powerful militaries are slow to ratify international climate agreements (Givens 2014). For the United States, President Biden’s Executive Order 14057, signed in late 2021, directs the U.S. government to reach 100 percent carbon-free electricity by 2030, net-zero emissions by 2050, and eliminate carbon pollution from federal buildings and vehicles, but exempts anything related to the U.S. military and national security. 3
How Militarization Amplifies the Effect of Economic Growth on Carbon Emissions
Throughout history, societies with larger and more technologically advanced militaries have utilized their coercive power in geopolitical contexts to secure and maintain access to energy and other natural resources (Tilly 1990; see also Beckley 2010; Black 2008; Boswell 1989; Boswell and Dixon 1990; Chase-Dunn 1998; Jorgenson and Clark 2009; Kentor 2000; Magdoff 1978; McNeill 1982; Podobnik 2006). 4 In the modern era, access to fossil fuels, often from distant places, facilitates carbon-polluting development for nations as they compete in regional and global economies (Brady, Beckfield, and Seeleib-Kaiser 2005; Brady, Beckfield, and Zhao 2007; Mahutga 2006; Thombs 2018a). National militaries propel these socio-environmental processes through attempts to sustain relative international stability (Cooley, Nexon, and Ward 2019; Hirst 2001). An absence of large-scale conflicts minimizes disruptions to global production and trade networks (Chase-Dunn, Kawano, and Brewer 2000; Kentor, Clark, and Jorgenson 2023), further contributing to fossil fuel consumption and economic growth (Clark and Mahutga 2013; Givens 2018; Mahutga and Smith 2011; Vesia et al. 2021).
According to Mills (1956:198), the importance and influence of the military increased through its “ascendancy” into the power elite from the Second World War to the present. The military “became enlarged and decisive to the shape of the entire economic structure,” and as a result, “the economic and the military have become structurally and deeply interrelated, as the economy has become a seemingly permanent war economy” (Mills 1956:215; see also Downey 2015). Others highlight the broader institutional interconnections between the military, the economy, and the state as the core of the military-industrial complex (e.g., Adams 1982; Hooks 1990; Siebold 2001; Staples 2000).
Rich sociological analyses indicate that the needs of the world’s militaries provide opportunities for a variety of old and emerging private-sector industries (e.g., Custers 2010; Hooks 1994; Hooks and Bloomquist 1992). National militaries facilitate scientific inquiry and technological innovation, and they shape production in the private sector while simultaneously acting as downstream consumers, both domestically and internationally, given the global market for armaments and military equipment (Smart 2016; Soeters 2018; see also Levine, Sen, and Smith 1994; Mills 1956; Schofer 2003; Thayer 1969; Turse 2008). Governments, especially in wealthier nations, provide research funding to develop and enhance military weapons systems. These systems include cutting-edge communication technologies and infrastructure for coordinating routine operations, strategic maneuvers, data collection, cybersecurity, and surveillance (Collins 1981; Foster and McChesney 2014; Shaw 1988; Wills 2017).
Research and development linked to the capital intensiveness and size of militaries increase the overall resource demands of this institution (Jorgenson et al. 2010; Kentor et al. 2012; Kentor and Kick 2008; Schnaiberg 1980). Efforts to maintain a strategic advantage generate a path dependency, constantly elevating the standard of military preparedness (Thee 1990; U.S. Army 1999). For example, risk-transfer militarism involves the development by private-sector military contractors of high-tech air and undersea vehicles, such as drones and “robot subs,” that can launch missiles at designated targets (Cypher 2022; O’Rourke 2021). While initially used by the most dominant militaries, as part of an ever-evolving arms race, such high-tech equipment is increasingly in demand for militaries throughout the world.
Overall, the interrelated activities embedded within the military-industrial complex include contracts for research, development, manufacturing, and servicing of weapons and their delivery systems, transportation vehicles, information technology, cybersecurity, communications equipment, and other infrastructural needs (Baran and Sweezy 1966; Block 1980; Foster and McChesney 2014). Each of the nodes and links in these production systems, supply chains, and ancillary services involves the burning of fossil fuels and the consumption of other resources, all of which are amplified by the size and capital intensiveness of nations’ militaries. In other words, the effects of economic growth on carbon emissions are shaped by both the capital intensiveness and size of nations’ militaries, and each likely increases the extent to which the other enlarges the effect of growth on carbon pollution.
Militaries minimize risk for industry, as they provide an assured market. They help “reduce towards zero the gap in time between profitable original production and profitable replacement” (Mumford 1963:93). Industry also benefits from the application of technologies, often initially designed for military purposes, to commercial products for global markets (Hooks 1990; McChesney 2013; Turse 2008). For instance, military spending spearheaded research and development for personal computers and networking technologies, giving rise to the internet and e-commerce (McQuaig and Brooks 2012; Newman 2002; Nowak 2011).
Militaries also provide a release valve for the economy, absorbing excess capacity tied to occurrences of carbon-polluting overproduction in the private sector, which helps reduce macroeconomic disruptions and stabilize overall economic growth (Cypher 2015; Griffin, Devine, and Wallace 1982). Law enforcement agencies and private security entities throughout the world are major clients for the defense industry, purchasing armored vehicles, weapons, communications systems, and other specialized equipment initially developed for nations’ military purposes (Avant 2005; Dunlap and Brock 2022; Krahmann 2010; Kraska 2007; Singer 2008; Swed and Crosbie 2019). Through the demand for services, fuel, and other resources, the presence of military bases and installations affects surrounding communities and regions, influencing their carbon-polluting economic activities and related environmental effects (Alvarez 2021; Correa and Simpson 2022; Durant 2007; Hooks 1994; Vine 2015; Wilcox 2007).
In summary, we argue that the complex and evolving arrangements among the world’s militaries and the private sector shape the relationship between national carbon emissions and economic growth. The effect of economic growth on emissions is likely greater for nations with larger and more capital-intensive militaries. As measures that capture these far-reaching and distinct characteristics of contemporary militarization, we posit that both military expenditures per soldier (i.e., capital intensiveness) and military participation rate (i.e., size) enlarge the effect of economic growth on nations’ carbon emissions. In particular, we argue that military participation rate increases the extent to which expenditures per solider amplifies the effect of growth on carbon pollution, and likewise, expenditures per solider increases the extent to which participation rate enlarges the effect of economic growth on emissions. We test our arguments with moderation analysis and multiple longitudinal modeling techniques, across unbalanced and balanced panel datasets of nations, for two measures of carbon dioxide emissions, and with counterfactual analysis. 5
Data and Methods
The Dataset
We maximize the use of available data. The overall panel dataset consists of 2,563 annual observations for 106 nations (24.2 mean, 9 minimum, and 27 maximum annual observations per nation) for 1990 to 2016. Due to missing data for the different measures, the samples vary across the estimated models, depending on which independent variables are included. The year 1990 is the earliest, and 2016 is the most recent year, in which some of the primary independent variables are currently available. Appendix Table A1 lists the number of observations for each nation in the overall dataset. We also estimate and report models where we restrict the dataset to nations with no missing data, which consists of perfectly balanced panels of 27 annual observations for 53 nations. All analyzed data are publicly available, and the overall panel dataset is available from the lead author upon request.
Dependent Variables
The primary dependent variable is carbon dioxide emissions per capita, which we obtained from the World Bank’s online World Development Indicators Database (World Bank 2022). These data, measured in metric tons per person, include emissions from the burning of fossil fuels and the manufacture of cement. 6 Per capita emissions is commonly used as a measure of international inequality in emissions as it quantifies how nations are disproportionately responsible on a per person basis for the amount of carbon emitted into the atmosphere from human activities (e.g., IPCC 2013; Royal Society and U.S. National Academy of Sciences 2020). Consistent with other sociological research (e.g., Jorgenson and Clark 2012; Longhofer and Jorgenson 2017; Thombs 2018a; Vesia et al. 2021), we also estimate models of total carbon dioxide emissions (measured in kilotons), which we report in the Appendix. Total emissions are analogous with the overall scale of emissions and are centrally relevant for climate mitigation concerns (IPCC 2013; Royal Society and U.S. National Academy of Sciences 2020).
Primary Independent Variables
The primary independent variables for this study include gross domestic product (GDP) per capita, military expenditures per soldier (MEPS), military participation rate (MPR), their two-way interactions (GDP per capita × MEPS, GDP per capita × MPR, MEPS × MPR), and most importantly, their three-way interaction: GDP per capita × MEPS × MPR (Jaccard and Turrisi 2003). For ease of interpretation, we calculate and use the grand mean-centered versions for these three variables in the reported models that include their interactions. 7
GDP per capita is measured in constant 2010 U.S. dollars. Military expenditures per soldier is calculated by dividing total military expenditures by total armed forces personnel. Military participation rate is measured as armed forces personnel as a percent of total labor force. Military expenditures per soldier quantifies the capital intensiveness of nations’ militaries, and military participation rate measures the relative size of nations’ militaries (see Carlton-Ford et al. 2019; Jorgenson and Clark 2009; Jorgenson at al. 2010; Kentor et al. 2012; Kentor and Kick 2008; Kick et al. 1998; Lengefeld and Smith 2013; Smith and Lengefeld 2020). For the overall dataset, they are weakly correlated at –.11 in their original metrics and .01 in logarithmic form.
Total military expenditures are measured in constant 2018 U.S. dollars and obtained from Stockholm International Peace Research Institute’s online Military Expenditure Database (SIPRI 2022). These data include expenditures on personnel, operations and maintenance, procurement, military research and development, military infrastructure spending (including military bases), and military aid (in the military expenditure of the donor country). They exclude civil defense and current expenditures on previous military activities, demobilization, conversion, and weapon destruction. Armed forces personnel consist of active-duty military personnel, including paramilitary forces if the training, organization, equipment, and control suggest they may be used to support or replace regular military forces. Measures of GDP per capita, total armed forces personnel, and military participation rate come from the World Bank (2022).
Additional Independent Variables
The reported models include a variety of additional independent variables common in sociological research on the human drivers of carbon emissions (Dietz at al. 2020; Rosa and Dietz 2012). Each model includes urban population as a percent of the total population, non-dependent population (percent of the total population age 15 to 64), and services as a percent of GDP, all obtained from the World Bank (2022). Prior studies generally find that both urban population and non-dependent population are positively associated with emissions, and services as percent of GDP is negatively associated with carbon pollution. 8
Additional models include trade as percent of GDP, also obtained from the World Bank (2022), and level of democratization in the form of the institutionalized democracy index, an additive 11-point scale (with higher values meaning greater levels of democracy), which we obtained from the Center for Systemic Peace and Societal-Systems Research (2018). Total population, which counts all residents regardless of legal status or citizenship, is included in the models of total carbon emissions. These data come from the World Bank (2022).
To further enhance the validity of the hypotheses testing, we estimate models that also control for military expenditures as a percent of general government expenditures. This additional variable, which we obtained from the World Bank (2022), is moderately correlated with military participation rate (.513) and weakly correlated with military expenditures per soldier (.074).
Model Estimation Techniques
We estimate and report two-way fixed-effects regression models with robust standard errors clustered by nation, correcting for unobserved heterogeneity that is time-invariant within nations as well as cross-sectionally invariant within years. We estimate the models with the xtreg command in Stata software, which uses the within estimator to account for the country-level fixed effects, and the temporal fixed effects are derived from the inclusion of year-specific dummy variables. Consistent with the majority of sociological research on the anthropogenic drivers of national emissions (see Jorgenson et al. 2019; Rosa and Dietz 2012), we transform all nonbinary variables into logarithmic form. This means the models estimate elasticity coefficients where the coefficient for the independent variable is the estimated net percentage change in the dependent variable associated with a 1 percent increase in the independent variable. Appendix Table A2 provides descriptive statistics for the substantive variables included in the study. All variable transformation information and the Stata code used to estimate the reported models are available from the lead author upon request.
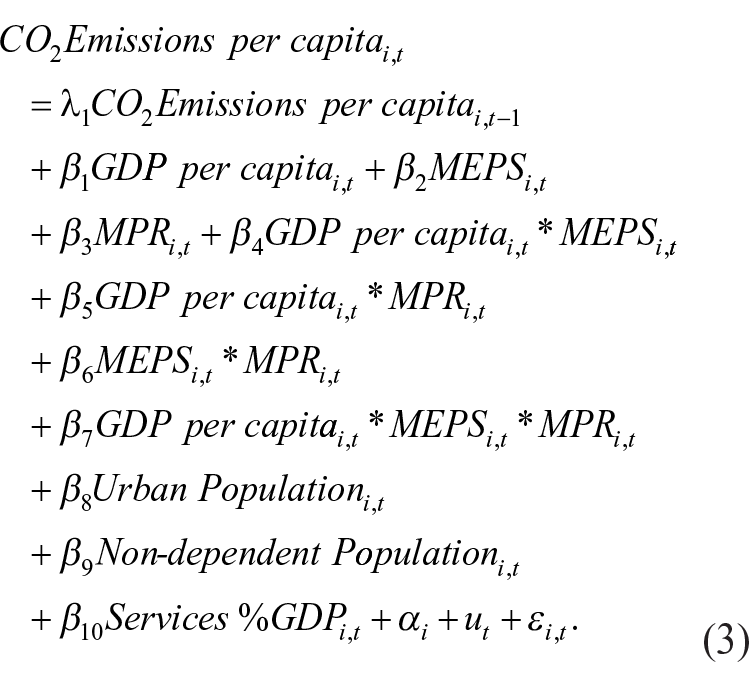
The baseline model we estimate for per capita emissions is as follows: 9
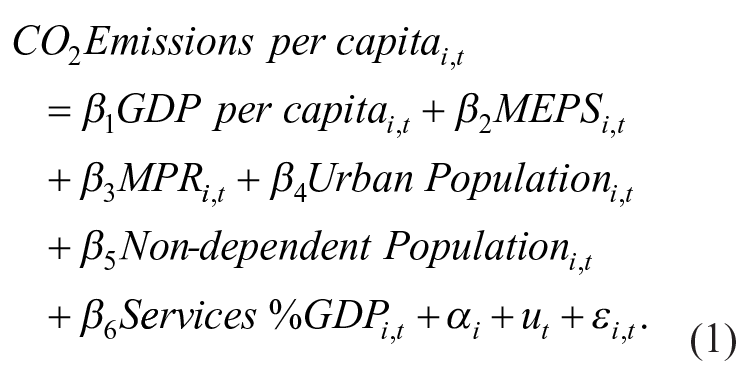
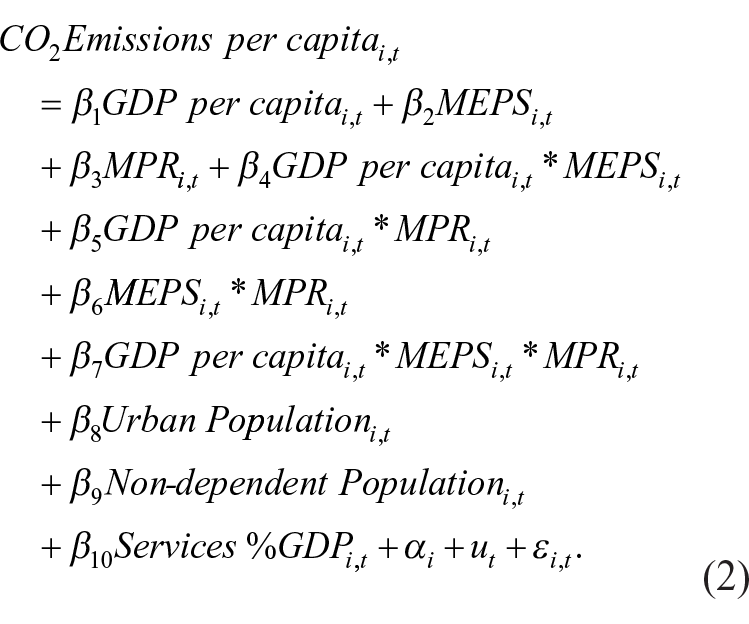
The baseline model with the inclusion of the three-way interaction is as follows:
Results
Table 1 reports five models of per capita carbon emissions. Model 1 is the initial baseline, consisting of GDP per capita, military expenditures per soldier (MEPS), and military participation rate (MPR), as well as urban population, non-dependent population, and services as percent of GDP. Model 2 introduces each of the two-way interactions for GDP per capita, MEPS, and MPR. Models 3 through 5 include their three-way interaction, with Model 3 for the overall panel dataset of 106 nations and Model 4 for the perfectly balanced panel dataset reduced to 53 nations. Model 5 is for the overall dataset, and also controls for trade as percent of GDP, democratization, and military expenditures as percent of government expenditures. For ease of interpretation, we exclude the estimated coefficients for these three additional controls in Table 1 (all not statistically significant), but they are provided in Appendix Table A3.
Elasticity Coefficients for the Regression of Carbon Emissions per Capita, 1990 to 2016
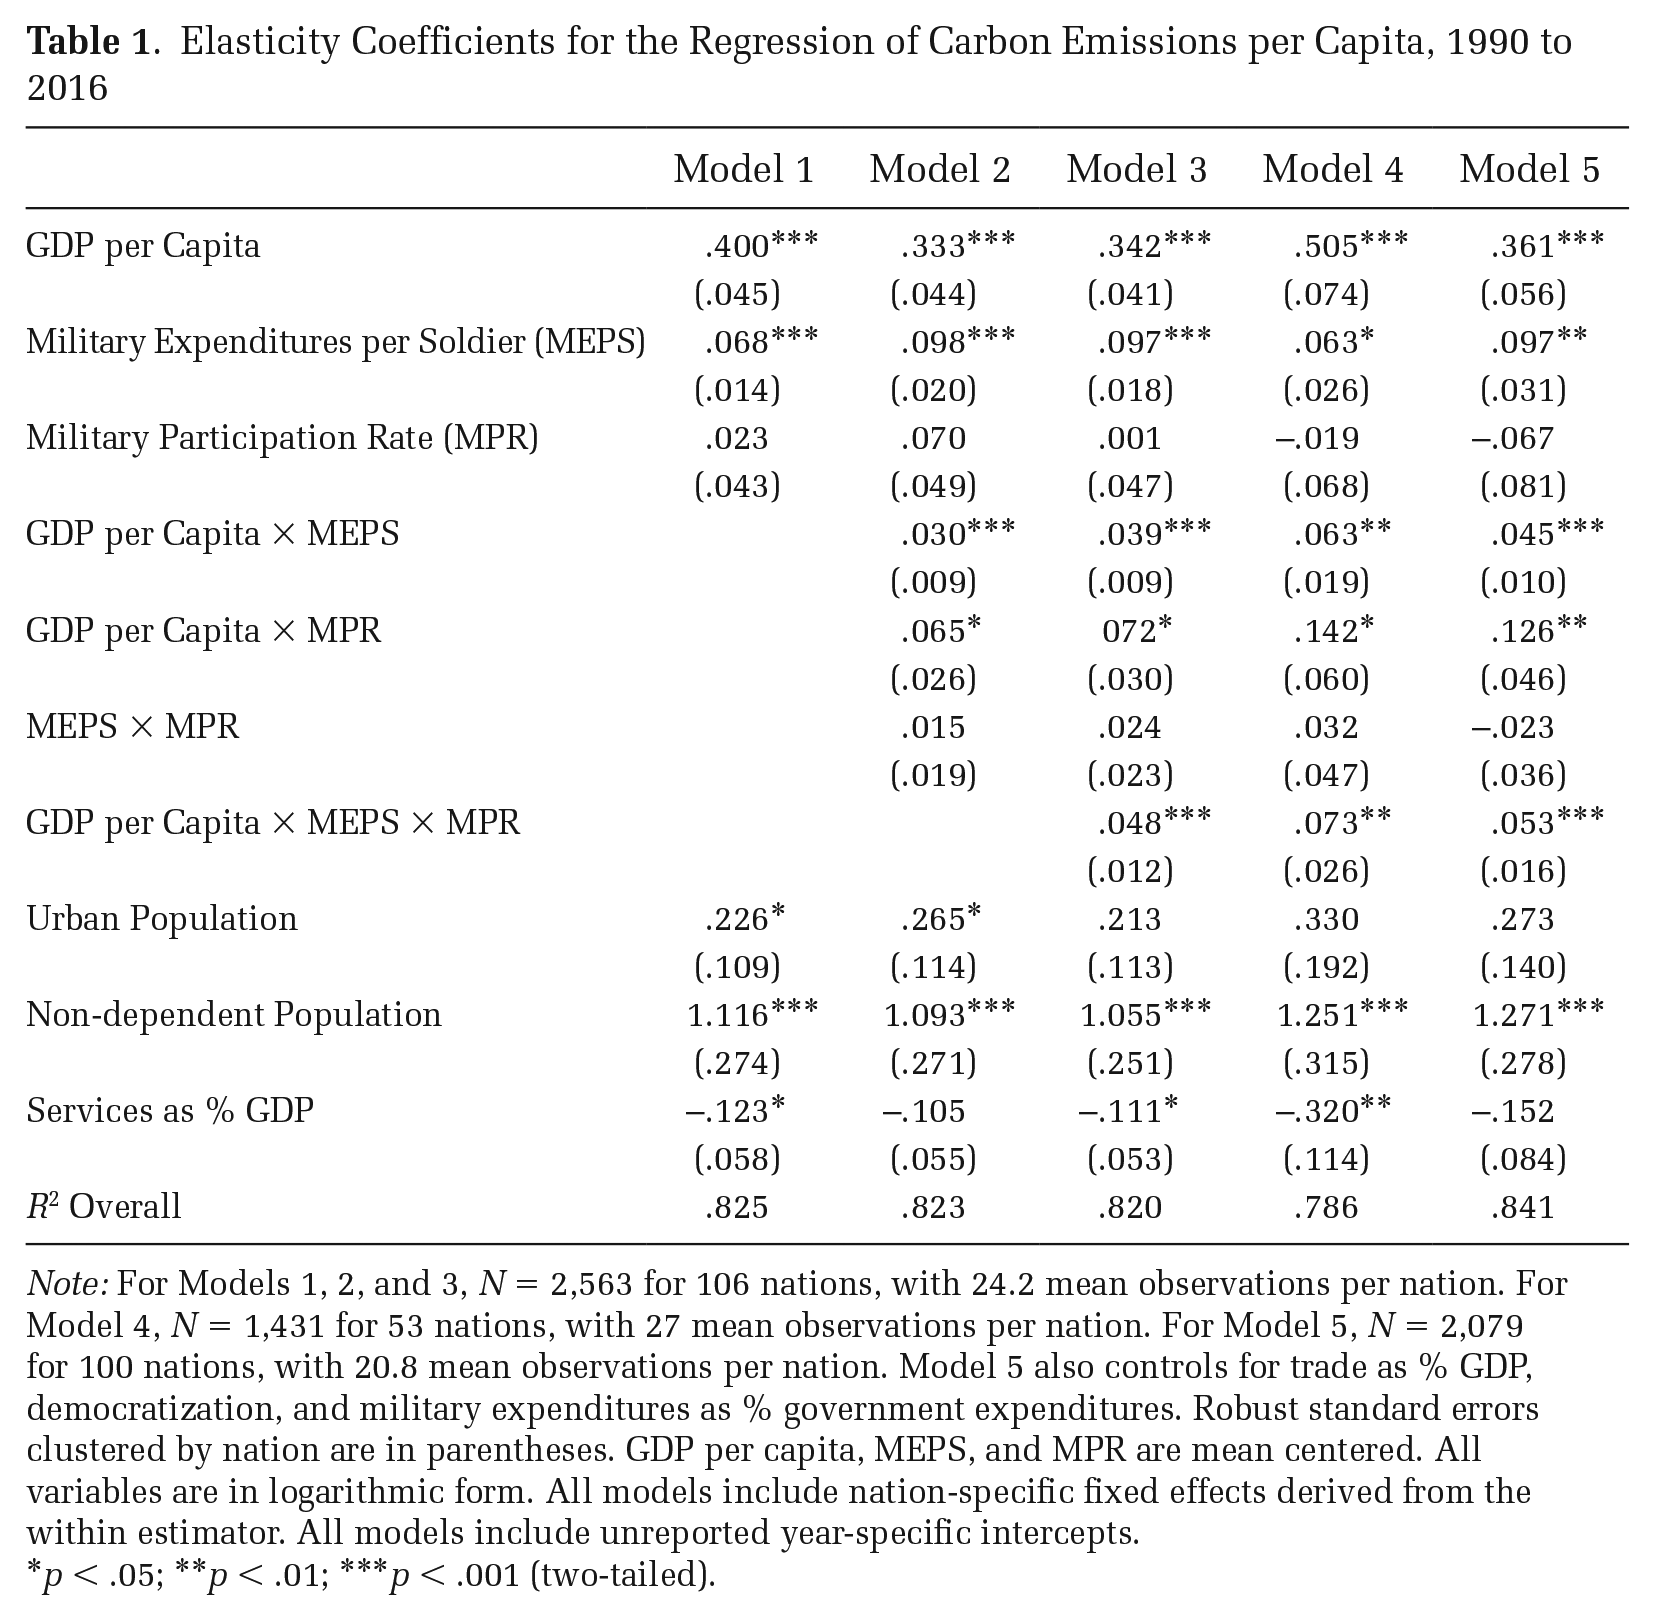
Note: For Models 1, 2, and 3, N = 2,563 for 106 nations, with 24.2 mean observations per nation. For Model 4, N = 1,431 for 53 nations, with 27 mean observations per nation. For Model 5, N = 2,079 for 100 nations, with 20.8 mean observations per nation. Model 5 also controls for trade as % GDP, democratization, and military expenditures as % government expenditures. Robust standard errors clustered by nation are in parentheses. GDP per capita, MEPS, and MPR are mean centered. All variables are in logarithmic form. All models include nation-specific fixed effects derived from the within estimator. All models include unreported year-specific intercepts.
p < .05; **p < .01; ***p < .001 (two-tailed).
Model 1 indicates that per capita emissions is positively associated with GDP per capita and MEPS, and the effect of MPR is not statistically significant. 10 In Model 2, the estimated coefficients for GDP per capita × MEPS and GDP per capita × MPR are positive, whereas the coefficient for MEPS × MPR is not statistically significant. The estimated coefficient for the three-way interaction, GDP per capita × MEPS × MPR, is positive and statistically significant in Models 3 through 5. The estimated effect of non-dependent population on per capita emissions is positive across all five models, the effect of services as percent of GDP is negative in all but the second and fifth models, and the effect of urban population is positive and statistically significant in the first two models. The results, particularly the significant coefficient for GDP per capita × MEPS × MPR, confirm our arguments. 11
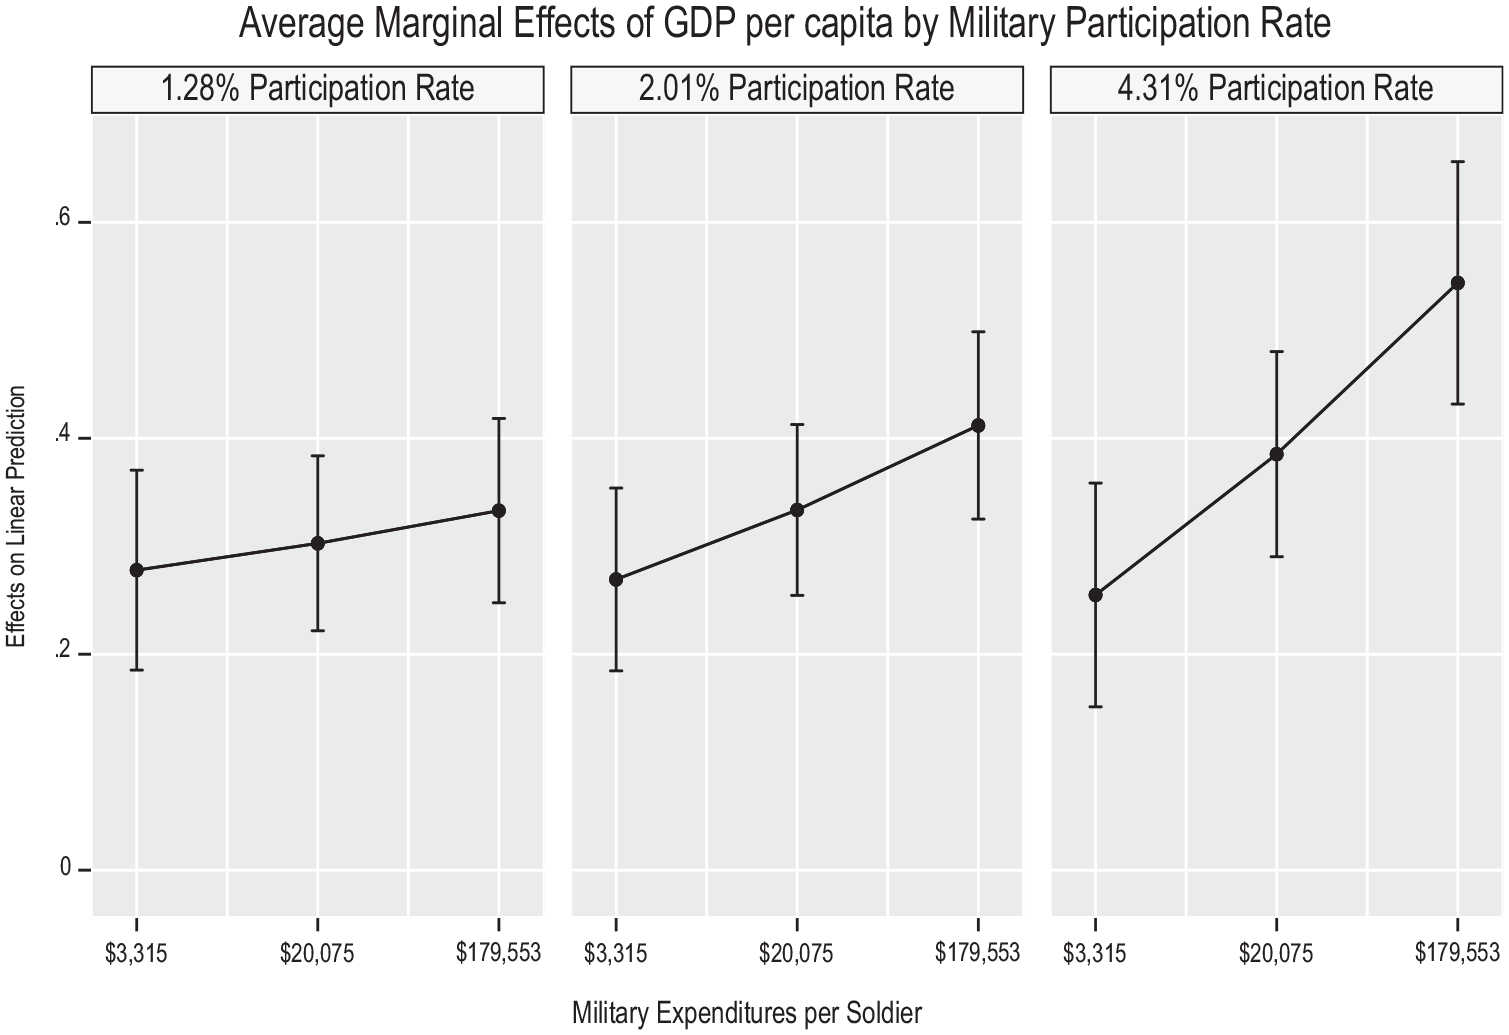
To provide a more nuanced assessment and clearer interpretation of the three-way interaction, Figures 1 and 2 plot the average marginal effects, with 95 percent confidence intervals (95 percent CI), of GDP per capita by MEPS and MPR. The estimates are based on Model 3 in Table 1, which we generate using Stata’s margins command. Although the 95 percent confidence intervals of the estimates overlap for most of the marginal effects, the differences between the point estimates for the marginal effects are statistically significant unless noted otherwise. 12
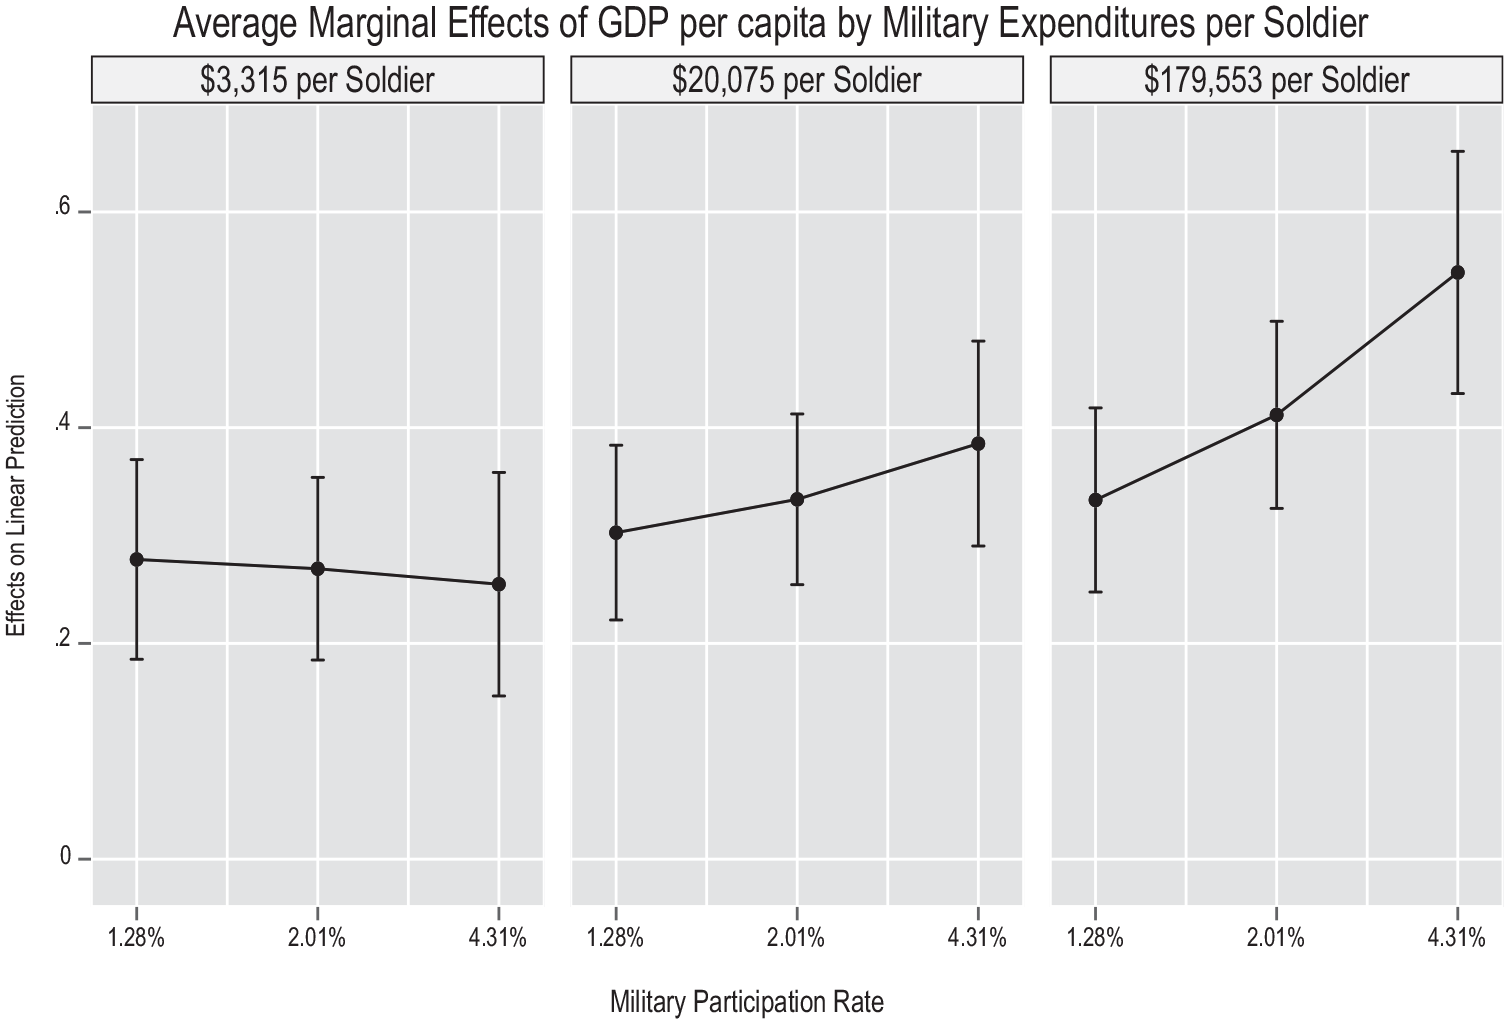
Marginal Effects of GDP per Capita for Model of CO2 Emissions per Capita by Military Expenditures per Soldier
Marginal Effects of GDP per Capita for Model of CO2 Emissions per Capita by Military Participation Rate
Figure 1 reports the marginal effect of GDP per capita on per capita emissions at the 10th, 50th, and 90th percentiles of MEPS across levels of MPR. The marginal effect of GDP per capita at each percentile of MEPS increases across the MPR distribution, with the exception of the 10th percentile of MEPS ($3,315). The effects in this case are statistically equivalent across the MPR distribution, ranging from .278 (95 percent CI = .185 to .370) at the 10th percentile of MPR to .255 (95 percent CI = .151 to .359) at the 90th percentile of MPR. At the 50th percentile of MEPS ($20,075), the effect of GDP per capita on emissions ranges from .303 (95 percent CI = .222 to .384) at the 10th percentile of MPR (1.28 percent) to .385 (95 percent CI = .290 to .480) at the 90th percentile of MPR (4.31 percent). At the 90th percentile of MEPS ($179,553), the effect of GDP per capita ranges from .333 (95 percent CI = .248 to .418) at the 10th percentile of MPR (1.28 percent) to .544 (95 percent CI = .432 to .656) at the 90th percentile of MPR (4.31 percent).
Figure 2 provides the marginal effect of GDP per capita on per capita carbon emissions at the 10th, 50th, and 90th percentiles of MPR across levels of MEPS. Like in Figure 1, the marginal effect of GDP per capita at each percentile of MPR increases across the MEPS distribution, with the exception of the 10th percentile of MPR (1.28 percent). The statistically equivalent effects in this case range from .277 (95 percent CI = .185 to .370) at the 10th percentile of MEPS to .333 (95 percent CI = .248 to .418) at the 90th percentile of MEPS. At the 50th percentile of MPR (2.01 percent), the effect of GDP per capita on emissions ranges from .269 (95 percent CI = .185 to .354) at the 10th percentile of MEPS ($3,315) to .412 (95 percent CI = .325 to .499) at the 90th percentile of MEPS ($179,553). At the 90th percentile of MPR (4.31 percent), the effect of GDP per capita ranges from .255 (95 percent CI = .151 to .359) at the 10th percentile of MEPS ($3,315) to .544 (95 percent CI = .432 to .656) at the 90th percentile of MEPS ($179,553).
Additional Models
To further broaden the testing of the three-way interaction, we estimate models for per capita emissions and total emissions that include additional controls, which we report in Appendix Table A6. First, we estimate models that control for renewable energy consumption. 13 Next, we control for arms exports. Due to their unavailability for many nations, including arms exports greatly reduces the overall sample. 14 Finally, we estimate models that control for oil production. The oil production data are also limited to a relatively small number of nations. 15 Across each model of emissions, the estimated coefficient for GDP per capita × MEPS × MPR is positive and statistically significant. As expected, the estimated effect of renewable energy consumption is negative and statistically significant. The estimated effects of arms exports and oil production are not statistically significant.
To determine if other national military measures moderate the effect of economic growth on emissions, we estimate models that include the two-way interaction between GDP per capita and military expenditures as percent of government expenditures. As noted in the Data and Methods section, this military measure is moderately correlated with MPR and weakly correlated with MEPS. The models are reported in Appendix Table A7 and indicate that the estimated effect of the two-way interaction on both per capita emissions and total emissions is not statistically significant. These findings further validate our focus on military expenditures per solider and military participation rate as far-reaching and distinct characteristics of militarization that shape the effect of economic growth on nations’ carbon pollution. 16
Robustness Checks and Sensitivity Analyses
An interaction in fixed-effects regression is usually specified by demeaning the product term. Giesselmann and Schmidt-Catran (2022) show that demeaning the product between time-varying variables may not produce a true within-unit estimate because it incorporates between-unit differences. They propose using the double-demeaned estimator, which gives unbiased results but is inefficient compared to the fixed-effects estimator. 17 They suggest using a Hausman test to decide which estimator is more appropriate. If the estimators produce statistically identical estimates, then the standard fixed-effects estimator should be used. As a robustness check, we perform the double-demeaned estimator and extend it using a seemingly unrelated regression framework. 18 This has two advantages over using a Hausman test. First, it allows for robust standard errors, which the Hausman test does not. Second, it allows us to use a simple Wald test to assess whether the coefficient on the three-way interaction of interest is statistically different across the two models. In contrast, the Hausman test assesses the equality of two estimators instead of individual coefficients. We perform this approach for Model 3 in Table 1, combining the results of the two estimators using the suest command in Stata. The Wald test produces a chi-square test statistic of .16, which fails to reject the null hypothesis that the estimates are statistically equivalent (p-value = .69). We therefore rely on the fixed-effects estimates of the three-way interaction in the reported analyses.
A possible limitation of using year-specific fixed effects is that they assume time-specific shocks homogeneously affect each case in the dataset, meaning they may not adequately model the cross-sectional dependence, potentially leading to biased and inconsistent results. Accordingly, we use Pesaran’s test for weak cross-sectional dependence to assess whether the year-specific fixed effects eliminate the strong cross-sectional dependence from our reported models. The cross-sectional dependence test statistics of the residuals are not statistically significant, meaning there is no strong cross-sectional dependence, and the reported two-way fixed-effects models are unlikely biased or inconsistent in this way (Thombs 2022). 19
Panel data are often autoregressive, meaning the data tend to be correlated over time, and excluding the lag of the dependent variable from the model will result in omitted variable bias if the outcome variable is truly a function of their past value (Pickup 2015). Therefore, as robustness checks, we estimate two-way fixed-effects dynamic models for both per capita emissions and total emissions, with a focus on the coefficient for the three-way interaction.
For per capita emissions, this model is as follows: 20
There are potential issues to consider regarding fixed-effects estimation of a dynamic model. First, estimating dynamic panel models can produce the “Nickell bias” (Nickell 1981). The bias stems from the correlation between the lagged dependent variable and the error term, a product of the demeaning process of fixed-effects estimation. However, this bias tends to lessen as T increases (Hsiao, Pesaran, and Tahmiscioglu 2002; Thombs 2022). Second, fixed-effects estimation of a dynamic model with slope heterogeneity can lead to inconsistent and misleading estimates (Pesaran and Smith 1995; Thombs, Huang, and Fitzgerald 2022).
To address these concerns and to model cross-sectional dependence in alternative ways, we also estimate models with the common correlated effects (CCE) estimator (Ditzen 2018; Pesaran 2006) and the instrumental-variable estimation approach with common factors (Norkutė et al. 2021). The CCE estimator assumes the cross-sectional dependence is due to unobserved, time-varying, common factors that affect each case differently. It approximates the common factors by adding cross-sectional averages to the model and estimates a factor loading for each case in the analysis (Pesaran 2006). We use the pooled version of the CCE because the relatively short time span prevents us from estimating a time-series regression on each individual nation (Thombs 2022).
A limitation of using the pooled version is that it does not account for the potential issue of slope heterogeneity. We test for this using the instrumental-variable approach, a two-stage procedure that works by eliminating the common factors in the covariates using principal component analysis in stage one, and obtains consistent estimates using defactored covariates as instruments (Norkutė et al. 2021). In stage two, the whole model is defactored using the residuals from stage one, and instrumental-variable estimation is performed using the same instruments from the first stage (Kripfganz and Sarafidis 2021). 21 This estimation technique is robust to Nickell bias, and we test the effect of slope heterogeneity on the model with the Hansen test of overidentifying restrictions (J-statistic). 22
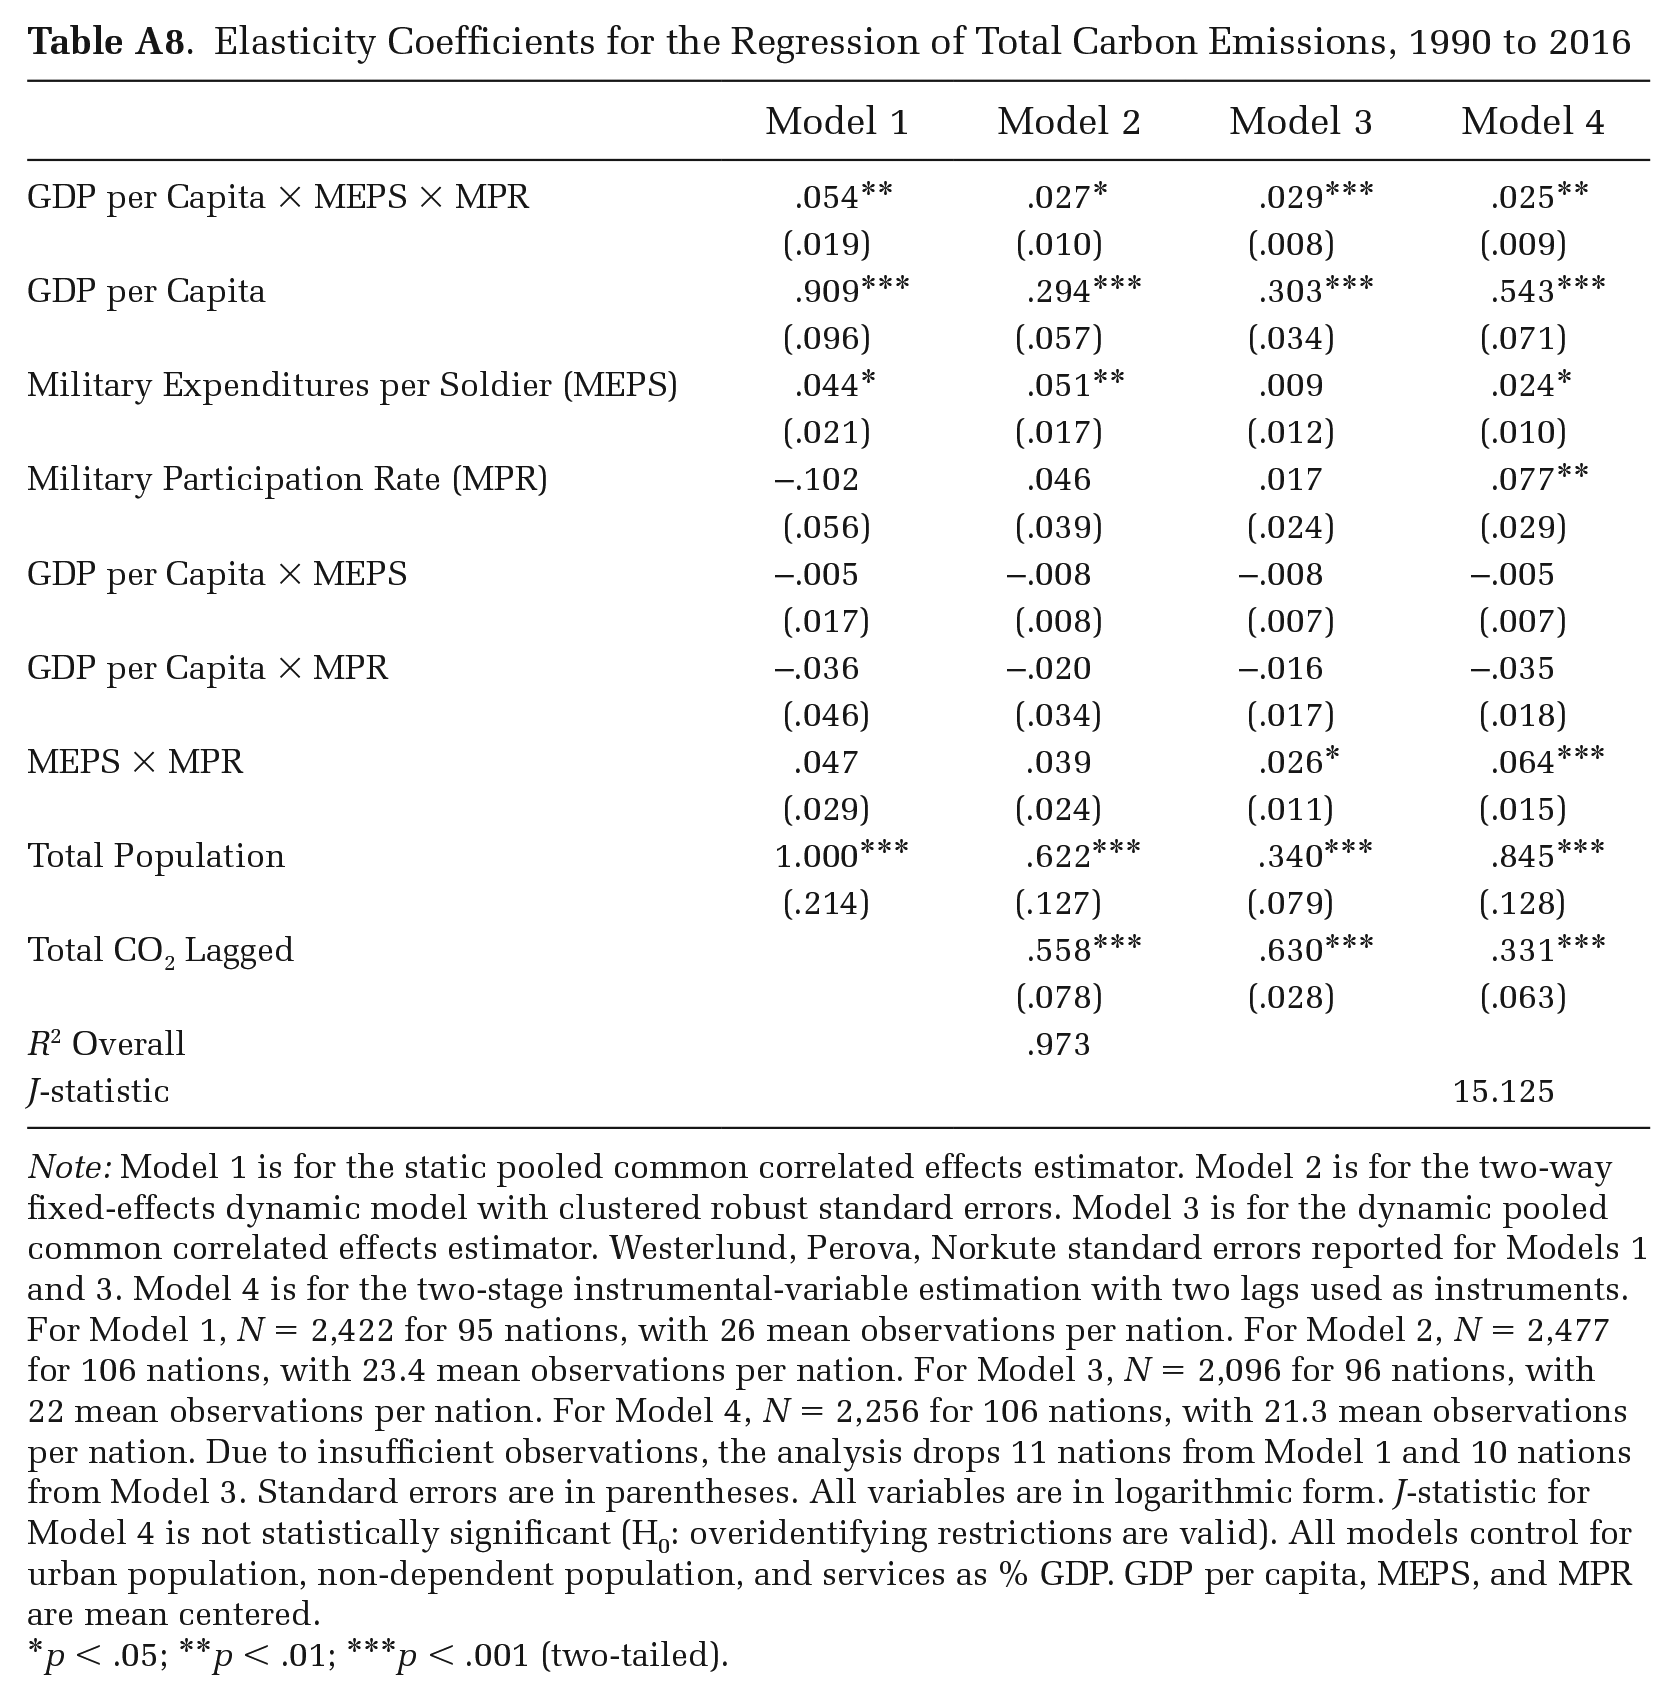
Table 2 reports the estimates of the four robustness check models for per capita emissions. Appendix Table A8 reports the same sequence of estimated models for total carbon emissions. Model 1 is for the static pooled common correlated effects estimator, and the remaining three are dynamic models and thus include the lagged dependent variable. Model 2 is for the two-way fixed-effects dynamic model, Model 3 is for the dynamic pooled common correlated effects estimator, and Model 4 is for the two-stage instrumental-variable estimator.
Elasticity Coefficients for the Regression of Carbon Emissions per Capita, 1990 to 2016
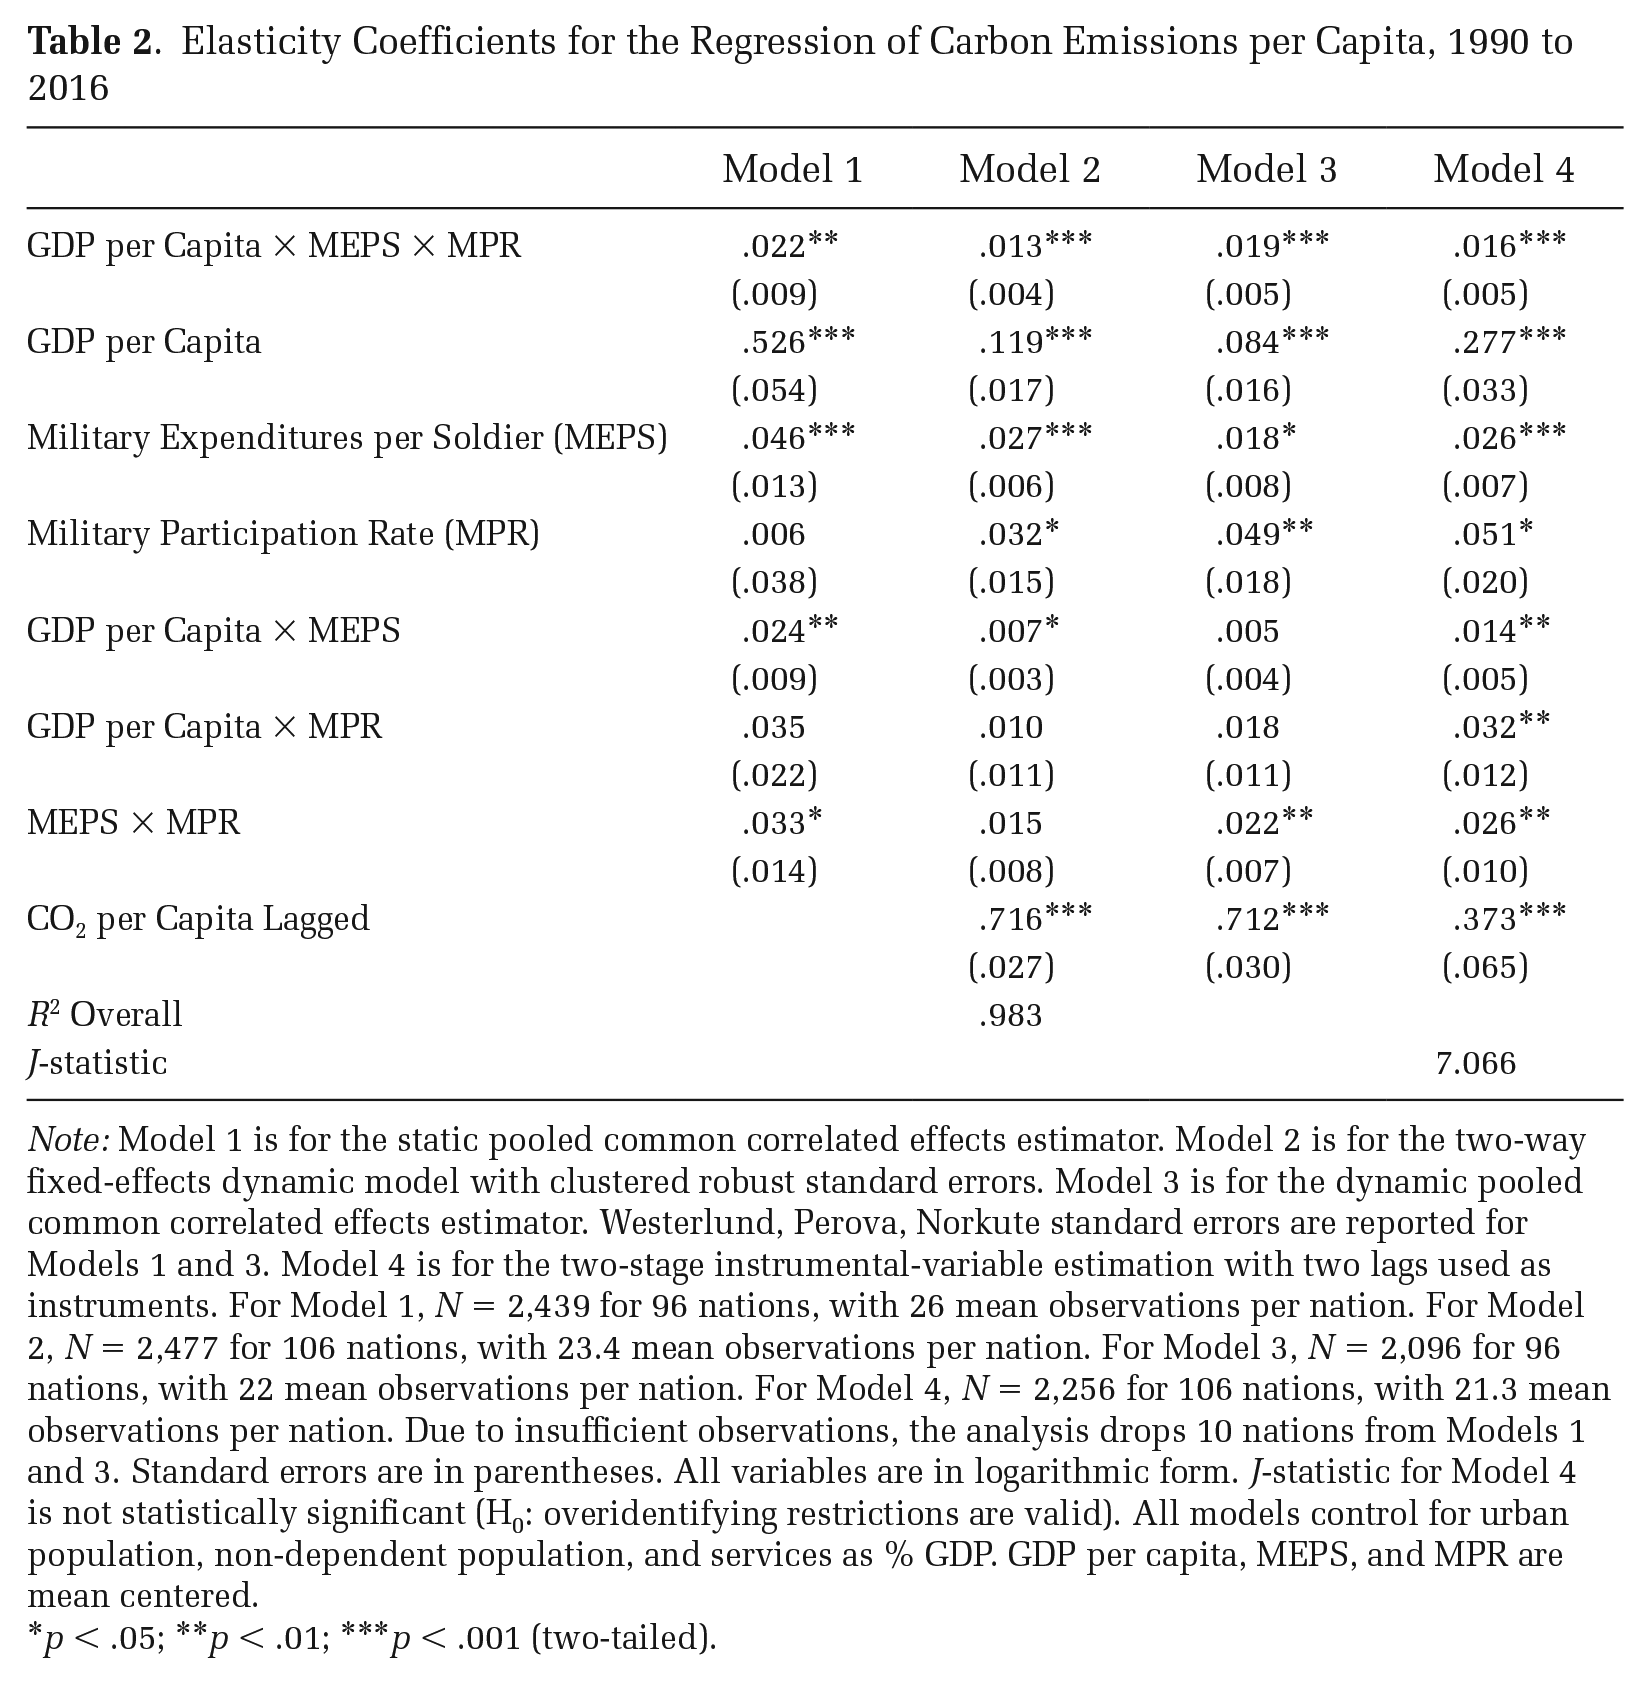
Note: Model 1 is for the static pooled common correlated effects estimator. Model 2 is for the two-way fixed-effects dynamic model with clustered robust standard errors. Model 3 is for the dynamic pooled common correlated effects estimator. Westerlund, Perova, Norkute standard errors are reported for Models 1 and 3. Model 4 is for the two-stage instrumental-variable estimation with two lags used as instruments. For Model 1, N = 2,439 for 96 nations, with 26 mean observations per nation. For Model 2, N = 2,477 for 106 nations, with 23.4 mean observations per nation. For Model 3, N = 2,096 for 96 nations, with 22 mean observations per nation. For Model 4, N = 2,256 for 106 nations, with 21.3 mean observations per nation. Due to insufficient observations, the analysis drops 10 nations from Models 1 and 3. Standard errors are in parentheses. All variables are in logarithmic form. J-statistic for Model 4 is not statistically significant (H0: overidentifying restrictions are valid). All models control for urban population, non-dependent population, and services as % GDP. GDP per capita, MEPS, and MPR are mean centered.
p < .05; **p < .01; ***p < .001 (two-tailed).
The estimated coefficient for GDP per capita × MEPS × MPR is positive and statistically significant in each model, regardless of estimator type. The lagged dependent variable has a positive effect in each dynamic model, and the J-statistic is not statistically significant in the two-stage instrumental-variable models. Overall, the findings of interest for this study appear robust to a variety of potential modeling concerns.
Finally, to determine if the analyses and findings are sensitive to any particular nations included in the study, we re-estimate each reported model where we systematically exclude, one at a time, each of the 106 nations in the overall dataset. The results indicate that none of the included nations are overly influential: the estimated elasticity coefficients for the three-way interaction across all re-estimated models are positive and statistically significant. The estimated coefficients for the other independent variables remain consistent as well.
Counterfactual Analysis and Substantive Significance
Having demonstrated that our results are robust to a host of modeling considerations and not sensitive to sample characteristics, we now turn to the question of substantive significance. Here we ask how the moderating effect of militarization matters for observed levels of carbon emissions per capita. In particular, we use Model 3 of Table 1 to engage in a counterfactual history exercise under two scenarios for the overall dataset. First, we ask what average emissions per capita would look like if every nation in the sample had military expenditures per soldier and military participation rates equal to that observed at the 90th percentile of the nation-year distribution. Second, we ask what average emissions per capita would look like if every nation in the sample instead had military expenditures per soldier and military participation rates equal to that observed at the 10th percentile of the nation-year distribution.
Figure 3 reports the yearly average per capita carbon emissions under each of these scenarios, as well as the observed average per capita emissions per year. Consistent with our overall intervention, there is a wide gap between the observed emissions and those that would occur under militarization at the 10th and 90th percentiles. In 1990, observed average emissions are .705 metric tons per capita higher than that which would occur under militarization at the 10th percentile, and this gap grows to .899 metric tons per capita by 2016. Conversely, observed emissions are .459 metric tons per capita lower than what would occur with 90th percentile militarization. This gap grows to .984 metric tons per capita by 2016.
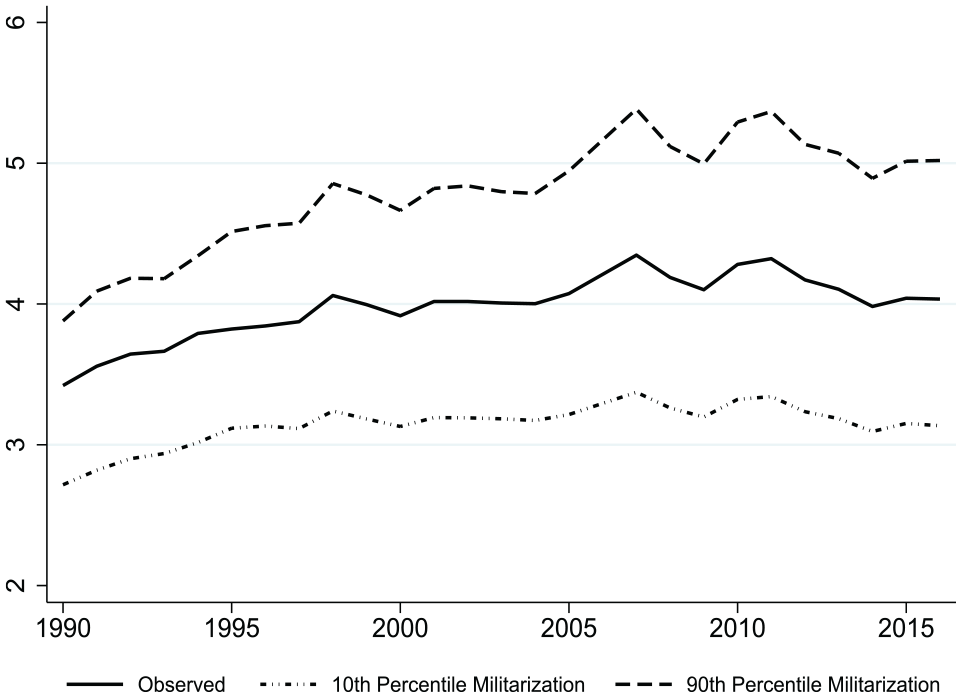
Average CO2 Emissions per Capita under Different Militarization Scenarios
The growth rate for emissions also varies considerably under these scenarios. Observed average per capita emissions grew by .614 metric tons over the entire period. This number falls to .419 metric tons in a world of 10th percentile militarization, and the increase rises to 1.14 metric tons in a world of 90th percentile militarization. Holding rates of economic growth fixed, worldwide reductions in the capital intensiveness and size of militarization could produce substantial declines in carbon emissions.
Discussion and Conclusions
This study makes significant contributions to sociological work on climate change and the climate crisis. Bridging multiple subfields, including environmental sociology, the sociology of development, global political economy, historical sociology, and political sociology, we argue that militarization moderates the effect of economic growth on nations’ carbon emissions. Many of the world’s national militaries are increasingly capital intensive, with a focus on the development of longer-range weapons, transportation, and communications systems, and larger militaries possess expansive built infrastructures that require considerable amounts of energy and material goods. We use military expenditures per soldier and military participation rate to measure these far-reaching characteristics of contemporary militarization.
The findings for the longitudinal analyses provide substantial support for our arguments. Both military expenditures per solider and military participation rate enlarge the positive effect of economic growth on national carbon emissions. We observe these relationships through modeling the two-way interactions for growth, measured as GDP per capita, and each military measure. More importantly, through modeling their three-way interaction, we find that each militarization attribute increases the extent to which the other amplifies the effect of economic growth on carbon pollution. The effect of GDP per capita on emissions is larger at higher levels of expenditures per solider, and this increases across the distribution of military participation rate. Likewise, the effect of GDP per capita on carbon pollution is larger at higher levels of military participation rate, and this increases across the distribution of military expenditures per solider. The results are robust for per capita emissions and total emissions, various sensitivity analyses, a range of balanced and unbalanced panel datasets, and across multiple model specifications. Their substantive significance is further highlighted through counterfactual analysis.
Our findings speak to the deep connections between the military and the economy at the core of the military-industrial complex. National militaries help secure access to fossil fuels and other resources, and generally attempt to maintain geopolitical and world-economic stability, which enables carbon-intensive economic growth. At the same time, militaries spur scientific research and technological advances, and they influence production in the defense industry and private sector in general, while also serving as major consumers of these items. The technologies and other goods initially developed by industry for military purposes are often sold to private security firms and law enforcement agencies, and transformed into commercial products for domestic and global markets. Military bases and installations routinely obtain fuel as well as various material goods and services from business entities. These structural conditions, institutional relationships, and underlying processes all contribute to how the capital intensiveness and scale of militaries shape the association between national emissions and economic growth.
Anthropogenic climate change increases the likelihood of large-scale conflicts between and within nations (Alario, Nath, and Carlton-Ford 2016; Cane et al. 2014; Giddens 2011; Hsiang, Burke, and Miguel 2013; Mach et al. 2019). This expands and intensifies military activities for nations involved in international and domestic engagements (Belcher, Bigger, et al. 2020; Pathak 2020; Raleigh and Urdal 2007; Smith and Lengefeld 2020), further driving the material- and energy-intensive production of weapons systems and munitions, vehicles, communications equipment, and other related goods in the defense industry and private sector more broadly (Isiksal 2021; Jorgenson and Clark 2016). Thus, as a threat multiplier, anthropogenic climate change could facilitate a greater occurrence of both domestic and international conflicts, further propelling the relationships between national carbon emissions, economic growth, and militarization.
Our theoretical arguments and empirical findings highlight the value and necessity of considering the world’s militaries in sociological research. The work of historical sociologists maps out in great detail the emergence of nation-states from a coalescence of coercive power with economic power. Inspired by this rich body of scholarship, we concentrate on the environmental effects of economy and military relationships for nations in the modern era. The present study focuses on human drivers of climate change, but contemporary forms of militarization likely shape the effect of economic growth on social and other environmental outcomes in ways similar to and distinct from how it influences the association between carbon pollution and economic growth.
The characteristics of national militaries also likely influence how macrostructural factors and processes besides economic growth affect a range of social and environmental outcomes. Like others (e.g., Andreski 1968; Giddens 1987; Hooks 1990; Kentor and Kick 2008), we suggest the military is routinely overlooked by scholars across the discipline. We hope this study will encourage sociologists to consider the military and militarization in future analytic frameworks and empirical analyses. The ongoing growth of militarism underscores the importance in doing so. From 1990 to 2016, global military expenditures increased by 29 percent (1.372 to 1.774 trillion constant 2018 U.S. dollars), armed forces personnel for the world grew by 15 percent (23.918 to 27.542 million personnel), and global military expenditures per solider increased by 12 percent (57,362 to 64,410 constant 2018 U.S. dollars). 23
Like all research, this study has limitations that can hopefully be addressed in future analyses. Although the overall sample covers the majority of the world’s population, current data availability limits the number of nations included in the cross-national analyses. Data availability also restricts the temporality of the study to slightly over a quarter century, from 1990 to 2016. Thus, our analyses focus on the modeling of relatively contemporaneous relationships observed for recent decades. While we use the best publicly available aggregate data on national-level militarization characteristics, these data might be underestimated for some country-years due to accounting practices and the overall classified nature of military-related information. Consequently, the reported findings may underestimate the direct association between national-level emissions and militarization, as well as the extent to which the capital intensiveness and size of militarization enlarge the effect of economic growth on carbon pollution.
In conclusion, this study significantly advances the sociological research on climate change, and enhances sociological contributions to interdisciplinary work on planetary warming and other global sustainability challenges. Militaries exert a substantial influence on the production and consumption patterns of economies, as well as the environmental demands required to support their evolving infrastructure. Our findings indicate that two major characteristics of militarization enlarge the effect of economic growth on carbon emissions, and they increase the extent to which the other amplifies the effect of growth on nations’ carbon pollution. By theorizing about these structural relationships and bridging multiple subfields, we push forward the foundational sociological literature concerning the effect of economic growth on the environment.
Footnotes
Appendix
Elasticity Coefficients for the Regression of Total Carbon Emissions, 1990 to 2016
| Model 1 | Model 2 | Model 3 | Model 4 | |
|---|---|---|---|---|
| GDP per Capita × MEPS × MPR | .054** | .027* | .029*** | .025** |
| (.019) | (.010) | (.008) | (.009) | |
| GDP per Capita | .909*** | .294*** | .303*** | .543*** |
| (.096) | (.057) | (.034) | (.071) | |
| Military Expenditures per Soldier (MEPS) | .044* | .051** | .009 | .024* |
| (.021) | (.017) | (.012) | (.010) | |
| Military Participation Rate (MPR) | –.102 | .046 | .017 | .077** |
| (.056) | (.039) | (.024) | (.029) | |
| GDP per Capita × MEPS | –.005 | –.008 | –.008 | –.005 |
| (.017) | (.008) | (.007) | (.007) | |
| GDP per Capita × MPR | –.036 | –.020 | –.016 | –.035 |
| (.046) | (.034) | (.017) | (.018) | |
| MEPS × MPR | .047 | .039 | .026* | .064*** |
| (.029) | (.024) | (.011) | (.015) | |
| Total Population | 1.000*** | .622*** | .340*** | .845*** |
| (.214) | (.127) | (.079) | (.128) | |
| Total CO2 Lagged | .558*** | .630*** | .331*** | |
| (.078) | (.028) | (.063) | ||
| R2 Overall | .973 | |||
| J-statistic | 15.125 |
Note: Model 1 is for the static pooled common correlated effects estimator. Model 2 is for the two-way fixed-effects dynamic model with clustered robust standard errors. Model 3 is for the dynamic pooled common correlated effects estimator. Westerlund, Perova, Norkute standard errors reported for Models 1 and 3. Model 4 is for the two-stage instrumental-variable estimation with two lags used as instruments. For Model 1, N = 2,422 for 95 nations, with 26 mean observations per nation. For Model 2, N = 2,477 for 106 nations, with 23.4 mean observations per nation. For Model 3, N = 2,096 for 96 nations, with 22 mean observations per nation. For Model 4, N = 2,256 for 106 nations, with 21.3 mean observations per nation. Due to insufficient observations, the analysis drops 11 nations from Model 1 and 10 nations from Model 3. Standard errors are in parentheses. All variables are in logarithmic form. J-statistic for Model 4 is not statistically significant (H0: overidentifying restrictions are valid). All models control for urban population, non-dependent population, and services as % GDP. GDP per capita, MEPS, and MPR are mean centered.
p < .05; **p < .01; ***p < .001 (two-tailed).
Acknowledgements
Prior versions of this paper were presented at the Center for Environmental Politics’ Duck Family Colloquium Series at the University of Washington, the Schiller Institute for Integrated Science and Society’s Climate Change Research Seminar Series, the Environmental Sociology Workshop at Boston College, the Department of Sociology at the University of British Columbia, and the conference on “Navigating Uncertain Futures: Social Engagement and Transformative Change in Global Socio-Ecological Systems,” co-hosted by the Environment and Society Research Committee of the International Sociological Association and the Section on Environmental Sociology of the American Sociological Association. The authors thank the participants for their helpful feedback. The authors also thank Wesley Longhofer, Ali Kadivar, Katrina Paxton, the editors of ASR, and the anonymous reviewers for their helpful comments and suggestions.