
Abstract
Although gender is central to contemporary accounts of educational stratification, sexuality has been largely invisible as a population-level axis of academic inequality. Taking advantage of major recent data expansions, the current study establishes sexuality as a core dimension of educational stratification in the United States. First, I analyze lesbian, gay, and bisexual (LGB) adults’ college completion rates: overall, by race/ethnicity, and by birth cohort. Then, using new data from the High School Longitudinal Survey of 2009, I analyze LGB students’ performance on a full range of achievement and attainment measures. Across analyses, I reveal two demographic facts. First, women’s rising academic advantages are largely confined to straight women: although lesbian women historically outpaced straight women, in contemporary cohorts, lesbian and bisexual women face significant academic disadvantages. Second, boys’ well-documented underperformance obscures one group with remarkably high levels of school success: gay boys. Given these facts, I propose that marginalization from hegemonic gender norms has important—but asymmetric—impacts on men’s and women’s academic success. To illustrate this point, I apply what I call a “gender predictive” approach, using supervised machine learning methods to uncover patterns of inequality otherwise obscured by the binary sex/gender measures typically available in population research.
The “rise of women” in education is among the central demographic transformations of the past half century. For every birth cohort since 1960, women have increasingly outpaced men in educational attainment (DiPrete and Buchmann 2013). Men still dominate popular perceptions of brilliance (Musto 2019) and maintain majorities in certain persistently segregated fields (Leslie et al. 2015). Overall, though, the “new gender gap” in education is defined primarily with reference to “boys’ notorious underperformance” (Legewie and DiPrete 2012:463). From kindergarten classrooms (DiPrete and Jennings 2012) through programs of doctoral study (England, Levine, and Mishel 2020), men now lag behind women on most measures of school success. This “problem with boys” has attracted the attention of scholars, policymakers, and the popular press.
In explaining these patterns, sociologists have emphasized the social dynamics of gender over and above the purported dictates of sex. The gender gap, sociologists show, is not an immutable fact of biology; it is a contingent product of students’ social positions and social contexts. To illustrate this fact, stratification research has uncovered considerable heterogeneity in men’s and women’s academic outcomes, analyzing variation across birth cohorts (DiPrete and Buchmann 2013), family resources (Buchmann and DiPrete 2006), race/ethnicity (Hsin 2018), and school context (Legewie and DiPrete 2012).
Within this body of research, one central axis of inequality has gone largely unobserved: sexuality. For decades, sexuality has been invisible in the demographic surveys and administrative data sources used to analyze population-level patterns of academic performance (Wimberly 2015). One important exception is the Add Health study, which enabled a generation of research on lesbian, gay, and bisexual (LGB) students’ achievement and attainment (e.g., Mollborn and Everett 2015; Pearson, Muller, and Wilkinson 2007). Still, that research came to inconsistent conclusions and captured the experience of just one cohort: a cohort that left high school about 25 years ago.
The relative invisibility of sexuality in educational stratification research is consequential because sexuality intersects with gender in a uniquely fundamental way. “Heterosexuality,” as Meadow (2018:53) puts it, “underwrites much of what we think of as gender.” Inherent in what it means to “do gender” is the mandate to “do heterosexuality” (Schilt and Westbrook 2009). This is especially true for school-age boys, for whom the fear of becoming a “fag” is a central concern (Pascoe 2007). In this way, LGB 1 students generally—and gay boys in particular—provide a unique opportunity to reexamine the effect of gender on school success. If existing research has documented the consequences of hegemonic gender norms, then LGB students offer a chance to uncover how gender shapes school success from “the perspective of the margins” (Compton, Meadow, and Schilt 2018:17).
Fortunately, it has recently become possible to study America’s LGB populations in important new ways. Taking advantage of major recent expansions in American sexual identity data, the current study incorporates LGB students into contemporary understandings of educational stratification. In so doing, I advance a new, more fully intersectional account of the gender gap in education. Across datasets and outcomes, I find consistent evidence that sexuality is a highly consequential axis of academic inequality, albeit in ways that vary sharply by sex. As a whole, my results reveal two core demographic facts. First, “the rise of women” should be understood more precisely as the rise of straight women. Second, “the problem with boys” obscures one group with rather remarkable levels of academic success: gay boys.
The Gender Gap in Education
The Rise of Women Amid an Asymmetric Gender Revolution
By one measure, girls have always outperformed boys in the classroom. For as long as researchers have collected the data, girls have earned better grades from their teachers (DiPrete and Buchmann 2013). What changed over the twentieth century was not so much women’s academic performance, but rather the societal constraints and incentives governing women’s academic investments. Until relatively recently, patriarchal laws and norms required women to choose between higher education, on the one hand, and marriage and family, on the other (DiPrete and Buchmann 2013; Goldin, Katz, and Kuziemko 2006). At the same time, limited access to contraceptive technology meant that women’s educational careers were often cut short by fertility (Bailey and Lindo 2017). As a result of these mutually reinforcing pressures, for most of the twentieth century, never-married women earned college degrees at substantially higher rates than their married peers (Isen and Stevenson 2010). As these external constraints eased, women’s “latent advantage in academic performance” expressed itself in rapidly rising educational attainment (DiPrete and Buchmann 2013:201).
In contrast to women’s swift gains across cohorts, men’s educational attainment has remained remarkably flat for decades. Strikingly, men born after 1980 are just slightly more likely to have a bachelor’s degree than men born before 1950 (DiPrete and Buchmann 2013). This stalling out is particularly surprising because it occurred during a period when the economic incentives for college completion grew ever stronger (Goldin and Katz 2008).
From a rational choice perspective, men’s human capital investments are difficult to explain. From a gender perspective, however, men’s academic stagnation is directly in line with the broader rigidity observed among men over the past half century. The “gender revolution” was asymmetric: it allowed certain profound changes for women, but involved far fewer changes by men (England 2010). Women gained access to previously male-exclusive educational and professional opportunities, but men’s educational and occupational choices remained largely unchanged (Charles and Bradley 2009). Women’s wage labor became an increasingly essential component of household income, but men’s domestic labor failed to compensate accordingly (Hochschild and Machung 1989). More fundamentally, femininity expanded to allow certain activities and attributes historically restricted to men, but masculinity has remained stubbornly narrow and anxiously focused on repudiating effeminacy.
Masculinities in the Classroom
It is this pressure to enact a certain kind of masculinity that is at the heart of sociological accounts of boys’ academic underperformance. A long tradition of ethnographic research shows how boys’ adolescent peer groups denigrate academic effort and valorize school-related rebellion (Coleman 1961; MacLeod 1987; Morris 2012; Willis 1981). 2 As Morris (2012:70) shows in his ethnography of working-class U.S. high schools, boys who work hard and play by school rules are mocked as “gay” by their peers. Similarly, in her study of British secondary schools, Epstein (1998) finds that boys who appear committed to schoolwork get called “queer” by classmates (DiPrete and Buchmann 2013:168).
Masculinities research suggests the choice of insult in these studies is not incidental. “To call someone gay or fag,” one boy explained to Pascoe (2007:55), “is like the lowest thing you can call someone.” Connell (1995:78) formalizes this boy’s intuition, arguing that “gayness . . . is the repository of whatever is symbolically expelled from hegemonic masculinity.” Therefore, in labeling academically committed boys “gay,” peers are drawing a distinctly sharp boundary and casting open investment in school outside the bounds of acceptably masculine practice. Being seen as naturally “brilliant” does not necessarily threaten boys’ masculinity (Musto 2019), especially if they successfully display an air of “contrived carelessness” (Morris 2012). However, at least in certain contexts, visibly working hard in school is feminized; being a real man and being a conscientious student are incompatible.
Femininity Premiums and “Bad Girl” Penalties
Currently, it is boys’ failure to adapt to the knowledge economy that is puzzling. Historically, though, it was girls’ academic success that struck sociologists as an intriguing anomaly (Mickelson 1989). Why did girls academically outperform boys even in cohorts when women’s achievement was unlikely to yield an economic payoff? At least part of the answer, sociologists proposed, lies in girls’ gender socialization and the gendered interpretation of behavior by teachers (e.g., Entwisle, Alexander, and Olson 2007; Mickelson 1989). “Girls,” in this account, “are raised to conform to the expectations dictated by adults and authorities, including following the academic ‘rules’” (Riegel-Crumb, Kyte, and Morton 2018:135).
In this tradition, a central component of female students’ success in the classroom lies in their adhering to the “good girl” role. This requires, at a minimum, being modestly feminine in dress, soft-spoken in speech, and deferential in behavior. More recent research underscores the raced and classed dimensions of the “good girl” role, clarifying the extent to which these expectations reflect White, middle-class standards of femininity (e.g., Ispa-Landa 2013; Jones 2010; Morris 2007). In this way, favorable treatment by teachers is an early example of what Hamilton and colleagues (2019) call “femininity premiums”: the benefits that intersectionally accrue to women for successfully enacting hegemonic femininities.
What unifies the various dictates of being a “good girl” is the fundamental mandate that women should remain distanced from and deferential to masculinity (Manne 2017; Schippers 2007). Just as the specter of effeminacy polices the borders of masculinity among boys, the “bad girl” penalty punishes girls who stray too far from the constraints imposed by femininity. Pascoe’s (2007:115, 154) research illustrates this fact: of all the teenage girls who “dressed, talked and carried themselves in many ways ‘like guys’ . . . none were strangers to the disciplinary system.”
Gender, Sexuality, and School Success
The Interconnectedness of Gender and Sexuality
In sketching out sociological explanations for the academic gender gap, we see that gender operates at multiple levels across distinct historical contexts. At the macro-historical level, women’s educational attainment was long constrained by a patriarchal system organized around male breadwinners. In the contemporary period, gendered academic patterns persist, at least in part, because of dynamics enforced at the interactional level: through the pressure to normatively “do gender” in ways rewarded by peers and teachers. Incorporating sexuality into the study of educational stratification throws both of these explanations into sharper relief.
At the macro-historical level, it was not simply a patriarchal system that long constrained women’s education; it was a hetero patriarchal system. When previous accounts of women’s rising educational attainments describe the changing dynamics of twentieth-century marriage markets (DiPrete and Buchmann 2013; Goldin et al. 2006), they leave unacknowledged that they are actually describing straight marriages: marriage was not extended to all women until the twenty-first century. As such, for lesbian/bisexual women, the dynamics governing the “rise of women” may have been quite different.
At the interactional level, the pressure to normatively “do gender” draws much of its disciplinary power from homophobia, especially among boys (Connell 1995; Pascoe 2007). Although previous accounts of boys’ underachievement attest to the pervasiveness of homophobia in boys’ peer cultures (Epstein 1998; Morris 2012), they are unable to access the perspectives of those most directly targeted by such cultures: gay/bisexual boys themselves. For gay/bisexual boys, the pressure to prove one’s manhood through academic disengagement could feel particularly strong, but it also might feel liberatingly absent.
In all these ways, making sexuality visible provides an opportunity to more fully refine existing explanations for the academic gender gap. However, studying LGB students also encourages new ways of measuring gender and conceptualizing its impact on school success. It is not just at the level of institutions and ideology where gender and sexuality intertwine: across the life course and along a range of measures, sexuality consistently stratifies how gender is enacted in everyday life.
Beginning in early childhood, “gender and sexuality evolve in an intricate relationship to one another” (Meadow 2018:42). As such, a large literature finds that nonconforming gender-typed behavior—on such measures as preferred playmates, toys, and activities—is a common, although certainly not universal, feature of gay/lesbian childhoods (e.g., Li, Kung, and Hines 2017; Rieger et al. 2008). These early play preferences also manifest later in life in terms of occupational aspirations (Lippa 2000) and realized occupational destinations (Tilcsik, Anteby, and Knight 2015), with multiple studies finding “gay men and lesbians are more likely to cross gender boundaries in the professions” (Baumle, Compton, and Poston 2009:168). Although these kinds of gendered preferences and behaviors are fluid over time and across contexts, what this research shows is that—at given snapshots of time—gay and lesbian populations are, on average, significantly more gender atypical than straight populations.
Alongside these patterns of preferences and behaviors, sexuality also stratifies more direct, embodied measures of gender expression. For instance, between 2017 and 2019, representative samples of high school students in 10 U.S cities were asked: “A person's appearance, style, dress, or the way they walk or talk may affect how people describe them. How do you think other people at school would describe you?” Respondents were given seven response options, ranging from “very feminine” through “very masculine.” Figure 1 presents teens’ average responses, separately by sex and sexual identity; Figure S1 in the online supplement displays the full distribution of results.
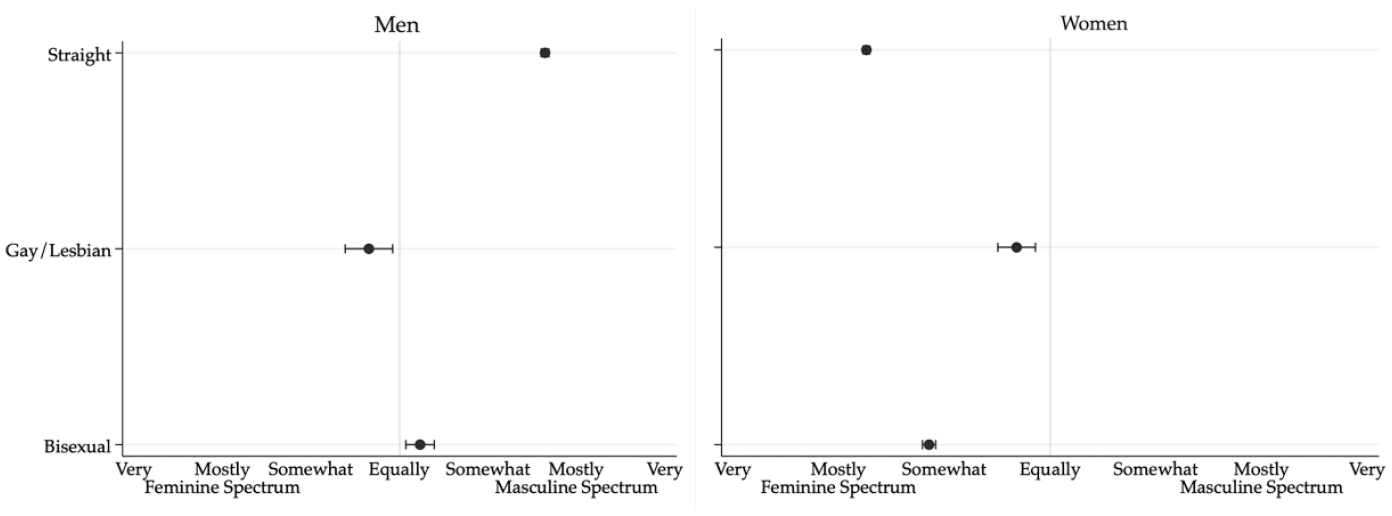
Average Reported Gender Expression among U.S. High School Students: Selected Cities, 2017/19
Figure 1 shows the same pattern for both sex-based groups: gay/lesbian teens report significantly more nonconforming gender expression than do bisexual teens, who, in turn, report more nonconforming expression than do straight teens. The full distribution of responses, shown in Figure S1 in the online supplement, underscores these patterns. Within both groups, straight teens hew closely to the “very” and “mostly” masculine/feminine categories. By contrast, bisexual—and, especially, gay and lesbian—teens are more fully represented throughout the masculine-feminine spectrum. Only 3 percent of straight-identified girls report feeling seen as somewhat-to-very masculine, whereas 7 percent of bisexual and 32 percent of lesbian girls report feeling seen along the masculine spectrum. Among boys, 26 percent of bisexual boys and 45 percent of gay boys report feeling seen along the feminine spectrum, compared to only 9 percent of straight boys.
Emerging across these multiple measures—the styles that feel natural or foreign, the friends and interests that excite or repel, the way one sounds (Lagos 2019) or holds their body—is the sense that LGB and straight populations gravitate, on average, toward different locations within a spectrum of gendered possibilities. Historically, sociologists have had few tools to make these distinct locations visible. Instead, when describing population-level patterns of inequality, research has largely relied on surveys that include only “starkly dichotomous” measures that conflate gender and sex (Westbrook and Saperstein 2015:535). In such studies, “masculinity” and “femininity” come to be seen only as a property of male- or female-assigned bodies, rather than as “a subjectivity that is enduring, stable and divorced from the body” (Meadow 2018:52). LGB youth underscore the limitations of such an approach, encouraging new measurement methods that allow a more continuous spectrum of masculinity and femininity to be untethered from binary sex.
LGB Students in U.S. Schools
Schools are famously inhospitable spaces for LGB youth. A long-standing research tradition examines the social and psychological aspects of LGB students’ school experiences, documenting bullying (e.g., Toomey and Russell 2016), discriminatory policies and practices (e.g., Kosciw et al. 2018), and the heavy toll that unsafe school contexts take on LGB students’ mental health (e.g., Russell and Fish 2016). Given these facts, some scholars have concluded that schools are “the most homophobic of all social institutions” (Aragon et al. 2014:2).
Within this literature, however, LGB students’ core academic outcomes have been largely unobservable. Given the psychosocial strains LGB students face, one might expect they would struggle academically as well. However, given the sharp gender-typing of academic performance, there are also many reasons why the academic outcomes of gay/bisexual boys could be very different from those of lesbian/bisexual girls.
For gay/bisexual boys, precisely those aspects of gender that are socially costly could also be academically beneficial. If locally dominant norms of masculinity denigrate academic investment, then being alienated from those norms—and excluded from the peer groups that promote them—could be tremendously beneficial. Similarly, in contexts where teachers criminalize boys’ masculinities from an early age (Ferguson 2000; Rios 2011), boys with less normatively masculine gender enactments might endure peer sanctions but avoid the more formalized sanctions imposed by school officials (Mittleman 2018).
For lesbian/bisexual girls, to the extent that students construct academic engagement as feminine, an internally felt aversion to “girliness” may encourage some to view school skeptically. This internal feeling could find external reinforcement in how lesbian/bisexual girls are treated by school officials. If teachers see lesbian/bisexual girls as enacting masculinity, this could make them prime targets for the “bad girl” penalty identified by previous research. This risk could be especially high for Black girls, who are already stereotyped as masculine by White authority figures (Ispa-Landa 2013; Jones 2010). In this way, LGB identities could be doubly disadvantaging for girls: both socially risky and academically costly.
Existing Evidence and the Invisibility of Sexuality in Population Data
Research into these kinds of possibilities has long been hampered by severe data limitations. For decades, researchers had to fight even for the acknowledgment there was an LGB population (Gates 2012). Although that fight may seem won, the majority of U.S. demographic surveys still do not include information on sexual orientation (National Academies of Sciences, Engineering, and Medicine 2020). A recent review found that, of over 100 ongoing federal surveys, only 11 assessed sexual orientation (Velte 2020). Researchers studying gay and lesbian adults have relied on same-sex partnerships revealed in household rosters of core demographic surveys, like the American Community Survey and the decennial census (e.g., Baumle et al. 2009; Gates and Ost 2004). However, partnership data reveal only a selective subset of the gay and lesbian population and mislabel bisexuals in both same-sex and other-sex partnerships. Moreover, given the sharp stratification of cohabitation patterns by educational attainment (McLanahan 2004), partnership data are particularly ill-suited for studying educational outcomes.
Even as data on LGB populations are generally sparse, data on LGB students are even more uncommon. In a context where six states still have laws forbidding the acknowledgment of homosexuality in public schools (GLSEN 2018), research on student sexuality has faced steep opposition (Wimberly and Battle 2015). Measures of student sexual orientation have become increasingly available in health surveys—such as those administered through the CDC’s Youth Risk Behavior Surveillance system—but these surveys include few questions, if any, about academics.
Given these limitations, most population-based research on LGB students’ academic outcomes has relied on just one study: Add Health. Tracking a cohort of middle and high school students from 1994 through adulthood, Add Health enabled a generation of research on LGB students’ achievement and attainment. This research supports the intuition that LGB boys and girls face divergent academic experiences, but it came to conflicting conclusions about the direction of these effects.
In an early study, Pearson and colleagues (2007) used a same-sex attraction measure reported at baseline and found that same-sex attracted boys, but not girls, left high school with lower GPAs, lower rates of advanced course-taking, and higher rates of course failure. Later Add Health research, however, came to directly opposite conclusions. Using a sexual identity measure reported in adulthood, Mollborn and Everett (2015) found that men identifying as “mostly gay” or “entirely gay” graduated high school with significantly higher GPAs than did straight men and went on to enroll in college at much higher rates. Other studies further parse LGB students’ outcomes by school urbanicity and culture (Wilkinson and Pearson 2009) as well as by the timing and consistency of reported sexuality (Pearson and Wilkinson 2017; Walsemann et al. 2014). All told, it is difficult to draw consistent conclusions from this pioneering body of work. Moreover, the Add Health data capture only one birth cohort: a cohort whose experiences may have been very different from those born long before them as well as those born more recently.
Research examining the educational attainment of LGB adults comes to similarly mixed conclusions. Demographic profiles that identify gay and lesbian adults using partnership data consistently note that same-sex households have higher rates of educational attainment than do other-sex households (Black et al. 2000; Black, Sanders, and Taylor 2007; Gates and Ost 2004). However, the limitations of partnership data make it difficult to interpret these findings. Therefore, it is notable that Gates’s (2014:7) review of four population-based surveys with direct measures of sexual identity concluded that “findings regarding educational attainment did not show a completely consistent pattern across surveys.”
Some of the inconsistencies of existing research are surely due to the fact that, as a comparatively small population, LGB respondents yield only limited sample sizes in nationally representative surveys. Such limited samples not only generate unstable estimates, they also prevent analyses of how sexuality further intersects with other aspects of identity and context. For instance, generations of intersectional scholarship highlight the distinct experiences of Black lesbian women (Collins 2004; Combahee River Collective 1983; Moore 2011), a group obscured in analyses that combine all lesbian women together. Similarly, LGB individuals’ academic outcomes are likely to vary substantially by birth cohort in the United States, due to the rapid progress in LGBTQ rights and the sweeping rise of women more broadly.
Summary and Current Contributions
Taken together, existing research is marked by conflicting findings and critical limitations. Fortunately, new data make it possible to more comprehensively incorporate LGB students into contemporary accounts of educational stratification. During President Obama’s second term, there was a coordinated effort across the federal research apparatus to expand the collection of sexual orientation measures (Federal Interagency Working Group 2016). As a result, sexual identity measures were added to three of the largest, longest-running nationally representative household surveys in the United States: the National Health Interview Survey (NHIS), the National Survey on Drug Use and Health (NSDUH), and the National Crime Victimization Survey (NCVS). At the same time, the National Center for Educational Statistics (NCES) received approval to ask about students’ sexual identity in the latest wave of its High School Longitudinal Survey of 2009 (HSLS). The most recent in NCES’ long-standing cohort series, HSLS is the first such study to assess student sexuality. Taking advantage of these new data, the current study makes three primary empirical contributions.
First, I analyze how sexuality stratifies bachelor’s degree attainment among U.S. adults, attending to variation by sex, race/ethnicity, and birth cohort. Using every available wave of the NHIS (N = 197,277), NSDUH (N = 149,189), and NCVS (N = 141,567), these analyses reconstruct “the rise of women” across twentieth-century birth cohorts while also revealing bachelor’s degree attainment rates among LGB women and men.
Second, I complement these population-level analyses with a more granular examination of contemporary LGB students’ experiences during and after high school. Drawing on restricted-use transcript and survey data from the HSLS (N = 15,270), I examine how sexuality stratifies a comprehensive set of academic performance measures as well as multiple indicators of discrimination and minority stress (Meyer 2003).
Finally, I test whether LGB women’s and men’s disparate academic outcomes reflect their distinct positions within a spectrum of masculinity/femininity. To do this, I extend existing “gender diagnosticity” techniques (e.g., Lippa and Connelly 1990; Yavorsky and Buchmann 2019) to take advantage of advances in supervised machine learning algorithms. I propose that this approach—what I call a “gender predictive” approach—could have application across a range of empirical contexts as a valuable tool for flexibly summarizing gendered inequalities along a continuous distribution, rather than collapsing them into a single, binary difference.
Data and Methods
Data
Adult population
To document the educational attainment of LGB adults, I draw on three federally-sponsored household surveys: the NHIS, NSDUH, and NCVS. Each of these studies have long been key parts of the federal research apparatus, conducted annually since 1957, 1971, and 1972, respectively. Unlike other federally-sponsored surveys used to study LGB populations (e.g., BRFSS, NHANES, and NSFG), the NHIS, NSDUH, and NCVS are representative of the entire civilian, noninstitutionalized adult population of the United States, not just adults in specific states or among specific age ranges. For each survey, I use every wave that included a sexual identity measure: seven waves for NHIS (2013 to 2019), five waves for NSDUH (2015 to 2019), and three waves for NCVS (2017 to 2019).
High school cohort
HSLS, the fifth and most recent high school cohort study sponsored by NCES, follows a sample of public and private school students who were in 9th grade in 2009. From this study, I analyze three waves of student surveys: a baseline survey in 2009, a follow-up survey from spring 2012 (when most students were in 11th grade), and a postsecondary survey, administered from March 2016 to January 2017. To analyze students’ course-taking and achievement, I also draw on students’ official transcripts provided by their high schools and postsecondary institutions.
Measures: Dependent Variables
I examine three broad domains of outcomes: educational attainment, achievement and academic orientation, and discrimination/minority stress. 3
Educational attainment
In studying the adult population, I document three levels of educational attainment: at least a high school diploma, at least a bachelor’s degree, and a professional/doctoral degree (JD, MD, PhD). Of these, my primary outcome of interest is a binary measure of whether the respondent reports having earned a four-year college degree or higher (“bachelor’s degree attainment”). In the HSLS, students following an on-time, direct progression from high school through college would have been in their junior year of college at the time of the latest survey. Therefore, my primary HSLS attainment measure is an indicator of whether students reported they were currently enrolled at a four-year institution pursuing a bachelor’s degree (“bachelor’s degree enrollment”). I also analyze whether HSLS students report having earned a high school diploma and whether they report ever “dropping out” of high school (defined as withdrawing for more than four consecutive weeks, other than for vacation or illness).
Achievement and academic orientation
The HSLS transcript and survey data allow me to complement these binary attainment measures with rich measures of achievement and academic orientation. From students’ official transcripts, I analyze three outcomes: high school GPA, postsecondary GPA, and high school curricular intensity. Both GPA measures were computed by NCES on a continuous four-point scale. Among respondents who pursued further education after high school, the postsecondary GPA measure reflects their cumulative performance across all courses in which they earned credits by 2017. To construct a high school curricular intensity scale, I adopt Austin’s (2019) approach, which uses four transcript variables: a student’s highest math class, total science credits, total English credits, and whether the student took an AP class.
To assess students’ broader academic orientation during high school, I use student survey data to construct three measures: an academic behaviors scale, an academic attitudes scale, and a friends’ academic orientation scale. The behaviors scale includes four items on rule following (e.g., “How often do you go to class late?”) and three items on the amount of time spent on homework. The attitudes scale includes five items on students’ beliefs about the importance of high school for later life success (e.g., “high school is often a waste of time”). Finally, the friends scale includes four items on how many of the students’ “close friends” “get good grades,” “have ever dropped out of high school,” “have taken college admissions tests,” and “plan to attend a four-year college.”
To construct these scales, I conducted polychoric factor analyses to account for the non-continuous nature of the underlying variables. In each case, the first principal component effectively summarized the measures: only the first principal components had eigenvalues over 1 and each explained at least 50 percent of the underlying variation. Therefore, I extracted the first principal component from each factor analysis and standardized them to a mean of zero and standard deviation of one.
Discrimination and minority stress
Finally, to situate HSLS students’ academic outcomes within their broader school experiences, I also analyze three measures of discrimination and minority stress. First, I analyze whether, as 9th graders, they disagreed with the statement “I feel safe in this school.” Then, from the postsecondary survey, I analyze whether students reported that “discrimination or unfair treatment based on a personal characteristic has limited [my] educational opportunities” as well as whether they ever had “serious difficulty concentrating, remembering, or making decisions [because of] an emotional or mental health issue.”
The Complexity of Operationalizing Sexuality in Population Research
From a queer perspective, attempting to silo individuals into discrete, stable “sexual orientations” is epistemically fraught, at best, and entirely misguided, at worst (Compton et al. 2018). Even firmly within a positivist framework, however, empirical complexities abound. Sexuality is multifaceted: it is constituted by attractions, behaviors, and identifications that may not align (Mishel 2019; Silva 2019). Sexuality is concealable and may be underreported on surveys (Coffman, Coffman, and Ericson 2017). Finally, sexuality is fluid and sexual identification may evolve across the life course (Diamond 2008; Moore 2011). Demographic research on LGB populations often elides these complexities, relying on point-in-time sexual identity measures that fail to capture the multidimensionality of sexuality itself. Although this study faces some of the same limitations, I address each of these complexities—multifacetedness, underreporting, and fluidity—in a few key ways.
For my primary analyses, I use sexual identity measures reported at a single point in time. Across all surveys, the exact question wordings were nearly identical, asking variations of “Which of the following best represents how you think of yourself?” All surveys included the following response options: “lesbian or gay,” “straight, that is, not lesbian or gay,” “bisexual,” “I don’t know the answer,” and “refused.” To clarify the presentation of results, I focus only on comparisons between lesbian, gay, bisexual, and straight respondents; complete regression results including the other groups are included in the online supplement.
Given the potential limitations of these point-in-time sexual identity measures, I take three steps to address the above concerns. First, to address multifacetedness of sexuality, I replicate my results using a sexual attraction measure included in the NSDUH. Second, to address the possible underreporting of sexuality, I replicate my results not just across surveys but also across survey administration modes, comparing results from face-to-face interviews (as in the NHIS and NCVS) with results from privately completed self-administered questionnaires (as in the NSDUH). Although LGB identities may still be underreported on private, self-administered questionnaires, previous research shows such techniques yield higher rates of reported LGB identification (Williams Institute 2009). Finally, to address concerns about the fluidity of sexuality, I conduct sensitivity tests exploring the possibility that college itself may reshape students’ perceived possibilities for sexual identification. To do this, I draw on a nationally representative study of recent college graduates, the 2016–17 Baccalaureate and Beyond Longitudinal Study (B&B:16/17)
Analytic Approach
For all outcomes, I present two forms of evidence. First, I present purely descriptive statistics, separately by sex and sexual identity. Then, to assess whether these descriptive results could reflect selective patterns of LGB identity reporting across demographic groups, I also present regression-adjusted results. Across all models, the key coefficients of interest are the two- and three-way interactions between LGB identity, sex, and other aspects of identity (e.g., race/ethnicity, birth cohort). All descriptive statistics and regression analyses are weighted to reflect complex sampling procedures. To facilitate comparisons across models and simplify the interpretation of two- and three-way interaction effects, I present all regression results in terms of average adjusted predictions and average marginal effects (Breen, Karlson, and Holm 2018). Complete regression results are included in the online supplement.
Analytic Samples
Adult samples
I replicate my primary results across three samples of U.S. adults. To allow time for respondents to complete a four-year degree and to be consistent with Census Bureau reporting standards, I restrict these samples to respondents age 25 and older. Given low levels of missingness on all variables, I use listwise deletion to reach analytic samples of 197,277 for the NHIS, 149,189 for the NSDUH, and 141,567 for the NCVS.
HSLS sample
Consistent with NCES standards for reporting on restricted-use data, I round all HSLS sample sizes to the nearest 10. Of the 21,440 students included in the HSLS baseline sample, 17,340 participated in the most recent survey wave. Of these, about 1,470 respondents completed an abbreviated version of the survey, which did not include the sexual orientation measure. From that initial sample of 15,870, I reach my final analytic sample of 15,270 by excluding respondents without information on postsecondary enrollment (N = 70) and those who did not answer the sexual identity question (N = 530). 4 Given these multiple exclusions and the relatively high level of attrition, it is important to note that the analytic sample is no longer strictly generalizable to a well-defined population. Instead, it should be understood only as a geographically diverse, population-based cohort of U.S. high school students.
After sample restrictions, remaining levels of missing data were relatively low: about 5 percent for high school transcript data and 9 percent for student survey data. To address missing data, I implemented multiple imputation by chained equations, producing five imputed datasets. All covariates used in this study were included in the imputation equations. Analyses conducted using unimputed complete cases produced substantively identical results.
Sample descriptions
Table 1 summarizes the data sources. Across all household surveys, estimates for the size of the gay and lesbian population are rather consistent. Notably, this consistency is not just across data sources, but also across data collection techniques. Estimates for the size of the bisexual population are less consistent across surveys and appear to be sensitive to the mode of survey administration, with the NSDUH yielding a bisexual sample roughly three times larger than the others.
Summary of Data Sources
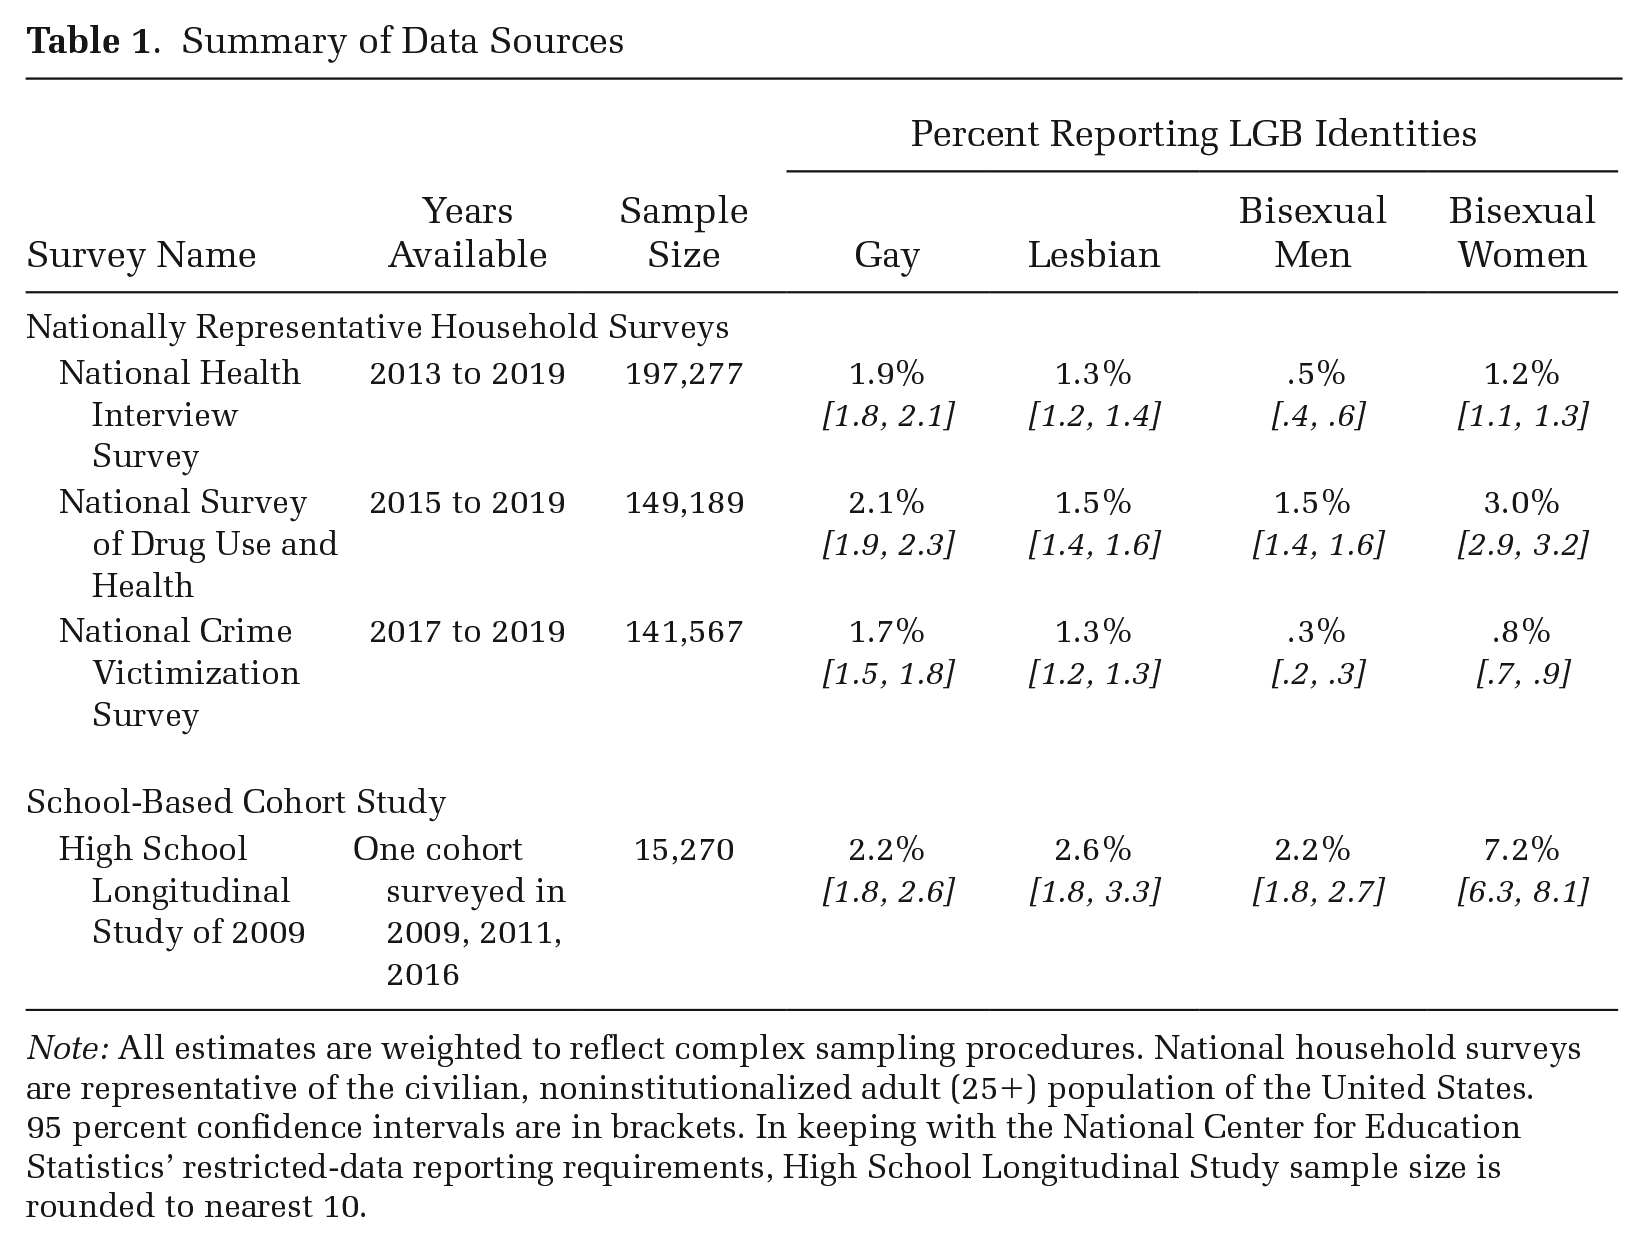
Note: All estimates are weighted to reflect complex sampling procedures. National household surveys are representative of the civilian, noninstitutionalized adult (25+) population of the United States. 95 percent confidence intervals are in brackets. In keeping with the National Center for Education Statistics’ restricted-data reporting requirements, High School Longitudinal Study sample size is rounded to nearest 10.
Within the HSLS sample, reported rates of gay and lesbian identity are somewhat higher than in the adult population at large. The more striking difference, however, is the substantial increase in bisexuality among women. In the HSLS sample, about 7 percent of women but only about 2 percent of men identify as bisexual. Figure S2 in the online supplement shows this pattern—of sharply rising bisexuality among younger cohorts of women but not men (England, Mishel, and Caudillo 2016)—is replicated across the NHIS, NSDUH, and NCVS. By contrast, reported rates of gay and lesbian identity increased slightly over the first three birth cohorts but have been stable from the 1960–69 birth cohort onward. These contrasting cohort patterns—the relative stability of gay/lesbian identification but sharp rise in bisexual identification—have important implications for the interpretation of cohort trends in bachelor’s degree attainment, a point to which I will return.
Results: Study 1: Educational Attainment Among U.S. Adults
Descriptive Statistics
Table 2 presents descriptive statistics on the educational attainment of U.S. adults, separately by sex and sexual identity. Compared to straight adults of the same sex, gay men and lesbian women both report consistent advantages at every level of educational attainment. Gay men’s successes especially stand out. In every dataset and across every level of educational attainment, gay men surpass all other groups. For example, the data indicate that about 6 percent of gay men in the United States have a JD, MD, or PhD, making them roughly 50 percent more likely to have an advanced professional degree than straight men. Bisexual–straight disparities, among both men and women, are generally smaller, less consistent in sign, and rarely statistically significant.
Educational Attainment by Sex and Sexual Identity: U.S. Adults, Age 25 and Older
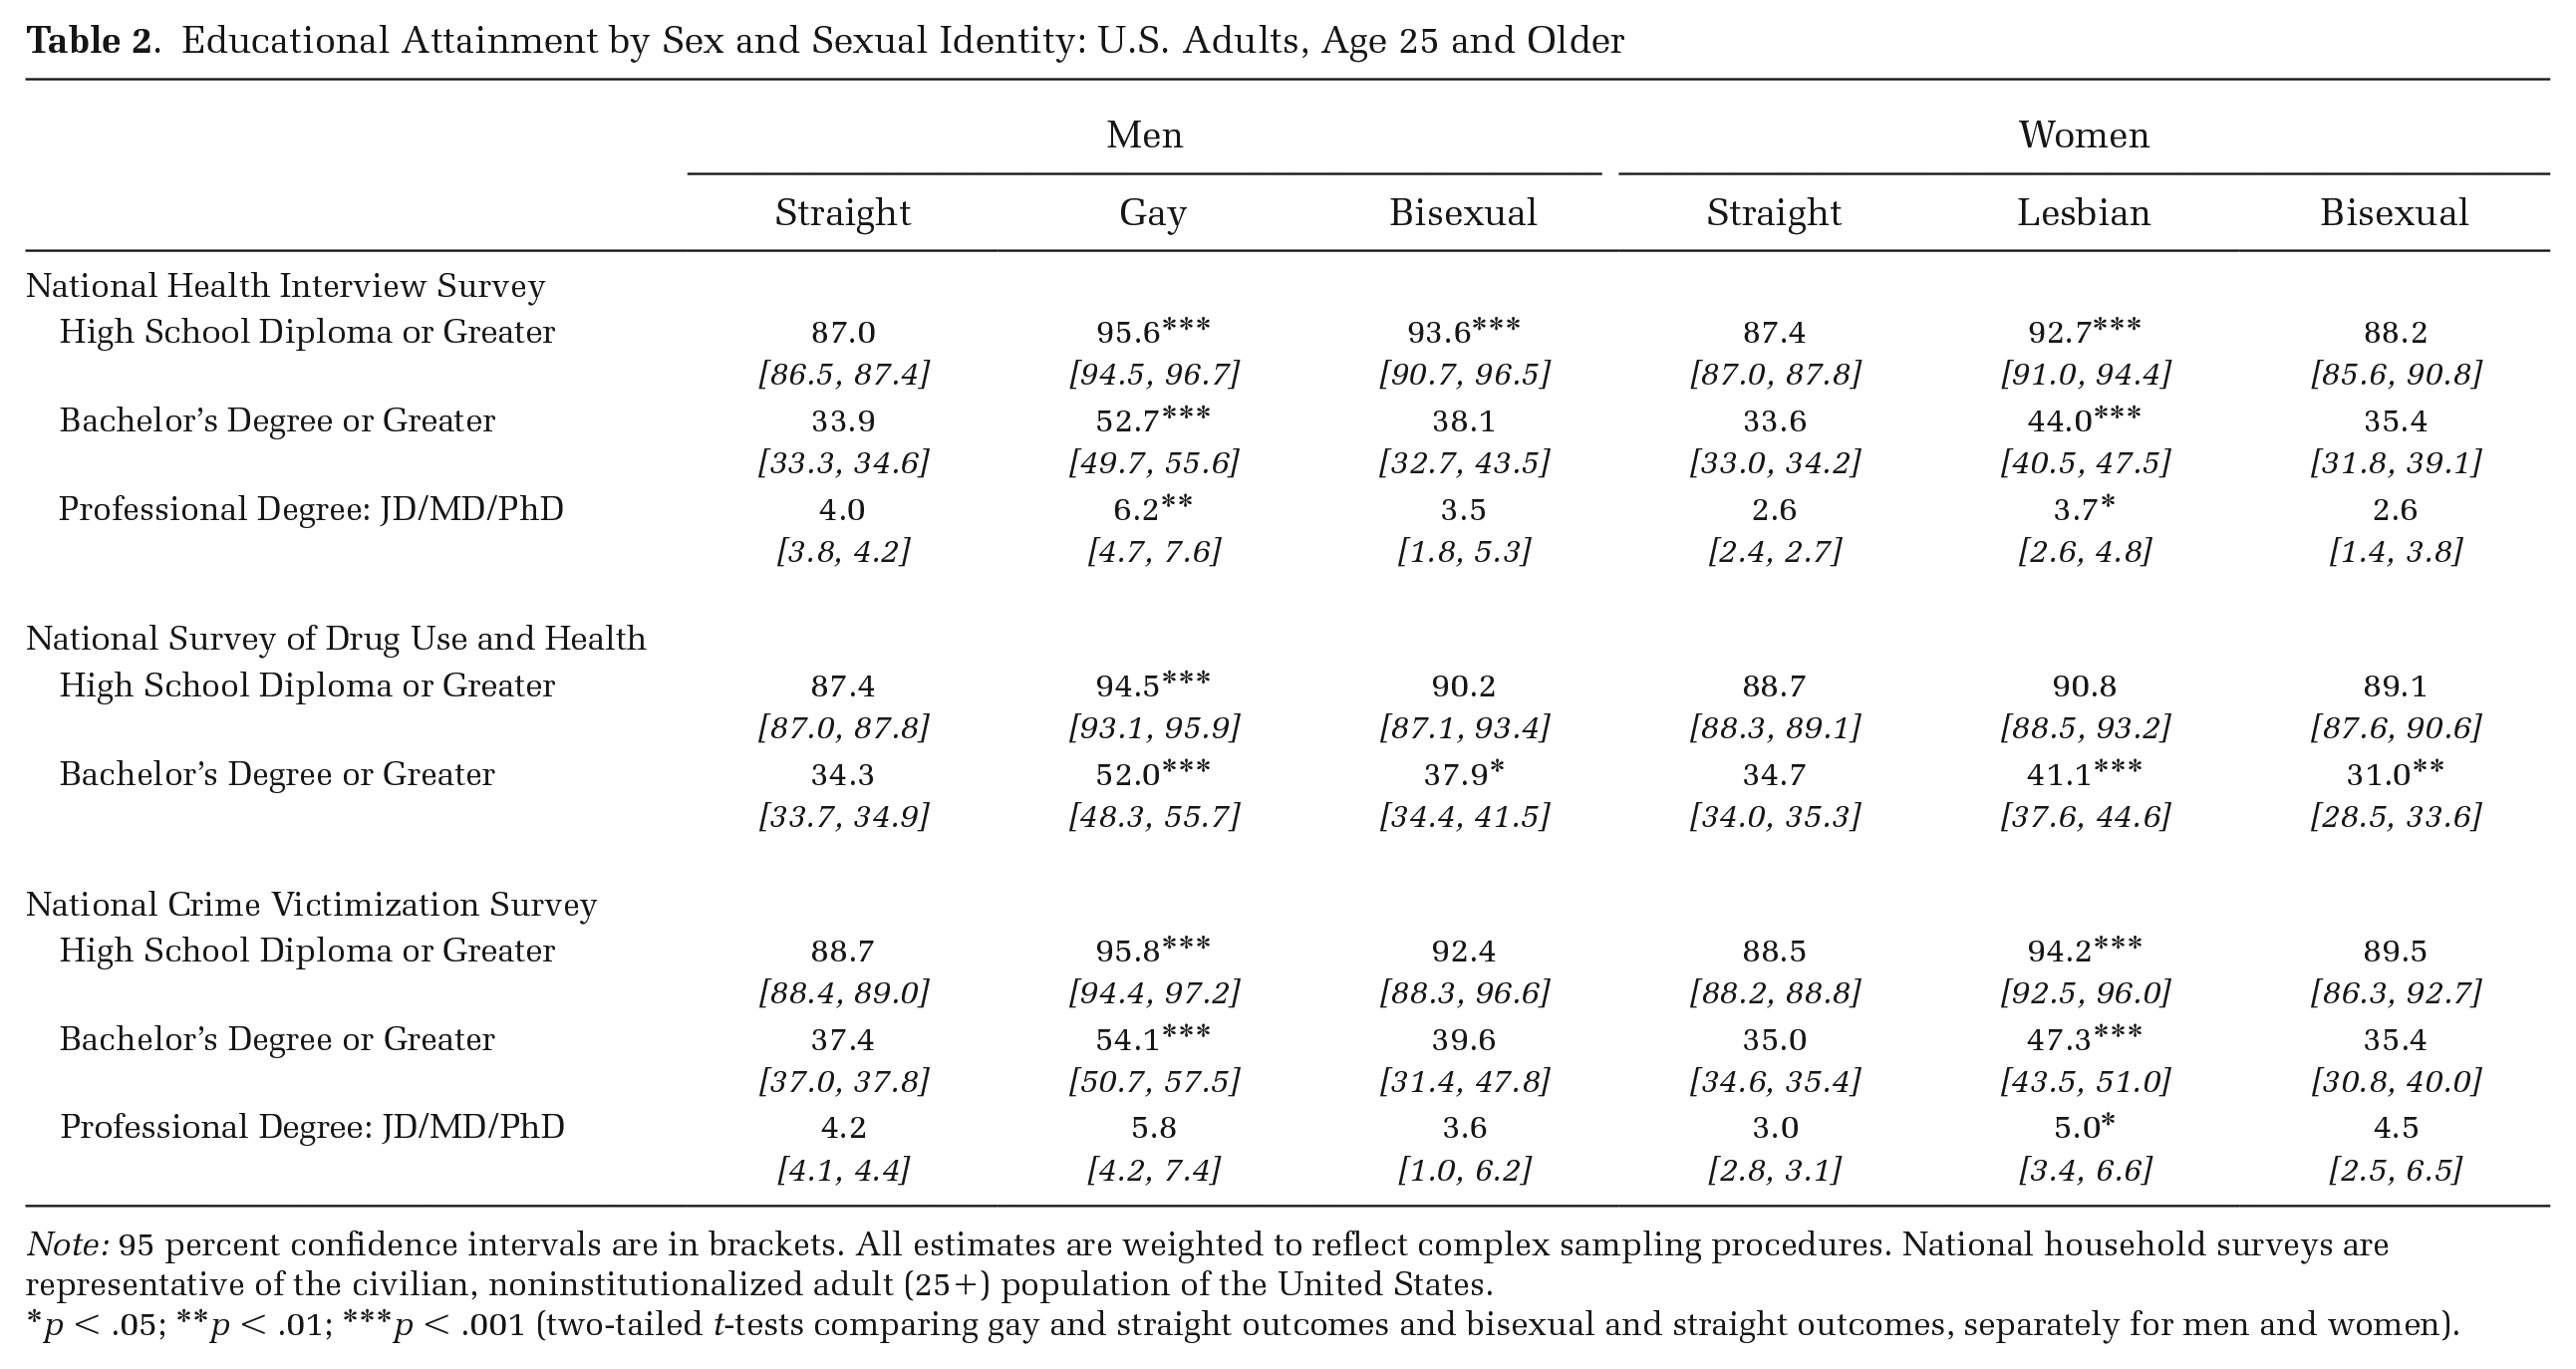
Note: 95 percent confidence intervals are in brackets. All estimates are weighted to reflect complex sampling procedures. National household surveys are representative of the civilian, noninstitutionalized adult (25+) population of the United States.
p < .05; **p < .01; ***p < .001 (two-tailed t-tests comparing gay and straight outcomes and bisexual and straight outcomes, separately for men and women).
Regression-Adjusted Bachelor’s Degree Attainment Rates
To explore these descriptive results more fully, I estimate logistic regressions of bachelor’s degree attainment controlling for race/ethnicity (constrained, due to sample sizes, to White, Black, Hispanic, Asian, and other), birth cohort (before 1950, 1950–59, 1960–69, 1970–79, and after 1980), 5 and a measure of nativity (directly reported in NHIS and NCVS; proxied in NSDUH by whether the survey was completed in a language other than English). Figure 2 presents the results of these regressions in terms of the average adjusted prediction from the two-way interaction of sex-by-sexual identity.
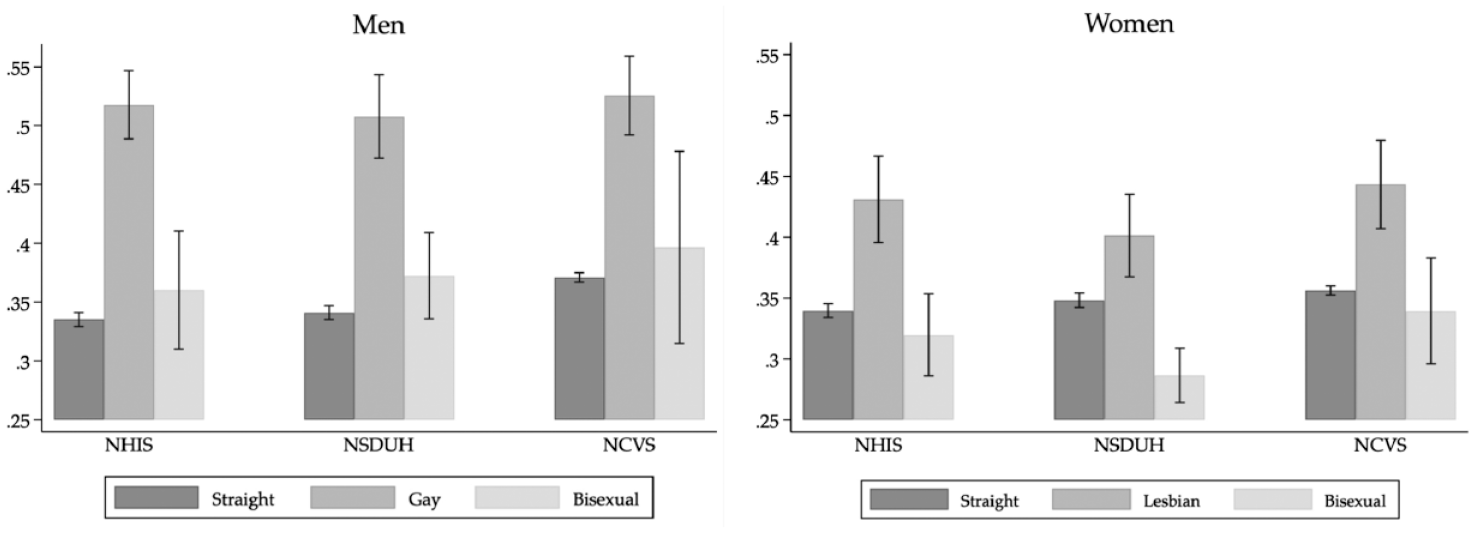
Bachelor’s Degree Attainment by Sex and Sexuality, U.S. Adults Age 25 and Older
Figure 2 underscores the consistency of results across datasets. In every survey, gay men’s bachelor’s degree attainment levels are replicated nearly to the point estimate: 51.9, 50.9, and 52.6 percent of gay men in the NHIS, NSDUH, and NCVS, respectively, are estimated to have earned at least a bachelor’s degree. These are strikingly high levels of educational attainment. One way to contextualize the magnitude of gay men’s bachelor’s degree attainment rates is to compare them internationally. As of 2019, the United States ranked ninth in the world in terms of the percentage of adults who earned the equivalent of a bachelor’s degree or higher (National Center for Educational Statistics 2021: Table 603.30). However, if U.S. gay men were considered on their own, they would have, by far, the highest college completion rate in the world: easily surpassing the current leader, Luxemburg, at 46.6 percent.
Lesbian women also significantly surpass most other groups of U.S. adults, with an estimated 43.2, 40.2, and 45.1 percent of lesbians in the NHIS, NSDUH, and NCVS, respectively, earning at least a bachelor’s degree. These, too, are high levels of college completion by both U.S. and international standards. Bisexual–straight disparities remain small and are generally not significantly different from zero. Among men, bisexual men appear to slightly outperform straight men, although none of these differences reach statistical significance. Among women, bisexual women consistently face slight disadvantages. These disadvantages are particularly pronounced in the NSDUH, which is the dataset with the highest rate of reported bisexual identification.
Moderation by Race/Ethnicity
By combining all racial/ethnic groups, the overall population averages reported above may mask significant heterogeneity within LGB populations. To test this possibility, I re-estimate the models from the previous section, allowing the sex-specific effect of sexuality to vary by race/ethnicity. For ease of interpretation, Figure 3 presents this three-way interaction—sex-by-sexuality-by-race/ethnicity—in terms of average marginal effects, summarizing the estimated disparities rather than presenting the full set of levels.
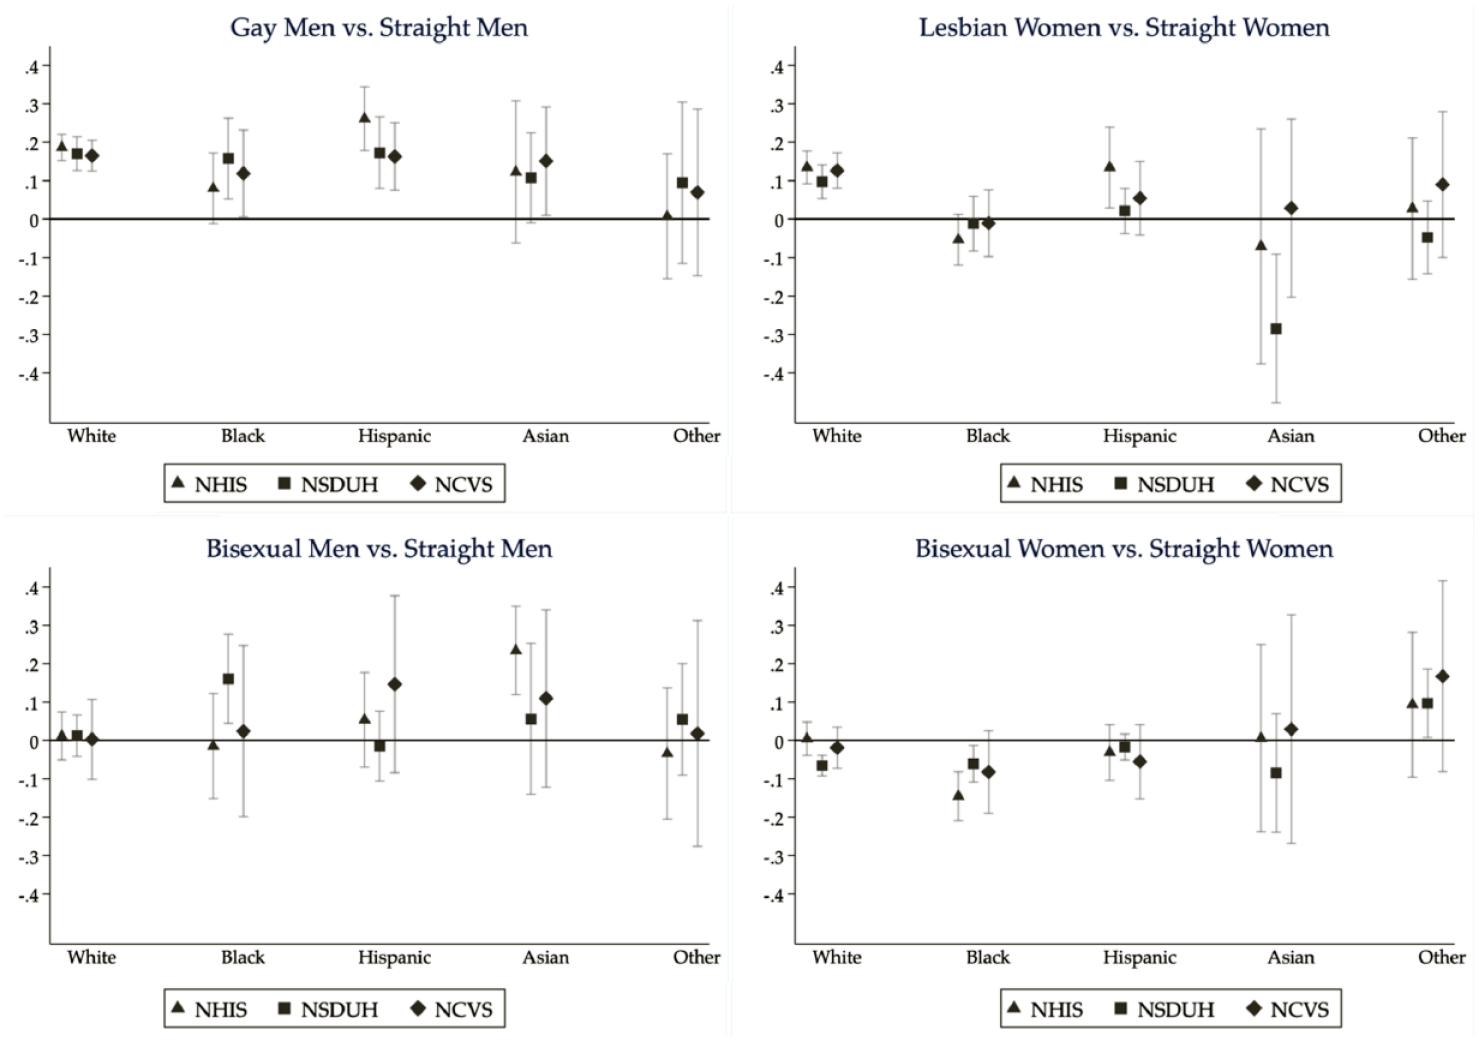
Differences in Bachelor’s Degree Attainment by Sex, Sexuality, and Race/Ethnicity, U.S. Adults Age 25 and Older
The results in Figure 3 reveal that, in every dataset, gay men’s sizable bachelor’s degree advantage extends across the four largest racial/ethnic groups. Among White (non-Hispanic) men, Black men, Hispanic men, and Asian men, gay men consistently surpass straight men by double digit margins. Gay men’s academic advantages are perhaps especially striking among Asian respondents, given the already high levels of academic success in the Asian population (Hsin and Xie 2014).
By contrast, lesbian women’s overall bachelor’s degree advantage appears to be concentrated almost entirely among White lesbians. Although there is variation across datasets among Hispanic, Asian, and “other” women, all datasets are consistent in showing that Black lesbians have clearly been excluded from the educational advantages that historically accrued to White lesbians. Results for bisexuals are less precisely estimated and suggest few consistent disparities across racial/ethnic groups.
Moderation by Birth Cohort
In the final models for the adult population, I allow the sex-specific effect of sexuality to vary by birth cohort, estimating the three-way interaction of sex-by-sexuality-by-birth cohort. I present two sets of results. First, Figure 4 shows the full range of birth cohorts, focusing on the gay, lesbian, and straight populations. Figure S3 in the online supplement presents cohort-specific results for bisexuals; I exclude this group from Figure 4 because the concentration of bisexual identification among younger women yields insufficient sample sizes in earlier cohorts. Given this fact, I also present Figure 5, which focuses on respondents born after 1980 and includes results for bisexuals. To begin to describe the HSLS results alongside the adult surveys, Figure 5 also includes the observed bachelor’s degree enrollment rates of the HSLS cohort.
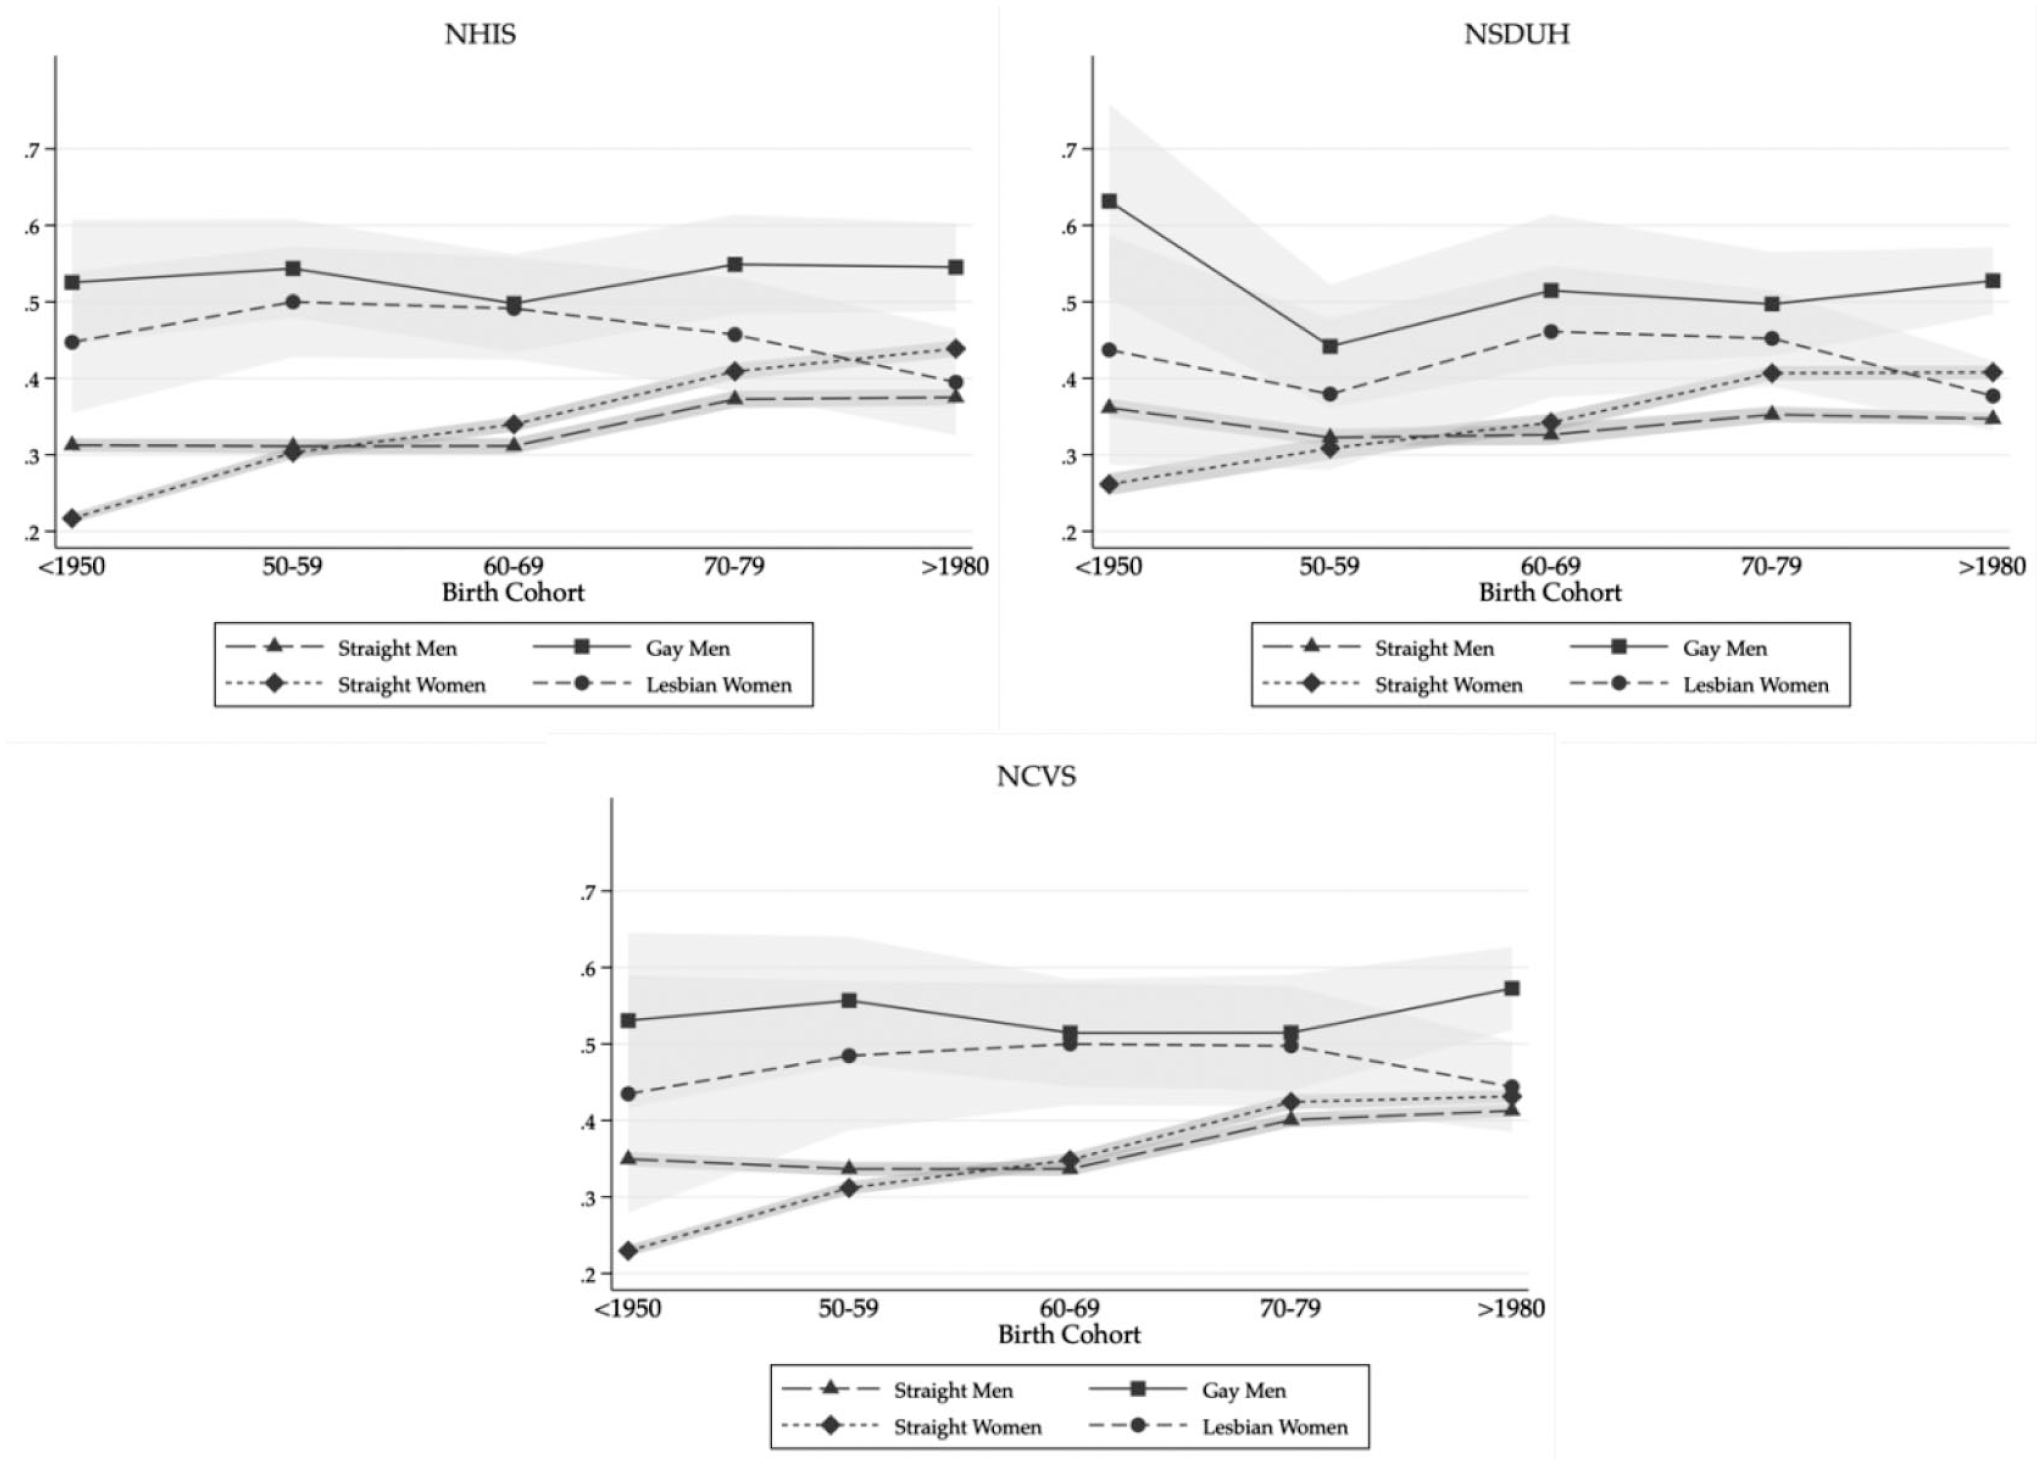
Reconstructing the “Rise of Women”: Bachelor’s Degree Attainment by Sex, Sexuality, and Birth Cohort
Focusing only on the straight population, the results in Figure 4 mirror the “rise of women” documented in previous research. Straight women’s outcomes rise monotonically across cohorts, increasingly surpassing straight men from the 1960s birth cohort onward. By making sexuality visible, however, Figure 4 reveals that the straight experience reflects just one specific trajectory of population-level educational attainment. From the perspective of the gay and lesbian population, the history of the college gender gap looks quite different.
Across all birth cohorts, in every dataset, gay men maintain a large and statistically significant bachelor’s degree advantage: particularly over straight men, but also over straight women. By contrast, all datasets show that lesbian women in earlier birth cohorts had a sizable bachelor’s degree advantage over straight women, but this advantage declined over time. This diminishing advantage reflects straight women’s rising attainments, but also, more curiously, lesbian women’s declining bachelor’s degree rates in recent cohorts.
Focusing just on contemporary cohorts, the results in Figure 5 illustrate a well-replicated pattern across datasets, including in the HSLS cohort. Among both men and women, bisexual respondents consistently report the lowest bachelor’s degree attainment/enrollment rates of all sexual identities, although it is only among women that these disadvantages reach statistical significance. Lesbian women’s overall bachelor’s degree advantage, documented in Figure 2, is entirely absent in recent cohorts. Instead, in three of the four datasets, lesbian women have lower bachelor’s degree rates than do straight women, although none of these disadvantages reach statistical significance. Finally, across all datasets, gay men continue to surpass all other groups.
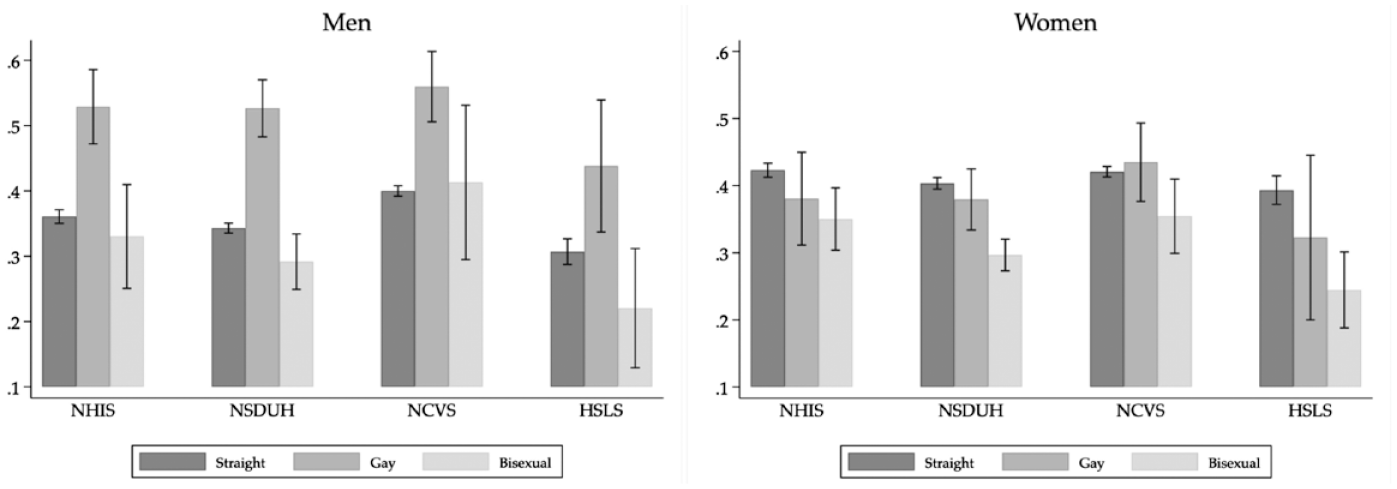
Bachelor’s Degree Attainment or Enrollment, by Sex and Sexuality, among Contemporary Cohorts
Summary of Study 1
Bringing together three large, nationally representative household surveys, Study 1 establishes a number of well-replicated demographic facts. First, I find that—across datasets, racial/ethnic groups, and birth cohorts—gay men report remarkably high levels of educational attainment, surpassing not just straight men but also straight women. Second, I find that lesbian women have an advantage over straight women, but this population average masks significant heterogeneity by race/ethnicity and birth cohort. On closer inspection, lesbian women’s overall advantage appears to be almost entirely concentrated among older cohorts of White lesbian women. Third, at the population level, bisexual men and bisexual women are roughly at parity with their straight counterparts. However, in recent cohorts—among whom reported bisexual identification is highest—bisexual men and, especially, bisexual women are disadvantaged compared to straight men and women. The HSLS data offer an opportunity to test whether the patterns documented in Study 1 persist in a more recent cohort and whether they extend across a broader set of school-related outcomes.
Results: Study 2: The Academic Experiences and Outcomes of The Hsls Cohort
Descriptive Statistics
Table 3 presents descriptive statistics on the HSLS sample’s outcomes, separately by sex and sexual identity. Across academic outcomes, the pattern of results largely reflects those documented in the post-1980 birth cohort in Study 1. Among boys, gay boys continue to outperform straight boys, and bisexual boys are slightly disadvantaged on most outcomes. Among girls, lesbian and bisexual girls are broadly disadvantaged, with bisexual girls generally experiencing the worst outcomes. These patterns persist not just in the self-reported outcomes on surveys, but also in students’ official transcripts, both in high school and among respondents who completed postsecondary coursework (N = 9,580). Notably, however, the patterns for academic outcomes shift with respect to the three measures of discrimination and minority stress. Despite their clear divides in academic performance, LGB boys and girls all report worse outcomes than do straight students in terms of feeling unsafe in school, facing discrimination, and experiencing mental health challenges.
Academic Performance and Orientation, High School Longitudinal Study of 2009
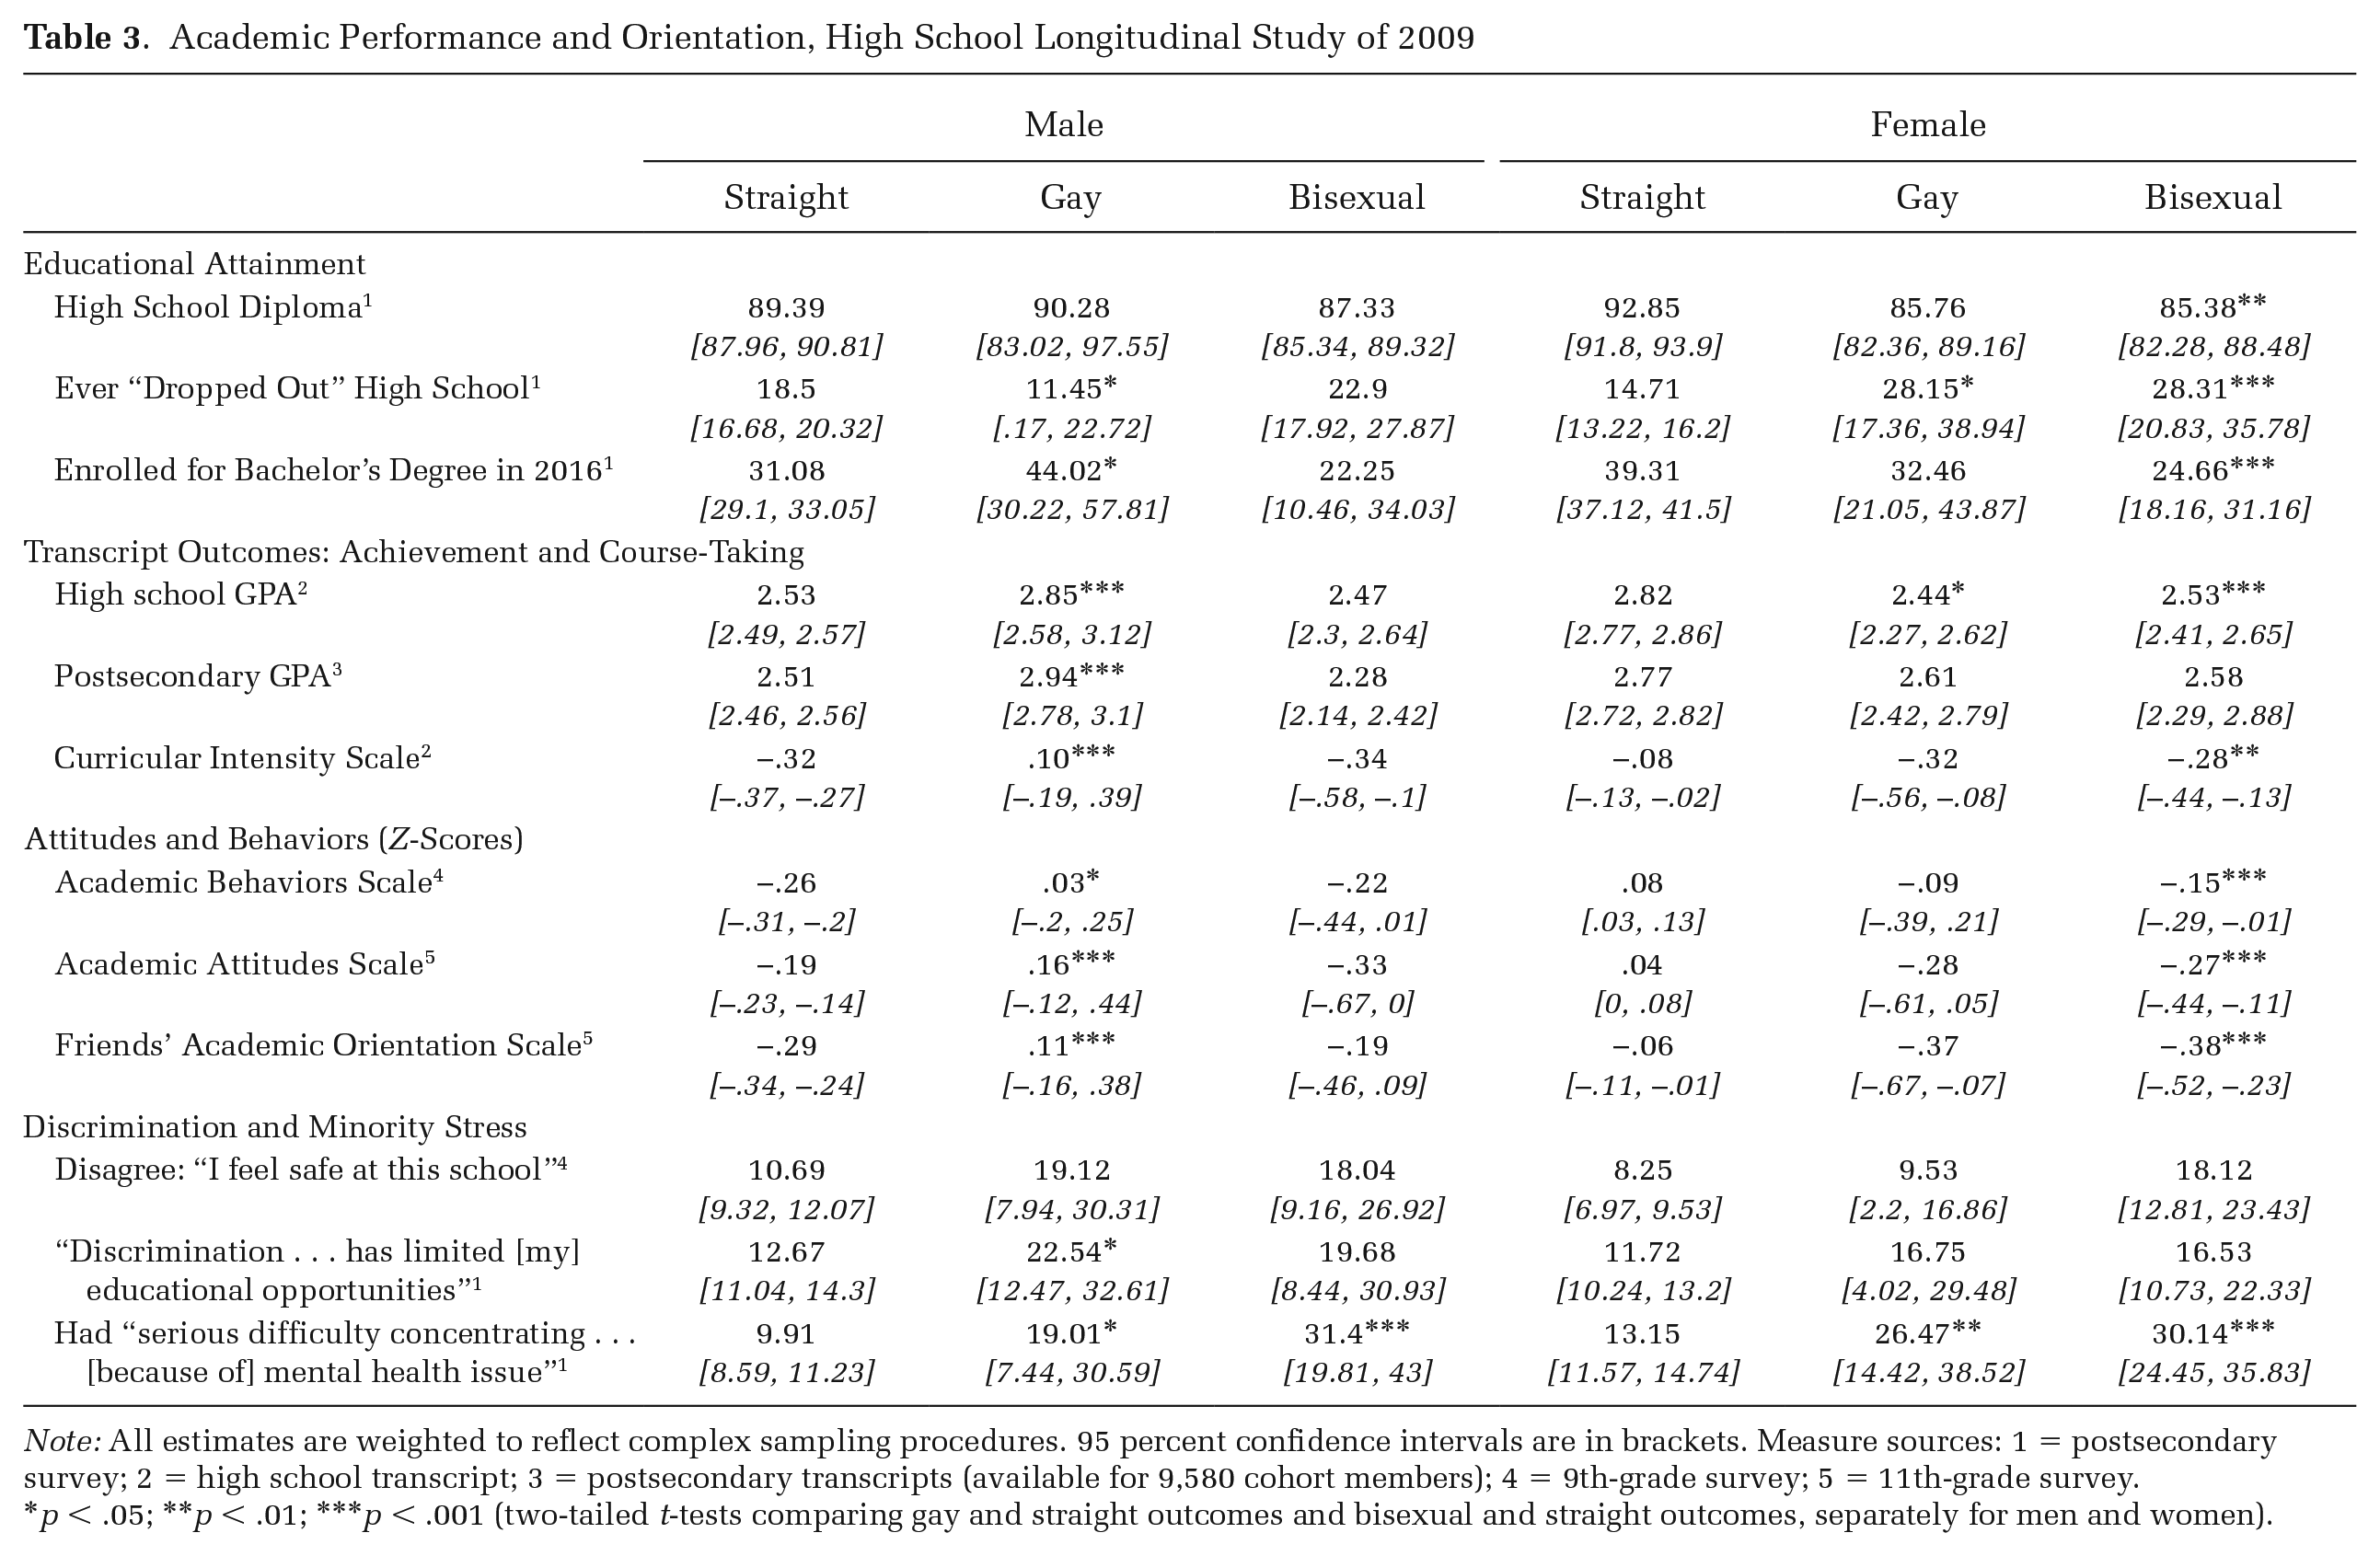
Note: All estimates are weighted to reflect complex sampling procedures. 95 percent confidence intervals are in brackets. Measure sources: 1 = postsecondary survey; 2 = high school transcript; 3 = postsecondary transcripts (available for 9,580 cohort members); 4 = 9th-grade survey; 5 = 11th-grade survey.
p < .05; **p < .01; ***p < .001 (two-tailed t-tests comparing gay and straight outcomes and bisexual and straight outcomes, separately for men and women).
Regression-Adjusted Estimates
To examine these descriptive results more fully, I estimate a series of survey-weighted ordinary least squares regression models controlling for students’ race/ethnicity (White, Black, Hispanic, Asian, Native American, and other), native English-speaking, and a composite measure of socioeconomic status, constructed by NCES using both parents’ education, income, and occupation. To control for unmeasured aspects of students’ school and local contexts, I include school fixed effects in all models. To facilitate the presentation of a wide range of outcomes, Figure 6 presents the two-way interaction of sex-by-sexuality in terms of average marginal effects, focusing on the estimated disparities between LGB and straight women and men.
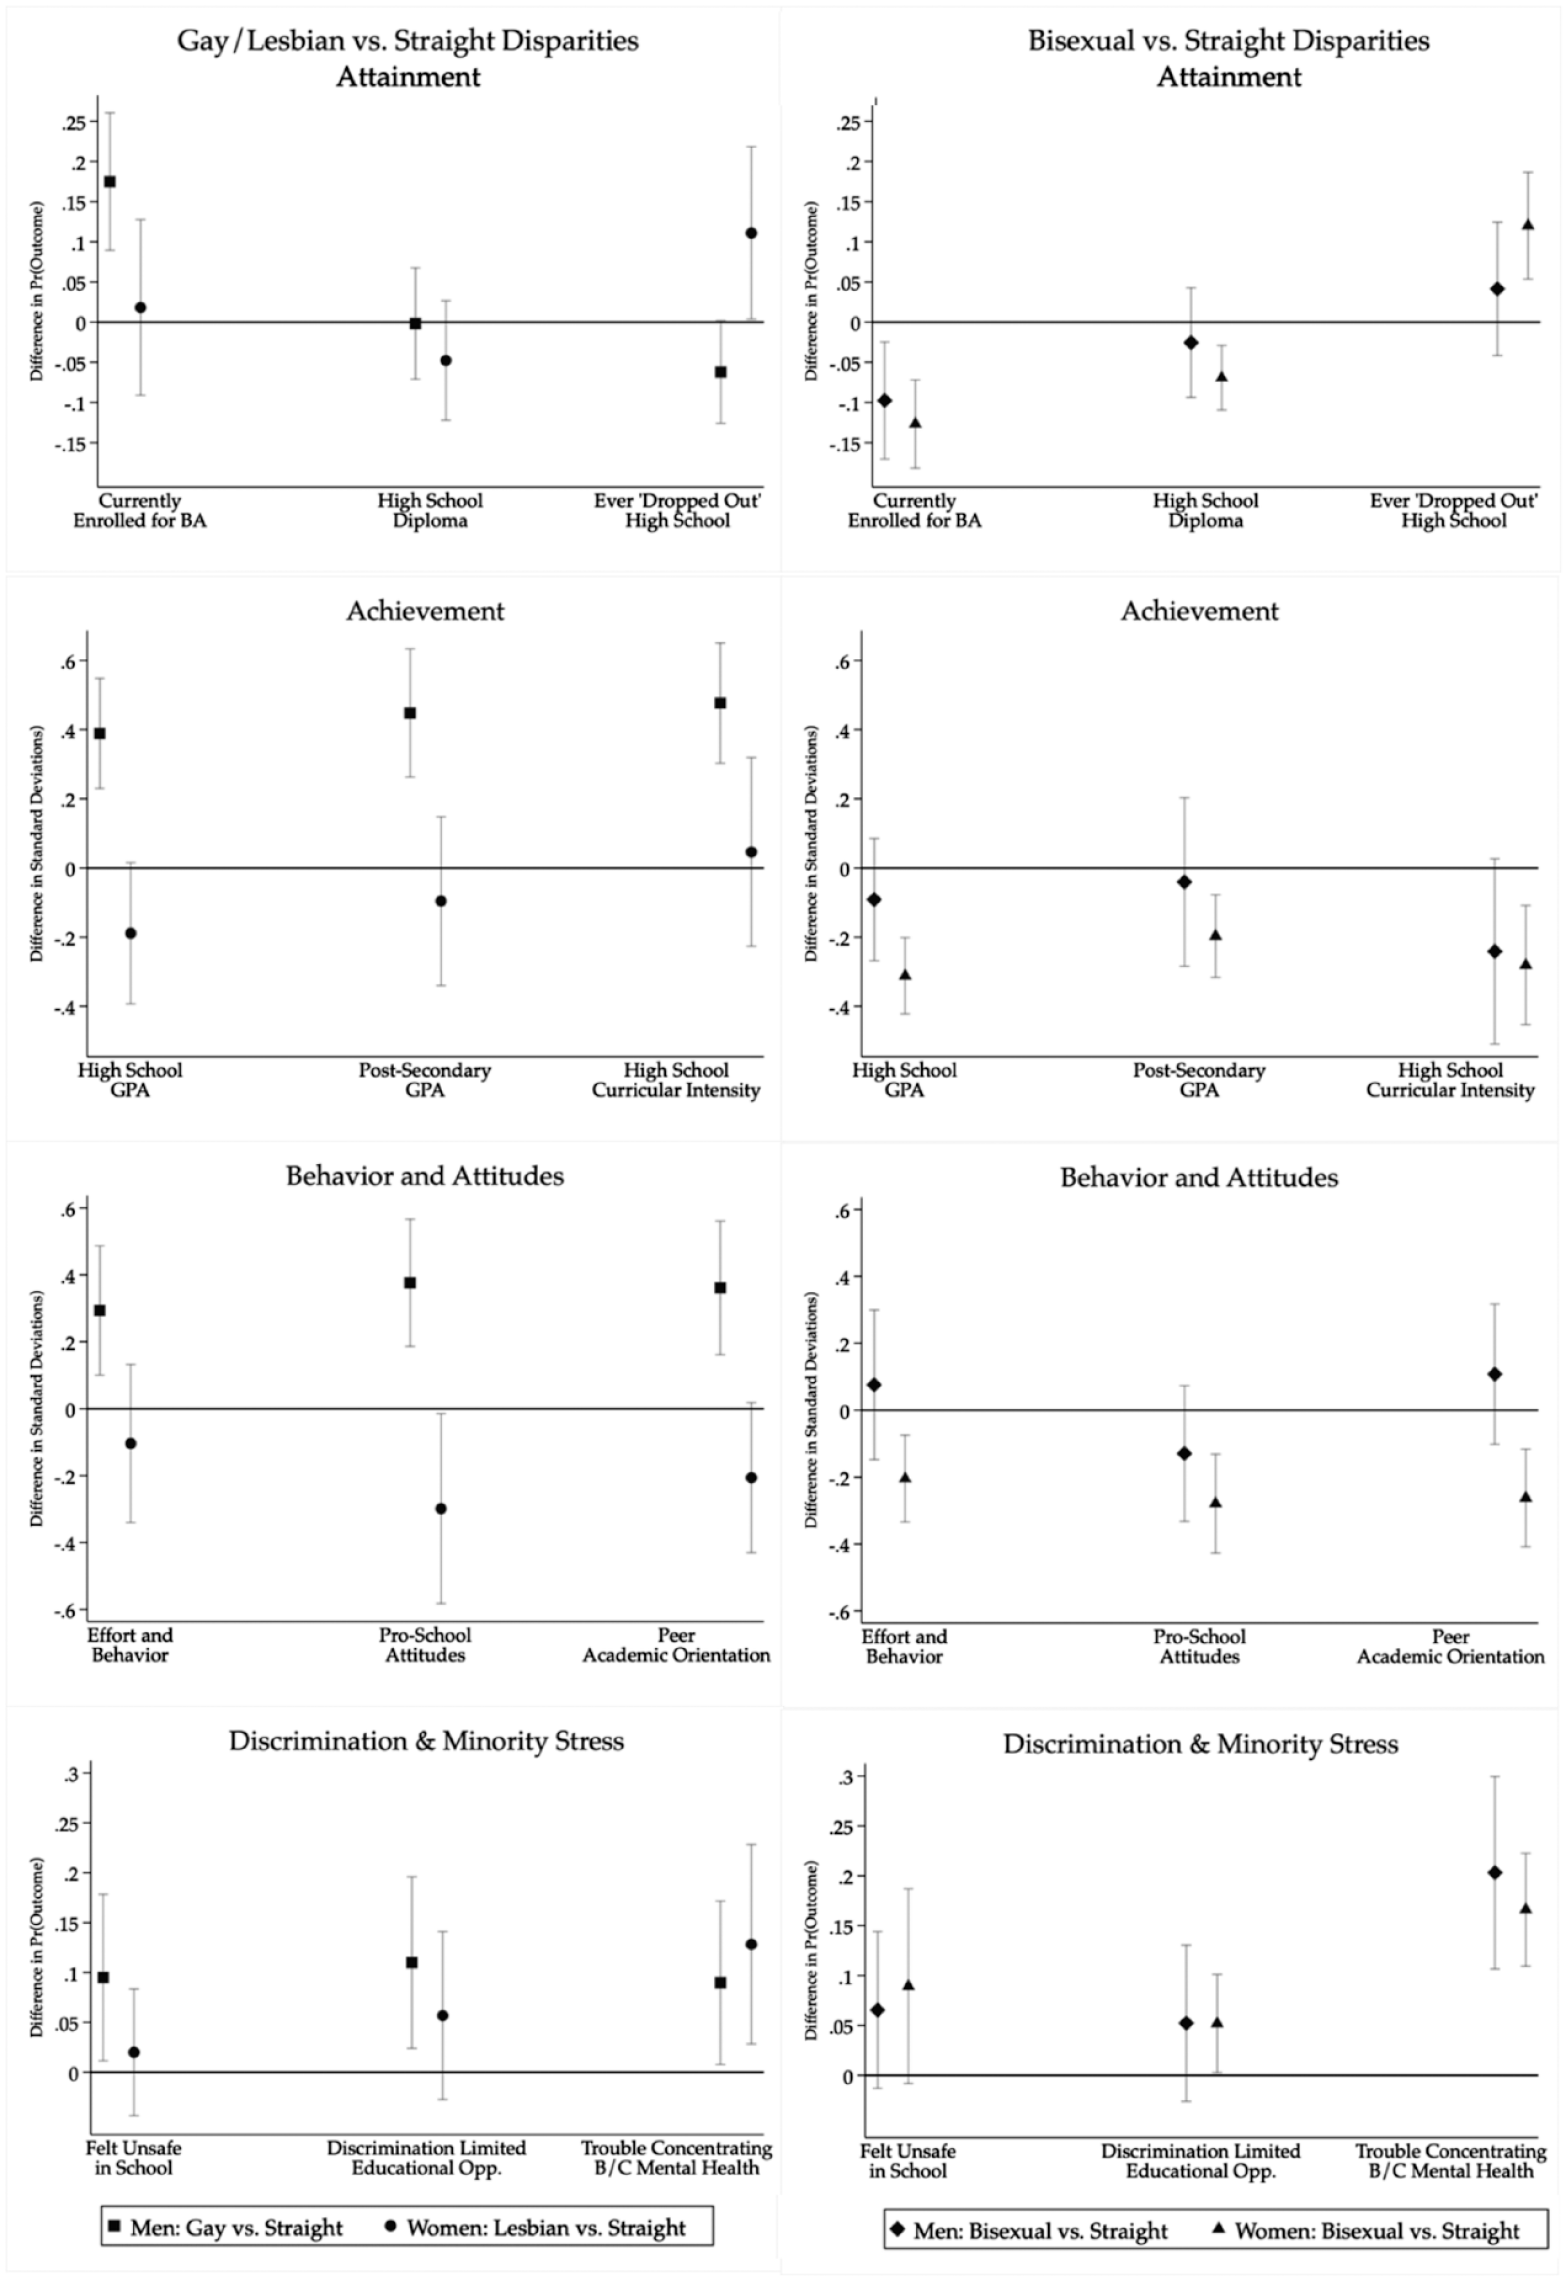
LGB versus Straight Disparities: High School Longitudinal Study of 2009
Figure 6 reveals a number of important facts. First, these results demonstrate the breadth of gay boys’ academic advantages. Compared to observably similar straight boys from the same high school, gay boys earn substantially better grades in more advanced courses, draw on more committed work habits, endorse more pro-school attitudes, and connect with more academically oriented close friends (all differences p < .001). Accordingly, gay boys’ ultimate bachelor’s degree enrollment rates are about 18 percentage points higher than the straight boys from their high schools. As in the adult population, the magnitude of these advantages is striking. For instance, in the HSLS data, gay boys’ 18 percentage-point bachelor’s degree enrollment advantage is more than double the size of the overall female versus male enrollment advantage (8 percentage points).
Second, compared to observably similar straight girls from the same high school, lesbian girls are broadly disadvantaged, although not all disparities reach statistical significance. Compared to straight girls, lesbians receive worse grades (p = .07) and appear to be much more alienated from the culture of their schools, reporting less pro-school attitudes (p < .05) and fewer academically oriented friends (p = .07). Most troublingly, lesbian girls report “dropping out” of high school at substantially higher rates: an estimated 26 percent of lesbian girls report having dropped out at least once, surpassing straight girls by 11 percentage points (p < .05).
Third, unlike the clear divide between gay boys and lesbian girls, bisexual boys and bisexual girls are generally disadvantaged compared to their straight schoolmates. These disadvantages are particularly pronounced for bisexual girls, who report statistically significant disadvantages for every academic outcome considered. For bisexual boys, the pattern of results is more complex. For several outcomes from high school, bisexual boys are almost at parity with straight boys. Nevertheless, something seems to intervene in bisexual boys’ lives that prevents them from translating high school performance into postsecondary enrollment. Compared to observably similar straight boys from the same high school, bisexual boys were about 10 percentage points less likely (p < .01) to be enrolled for a bachelor’s degree at the time of the postsecondary survey.
Finally, Figure 6 underscores the dramatic divide between academic and non-academic outcomes for LGB students. Although not every disparity reaches statistical significance, each group of LGB students reports enduring higher levels of discrimination and minority stress than those reported by their straight schoolmates. The results in Figure 6 are especially notable for gay boys, given their high levels of academic success. These results show gay boys’ academic advantage is domain-specific and should not be interpreted as implying that their social experience of high school is any easier than that documented by previous research (e.g., Pascoe 2007; Toomey and Russell 2016).
Summary of Study 2
Using the first NCES cohort study to assess student sexual orientation, Study 2 illustrates that sexuality is a consequential axis of academic inequality among contemporary U.S. high schoolers. In most regards, the HSLS results extend and reinforce the patterns documented in Study 1. Among boys, the academic successes of gay men documented in Study 1 persist in a more recent cohort and extend across a wide range of academic outcomes. In high school, bisexual boys performed similarly to their straight schoolmates, but after high school, they enrolled in college at significantly lower rates. Among girls, both lesbian and bisexual women are broadly disadvantaged across academic outcomes. Finally, despite their very different academic outcomes, I find that all groups of LGB students report elevated rates of discrimination and minority stress.
Sensitivity Analyses: Can Results Be Explained By Selective Reporting Of Lgb Identities?
Together, these two studies provide strong evidence that sexual identity consequentially stratifies academic outcomes. Before providing a substantive interpretation of these results, I address an alternative concern: Could the results reflect something about who is reporting an LGB identity rather than something about sexuality itself? I address two forms of this concern, presenting full analyses in the online supplement but briefly describing the core results here.
First, I note that—alongside sexual attraction and sexual behavior—sexual identity is just one dimension of sexuality (Mishel 2019). Moreover, sexual identity labels may not have the same meaning and resonance across populations (Silva 2019). Therefore, perhaps my results simply reflect the differential salience of a “gay,” “lesbian,” or “bisexual” identity label among different groups. To address this concern, I replicate my Study 1 analyses using a five-option sexual attraction measure included in the NSDUH (see the online supplement). Results using this attraction measure of sexuality closely replicate the identity results presented above: not just overall, but also by race/ethnicity and birth cohort.
The second issue around selective reporting is a more traditional concern about selection bias. Given gay men’s striking educational advantages, one might worry that some unmeasured selection process relates gay identification with college completion. One could imagine, for instance, that successfully reaching higher education affords gay men a certain freedom that makes them more willing to report their sexual identity. Or, more fundamentally, perhaps the college experience actually reshapes men’s sense of sexual possibility, affecting their underlying identity itself and not just their willingness to report that identity. In either case, I could be “selecting on the dependent variable” of academic success.
I address this concern in two ways. First, I stratify the HSLS sample by bachelor’s degree enrollment, reanalyzing gay boys’ academic outcomes within two distinct groups: those who did make it to college by the latest survey and those who did not. If gay men’s apparent successes in high school were driven only by the differential “coming out” of those who made it to college, then conditioning on college enrollment would neutralize these effects. Second, I draw on an entirely separate dataset constituted only by recent college graduates: the 2016/17 Baccalaureate and Beyond Longitudinal Study (B&B:16/17). Within this nationally representative sample of students who completed bachelor’s degrees in 2015 to 2016 (N =19,490), I analyze students’ college GPAs (as reported on their official transcripts) alongside their sexual identities (as reported in the B&B:16/17 baseline survey). Across all analyses, gay men maintain statistically significant, substantively large academic advantages (see the online supplement). In the B&B:16/17, for example, gay men’s college GPA advantage over straight men is .15 points (p < .001), more than double the magnitude of the GPA advantage associated with having at least one college-educated parent (.06 points).
Together, these sensitivity analyses do not exhaust the tests one might consider. Still, I argue they are sufficient to establish it is unlikely this study’s results are simply an artifact of imperfect or selectively reported measures of sexuality. Instead, I believe the body of evidence presented here reflects something real about the lived experience of gender and sexuality in the United States. I turn to this argument now.
Explaining LGB Outcomes: A “Gender Predictive” Approach
Describing the Approach
The current study demonstrates that sexuality does not stand alone as a single and separate source of academic advantage or disadvantage. Instead, sexuality shapes school success primarily in its intersection with gender, particularly between gay boys and lesbian girls. These results are consistent with the possibility put forward earlier: for boys, a felt distance from masculinity may be academically beneficial, but for girls, alienation from femininity could be academically risky.
How might one test this possibility? Within psychology, the development and analysis of “masculinity” and “femininity” scales has a long history (e.g., Bem 1974; Terman and Miles 1936). Sociologists, however, have been rightfully skeptical of such approaches, noting that they rely on inventories of contextually-specific gender stereotypes (Magliozzi, Saperstein, and Westbrook 2016), and they treat as individual attributes what are actually the unequal results of collective processes (Connell 1987).
A more promising alternative, first proposed by Lippa and Connelly (1990), is the “gender diagnosticity” approach. Rather than imposing prespecified scales thought to distinguish men from women, the gender diagnostic approach uses existing survey items that, empirically, do show large male/female differences. The goal is appealingly modest: to identify items that “differentiate men and women in a particular population . . . mak[ing] no assumptions as to why specific behaviors serve to probabilistically predict an individual’s gender in such populations” (Lippa and Connelly 1990:1053). Given its attention to contingent social contexts and its agnosticism with respect to the ultimate causes of male-female differences, the gender diagnostic approach provides a sociologically-informed way to repurpose existing survey items to generate continuous measures of gender typicality.
Following Cleveland, Udry, and Chantala’s (2001) demonstration of this approach in the Add Health student survey data, a number of Add Health studies have examined gender typicality defined in this way (e.g., Fleming, Harris, and Halpern 2017; Ueno and McWilliams 2010). Notably, Yavorsky and Buchmann (2019) demonstrate the promise of this approach for studies of educational stratification. Using 12 items in the Add Health Wave I survey that show large sex differences, Yavorksy and Buchmann (2019) estimate a logistic regression to assign each respondent a probability of being a male. Over and above binary sex, they find this probability consequentially stratifies students’ GPAs.
Although they do not necessarily frame their approach as such, these studies treat gender typicality as a prediction task: given some vector of inputs,
Unlike current gender diagnosticity approaches—which rely on manual comparisons of survey items and select only a small number of variables based on statistical significance cutoffs—SML provides a principled way to easily automate the variable selection process and, ultimately, to draw on a much larger set of variables (including, potentially, their higher-order transformations and complex interactions). With reference to the setup above, SML allows a wider range of function classes, f(X), to automatically analyze the entire input vector,
As with gender diagnosticity approaches more broadly, this approach—what I call a “gender predictive” approach—is not without limitations. Still, for quantitative studies of gender inequality, I propose that a gender predictive approach provides an easily implemented and broadly applicable way to repurpose existing survey data so that continuous distributions of gendered outcomes can be presented alongside binary male/female differences.
Applying the Approach
To illustrate this approach, I predict whether HSLS students reported their assigned sex was male using their full set of responses to the 9th- and 11th-grade surveys. 6 If the goal is simply to generate predictions given a vector of survey responses, then any number of SML approaches could be applied. In this context, I turn to Least Absolute Shrinkage and Selection Operator (lasso) logistic regressions. Perhaps the most well-established SML method among social scientists (Bucca and Urbina 2021), lasso regressions offer two key advantages over more complex SML approaches (e.g., neural nets or classification trees). First, lasso regressions still provide regression coefficients for all selected predictors, providing a face-validity test that is not possible with more complex, black-box approaches. Second, lasso regressions are easily implemented in all statistical software programs and provide a natural extension of the regression methods already used in sociological research. Part of a class of functions called penalized regressions, lasso regressions balance overfitting and underfitting by iteratively drawing on a large number of variables while shrinking their coefficients toward zero (for a more complete overview, see Bucca and Urbina 2021).
Of the roughly 7,000 answer choices available across 759 questions, the lasso selected a total of 1,132 distinct answer choices to include in the model. Table 4 presents the 10 answer choices the lasso identified as most predictive of student sex in the HSLS; Table S1 in the online supplement presents the top 50 answer choices.
Gender Predictability: Top 10 Answer Choices Most Predictive of Being Male in the HSLS
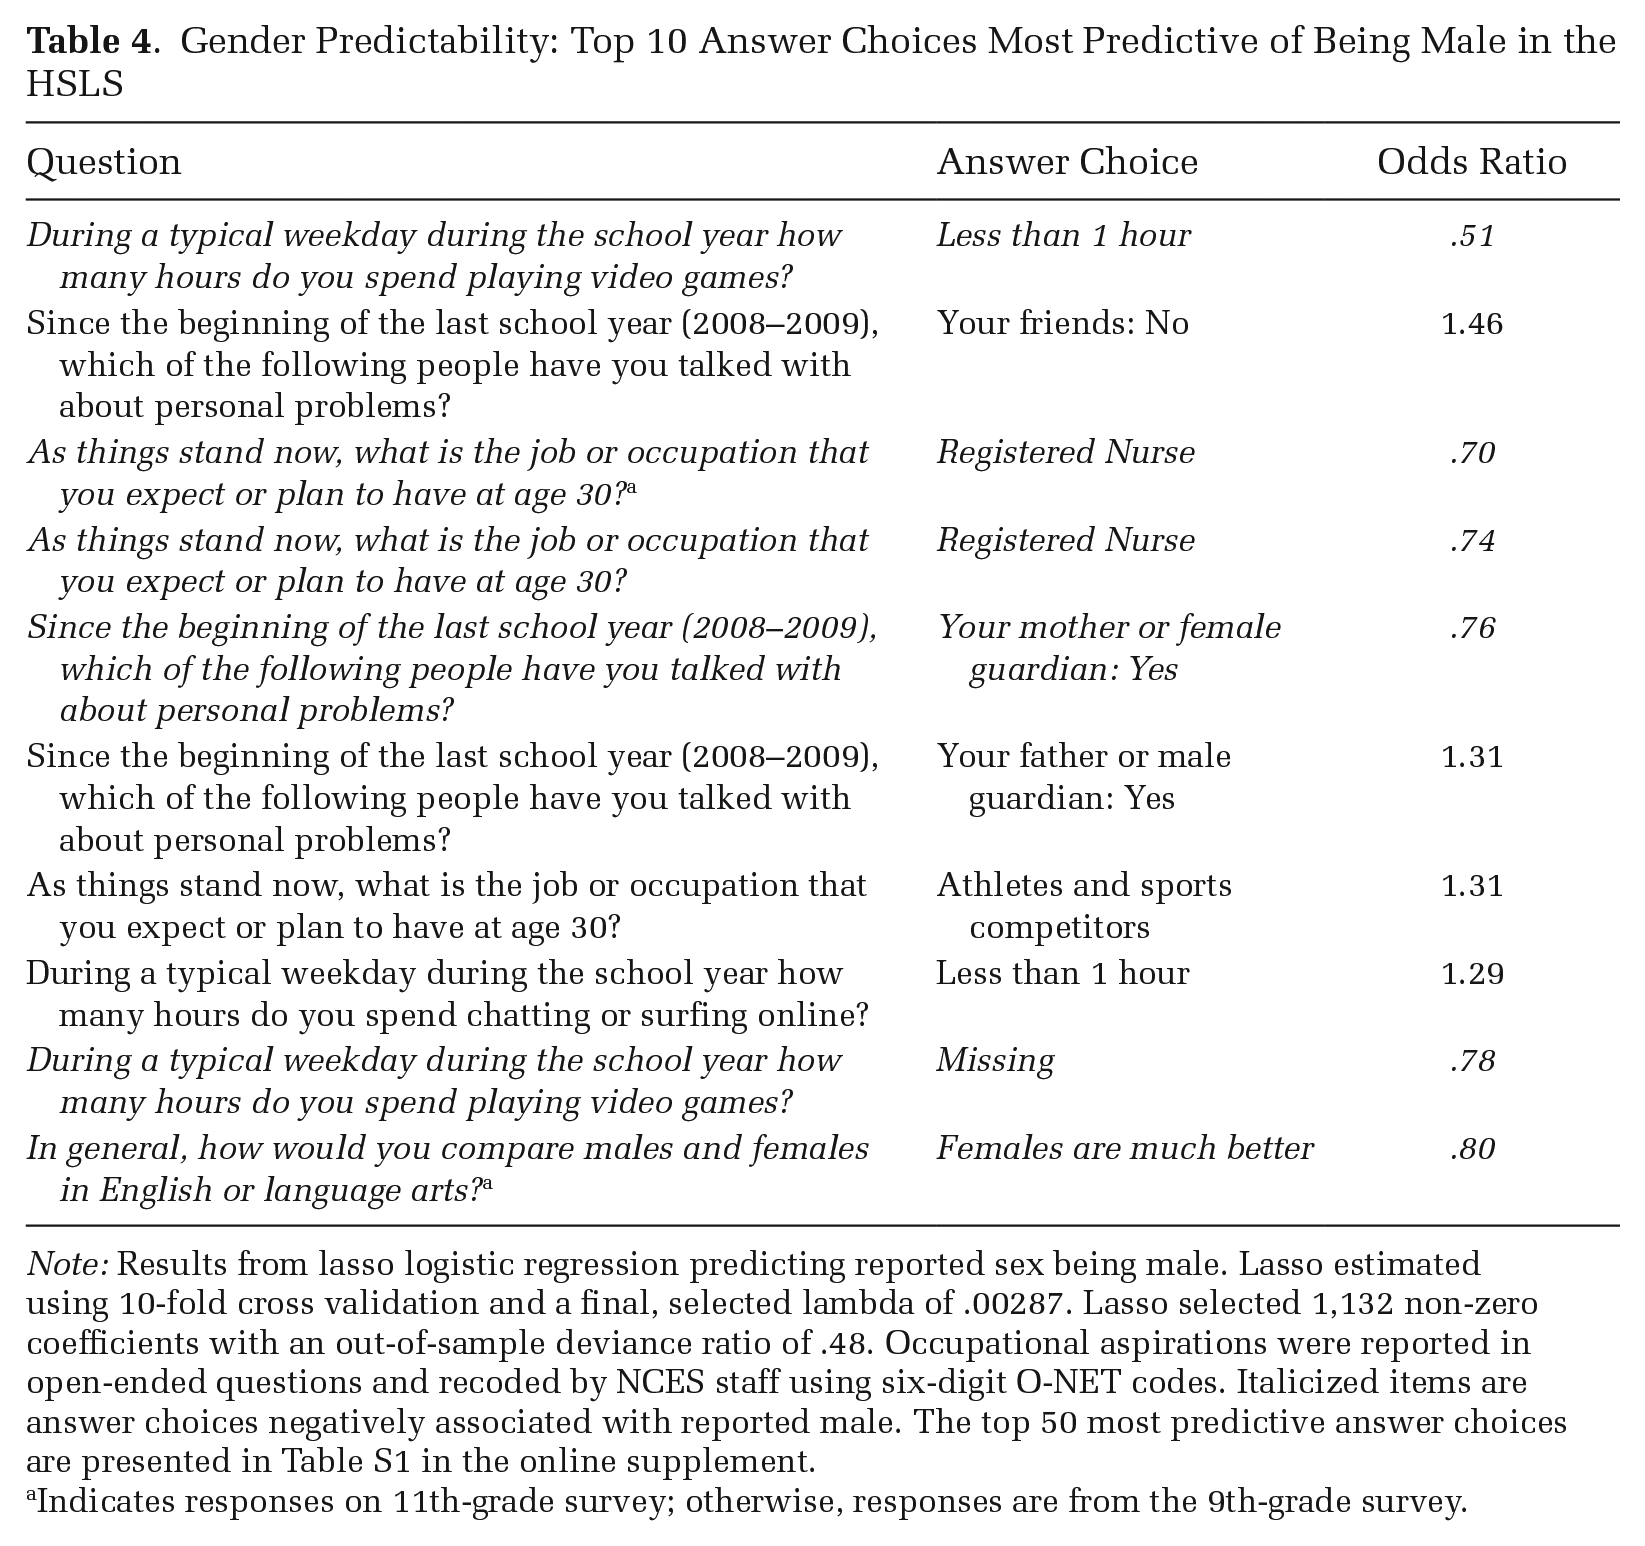
Note: Results from lasso logistic regression predicting reported sex being male. Lasso estimated using 10-fold cross validation and a final, selected lambda of .00287. Lasso selected 1,132 non-zero coefficients with an out-of-sample deviance ratio of .48. Occupational aspirations were reported in open-ended questions and recoded by NCES staff using six-digit O-NET codes. Italicized items are answer choices negatively associated with reported male. The top 50 most predictive answer choices are presented in Table S1 in the online supplement.
Indicates responses on 11th-grade survey; otherwise, responses are from the 9th-grade survey.
Although the specific coefficient values produced by penalized regressions should be interpreted with caution (Molina and Garip 2019), the general rank-ordering here provides an illustrative face validity check. As a summary of U.S. masculinity, it seems reasonable to say adolescent boys do play videogames, do not talk to their friends about their personal problems, and do imagine themselves as future professional athletes.
Next, Figure 7 plots students’ average predicted probability of being male, separately by sex and LGB identity; Figure S4 in the online supplement presents the full distribution of these predicted probabilities. As expected, these results show LGB respondents were, in fact, more gender atypical in their survey responses than their straight peers. Indeed, the patterns in Figure 7 are strikingly similar to those reported on the direct measure of gender expression summarized in Figure 1. Just as in Figure 1, gay/lesbian respondents are more atypical than bisexuals and, of all groups, gay boys deviate the most, on average, from their straight peers.
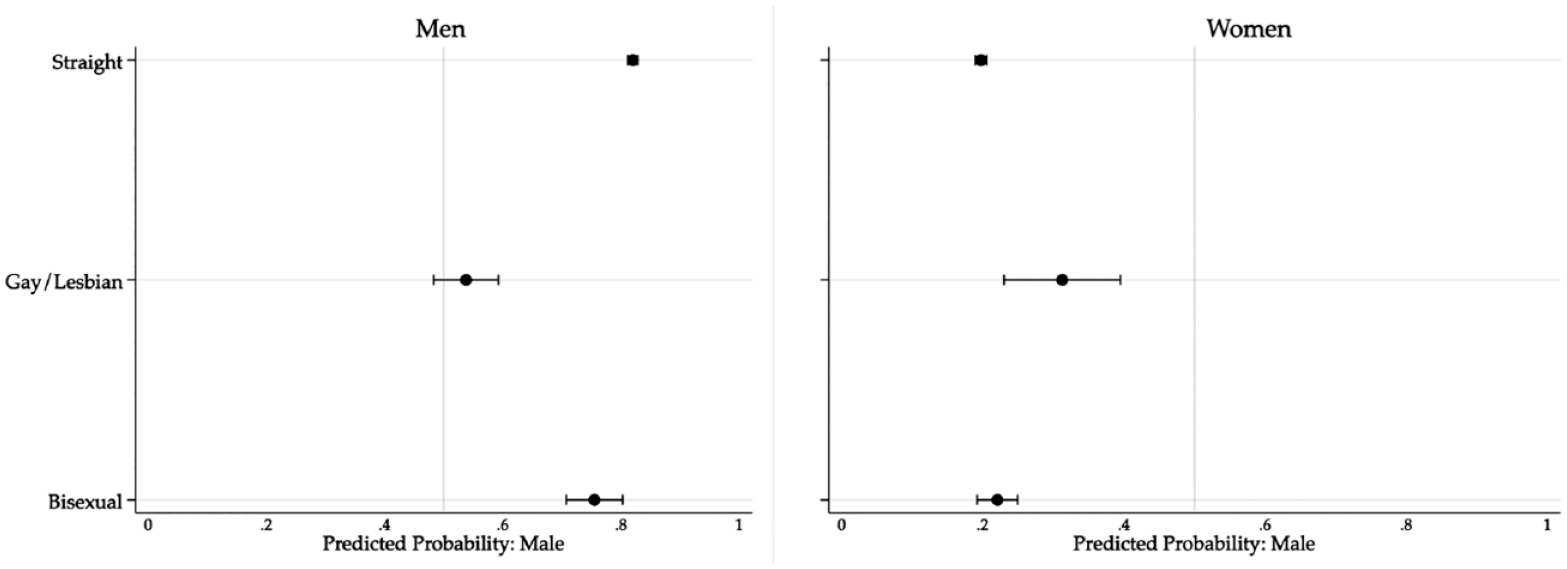
Gender Predictability: Estimated Gender Typicality by Sex and Sexuality in HSLS
How does gender atypicality shape students’ outcomes? To answer this question, Figure 8 presents kernel-weighted local polynomial regressions of two key outcomes—high school GPA and reported discrimination—plotted against a measure of gender atypicality. Following Yavorsky and Buchmann (2019), I define atypicality, for women, as the predicted probability of being male and, for men, as one minus this predicted probability. Consistent with the framework outlined earlier, these results show that, for academic performance, gender atypicality is beneficial for boys but costly for girls. However, this effect is domain-specific: as a risk factor for discrimination, gender atypicality is risky for both boys and girls.
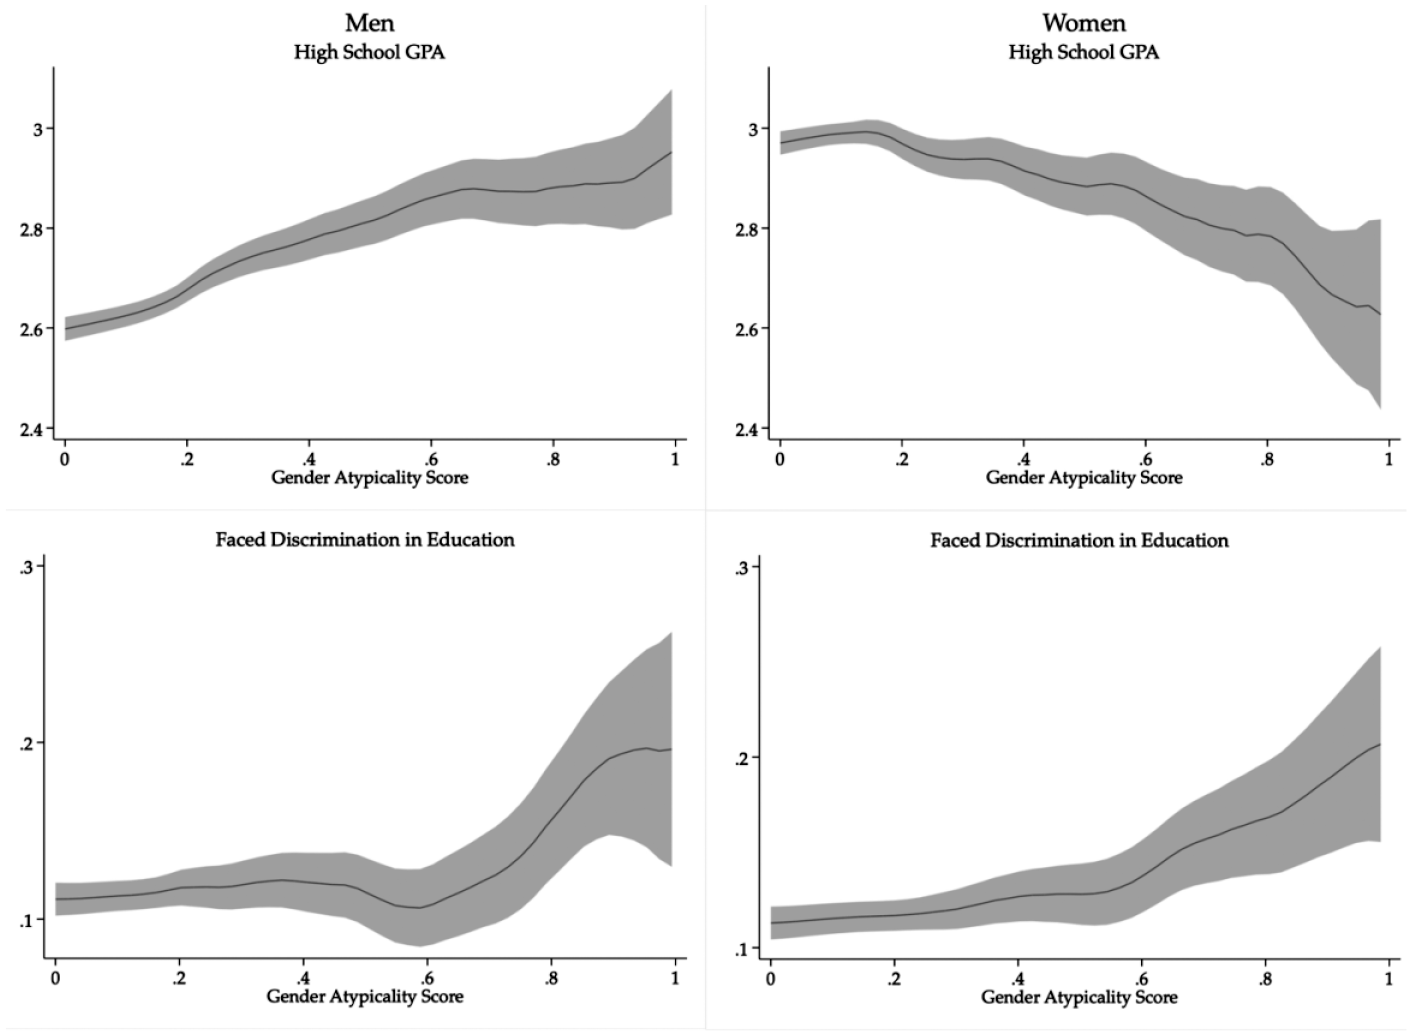
Plotting Selected Outcomes by Predicted Gender Atypicality: HSLS
So far, these results demonstrate two key facts. First, gender atypicality asymmetrically shapes boys’ and girls’ academic performance. Second, bisexual—and, especially, gay and lesbian—students are more gender atypical than their straight peers. As a final step, I directly explore whether LGB students’ gender atypicality helps explain their high school GPAs. To do this, I re-estimate the main HSLS regression models, separately by sex, with and without controls for gender atypicality. Table 5 presents these results.
Gender Atypicality and LGB Students’ High School GPA: HSLS
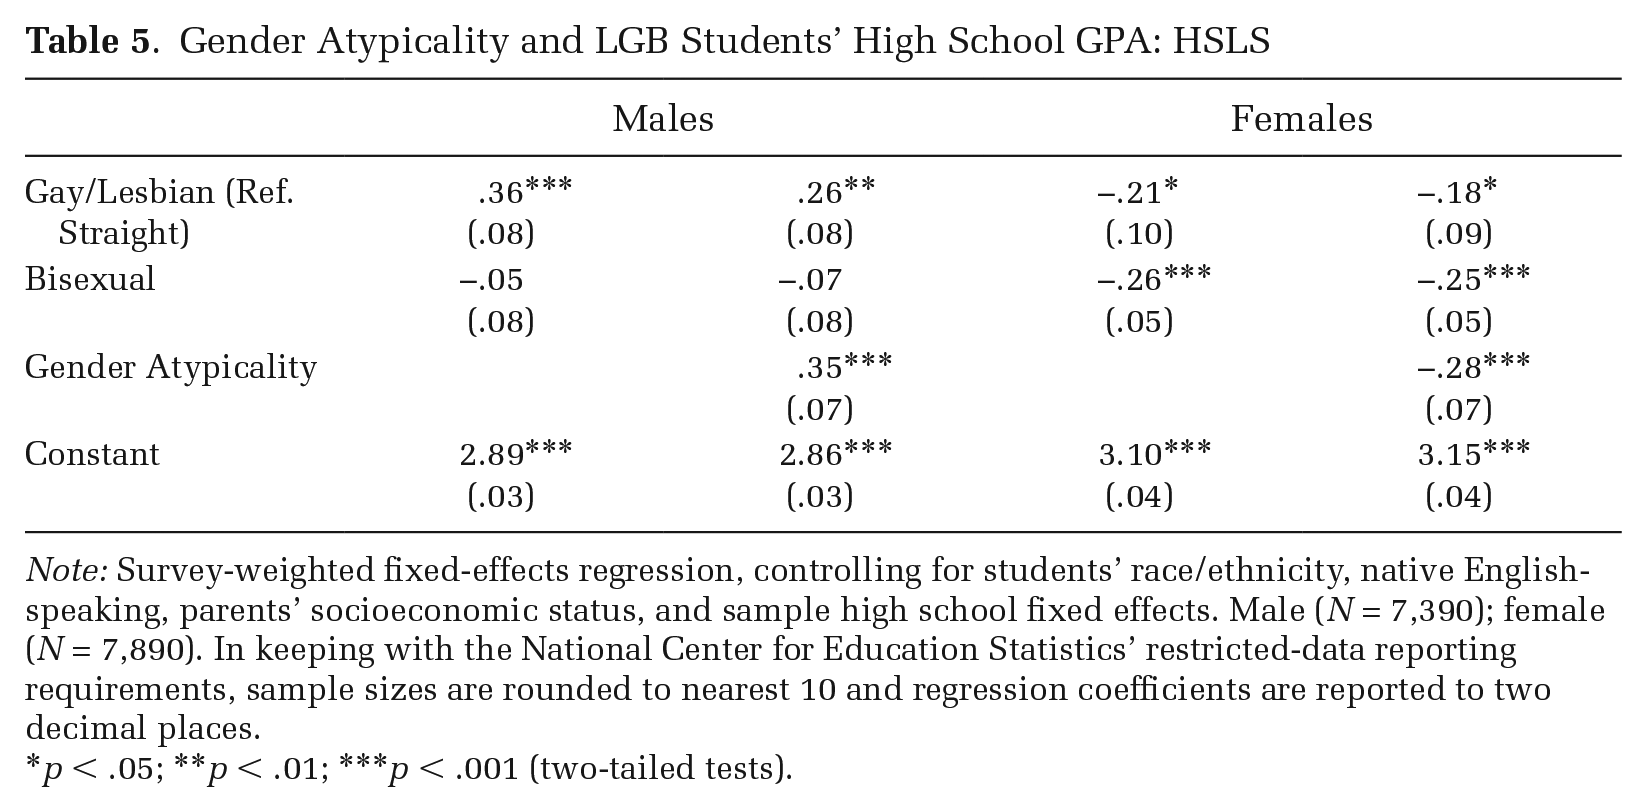
Note: Survey-weighted fixed-effects regression, controlling for students’ race/ethnicity, native English-speaking, parents’ socioeconomic status, and sample high school fixed effects. Male (N = 7,390); female (N = 7,890). In keeping with the National Center for Education Statistics’ restricted-data reporting requirements, sample sizes are rounded to nearest 10 and regression coefficients are reported to two decimal places.
p < .05; **p < .01; ***p < .001 (two-tailed tests).
The results in Table 5 show that—over and above binary sex, sexual identity, race/ethnicity, nativity, and parents’ socioeconomic status—gender atypicality is a highly significant (p < .001) predictor of students’ high school GPAs. Moreover, for gay boys and lesbian girls, gender atypicality goes a fair way in explaining their academic (dis)advantages. Controlling for gender atypicality reduces the magnitude of gay boys’ GPA advantage by about 28 percent and lesbian girls’ GPA disadvantage by about 14 percent. Nevertheless, both gay boys and lesbian girls still maintain statistically significant, substantively large (dis)advantages even after controlling for gender atypicality. By contrast, controlling for gender atypicality leaves bisexual students’ GPA disadvantages almost entirely unchanged. I more fully explore the implications of these results in the Discussion section.
Discussion
In her ethnography, Dude You’re A Fag: Masculinity and Sexuality in High School, Pascoe (2007) tells the story of Ricky. One of only three out gay boys at River High, Ricky’s sexuality and expansive gender expression marked him as a target for crushing “abuse at the hands of negligent adults, cruel teenagers and indifferent school administrators” (Pascoe 2007:65). Ricky’s isolation and victimization stands in stark contrast to the experiences of girls like Rebeca and Jessie. Two of several out lesbians at River High, these girls discovered that “gender and sexual non-normativity for girls can actually increase their social status” (Pascoe 2007:120).
The current study supports the ongoing relevance of Pascoe’s portrait of the social dynamics of U.S. high schools. I find, for example, that gay boys report feeling unsafe in school at about twice the rate of straight boys, but lesbian girls are just slightly more likely than straight girls to report feeling unsafe. However, by analyzing these social dynamics alongside academic outcomes, the current study shows this portrait is incomplete in important ways. For contemporary lesbian girls, I find that a comparatively safe social experience masks rather serious vulnerabilities in terms of academic success. At the same time, I show that gay boys’ well-documented victimization should be understood alongside their remarkable academic resilience.
In every dataset, across all birth cohorts, among White, Black, Hispanic, and Asian men, and along the full range of outcomes, I find that gay men achieve strikingly high levels of academic success. Some of contemporary gay men’s success appears to be explained by their distance from the kind of masculinity reported by their peers. Most of gay boys’ advantages, however, are left unexplained by this measure. Moreover, attributing gay men’s success to avoiding the problems of masculinity does not address the fact that, on many measures, gay men surpass not only straight men, but also straight women. What explains this dynamic?
I propose that gay boys’ felt distance from hegemonic masculinity not only allows them to avoid the academic costs of masculinity, it also encourages them to pursue especially high levels of academic success. From an early age, gay boys face compounding status threats. Persistent cultural sexism leaves all boys’ masculinity “exquisitely fragile” (Meadow 2018:21), and enduring heterosexism leaves all boys’ heterosexuality “especially precarious” (Mize and Manago 2018:315). Growing up, gay boys discover themselves on the wrong side of both of these intersecting divides. In academics, they may find one adaptative way of responding to these status threats.
Academic performance offers an accessible domain of competitive self-mastery. Whereas the rules of masculinity may feel obscure or unattainable, the rules of school can feel discrete and manageable. The approval of a parent may be uncertain, but the praise of a teacher can be regularly earned with the right amount of effort. And when other avenues for “being a man” are cut off, pursuing the kinds of prestigious careers made possible through meticulously high achievement offers a way to shore up one’s standing as a man. In these ways, my results provide population-level support for what Pachankis and Hatzenbuehler (2013:177) call the “Best Little Boy in the World” hypothesis: that gay boys “learn to deflect attention away from their concealed stigma through overcompensation in achievement-related domains.”
In contrast to gay men’s consistent advantages, I find that lesbian women’s academic outcomes varied substantially by birth cohort and race/ethnicity. Within the entire population of U.S. adult women, lesbian women have significantly higher levels of bachelor’s degree attainment than do straight women. On closer examination, though, this overall advantage is concentrated entirely among women from earlier birth cohorts. And when I examined lesbian women separately by race/ethnicity, I found that the bachelor’s degree advantage that historically accrued to lesbian women was concentrated among White lesbians. Larger sample sizes are needed to estimate the full four-way interaction of sex-by-sexuality-by-race/ethnicity-by-birth cohort, but it seems that lesbian women’s overall bachelor’s degree advantage is driven primarily by older cohorts of White lesbian women. What accounts for these patterns?
I propose that lesbian women’s changing educational attainments offer a certain “outsider within” perspective (Collins 1986) on the broader “gender revolution” of the twentieth century. For much of the twentieth century, heteropatriarchal laws and norms required women to limit their education in deference to the constraints of early marriage, childrearing, and economic dependence on a male provider. Lesbian women’s marginalization from this gender regime would have provided many reasons to pursue higher education. Refusing to be reliant on a man for income, lesbian women could have sought out college degrees to increase their earning potential. Facing pressure to “settle down” into a straight marriage, higher education may have offered a recognizable path for forestalling the marital timeline imposed by others. Less likely to have their educational careers cut short by unintended fertility, lesbian women may have persisted in college when others were made to stop. Even so, not all lesbian women would have had the resources and freedom needed to capitalize on these shared reasons for higher education. Therefore, I propose that, when an earlier gender regime pushed lesbian women to pursue more education than straight women, it was the most advantaged lesbian women—disproportionately White lesbians—that best capitalized on those pressures.
In contemporary cohorts, the gender regime governing women’s education has changed profoundly: “a historic reversal” has occurred (England and Bearak 2012). Today, many of the external forces constraining women’s college completion have largely dissipated. Instead, the rapid “rise of women” has promoted the normative expectation that girls should pursue at least a college degree. Therefore, in the current moment, a skepticism toward the strictures and expectations of femininity may undercut academic investments among lesbian women. My analysis of gender atypicality and lesbian women’s academic performance provides some support for this idea: lesbian women’s distance from the kind of femininity reported by straight girls helps explain some—although not much—of their large GPA disadvantage. What might explain the rest?
I propose that, in contemporary cohorts, lesbian women’s academic achievement is suppressed by unequal treatment by school authorities. That is, I suspect lesbian students—especially those who enact “masculine” styles of speech, dress, and behavior—disproportionately face the kinds of “bad girl” penalties identified by previous research. Indeed, the HSLS data provide new evidence of lesbian girls’ substantial overrepresentation in exclusionary school discipline. Consistent with prior research (Mittleman 2018), Figure S5 in the online supplement shows lesbian girls are more than twice as likely (p < .05) to report having been suspended or expelled in the six months prior to their 11th-grade survey. Moreover, these higher rates of discipline are concentrated entirely among lesbians of color: among White girls, there is no difference in discipline rates between lesbian students and their straight schoolmates. The apparent specificity of these sanctions is consistent with the idea that hegemonic femininity is not just a gendered ideal, but a racialized ideal as well (Collins 2004; Hamilton et al. 2019). To the extent that girls of color are already scrutinized for failing to conform to a White “good girl” norm, any further deviations from feminine gender expression among lesbian students of color may be met with especially harsh penalties.
Bisexual men and women sit somewhat uneasily in this framework. Among all U.S. adults, I find that bisexual men and women earn college degrees at essentially the same rate as straight men and women. However, for recent cohorts of women—among whom bisexual identification is, by far, the highest—bisexual women are disadvantaged across the full range of academic outcomes. These disadvantages are generally smaller for bisexual men. However, in the HSLS cohort, bisexual boys report substantially lower rates of bachelor’s degree enrollment than do their straight schoolmates. How are we to explain these disadvantages?
To begin, I note that these patterns of bisexual academic disadvantage are directly in line with research on other life domains, such as labor market earnings (Mize 2016) and physical and mental health (Liu and Reczek 2021). In these areas, as in my results, bisexual individuals face considerable disadvantages, not just compared to the straight population but compared to gay and lesbian populations as well. These disadvantages are often attributed to the especially high levels of stigma, discrimination, and minority stress that bisexuals face (Liu and Reczek 2021; Mize 2016). The same dynamics may be at work here as well.
However, my results highlight one important complexity: the question of why bisexual women’s disadvantages largely follow lesbian women’s, but bisexual men’s outcomes diverge so sharply from gay men’s. It is not obvious how to interpret this result. One possibility suggested by my results and in line with prior research (e.g., Li et al. 2017) is that bisexual boys may be, on average, far more gender typical than gay boys. As such, bisexual boys may derive fewer of the academic benefits of gender atypicality even as they still face a heavy toll of stigma and discrimination. Therefore, for the bisexual population, identity-specific stressors may shape academic outcomes in a way that is largely independent of the crosscutting pressures of gender.
Still, the data assembled here provide reason to exercise a certain humility when interpreting the academic performance of the bisexual population. There are complex questions about how to account for the bisexual population’s outcomes at a time when bisexual identification is, itself, expanding in a very specific way: rapidly among young women, but not among men (England et al. 2016). The actively shifting and socially structured dynamics of bisexual identification complicate easy explanations for this population’s patterns. Future research, particularly qualitative research, should more fully investigate the mechanisms by which bisexual women and men are disadvantaged in U.S. schools.
Limitations and Implications for Future Research
These conclusions come with limitations that suggest several directions for future research. The most significant of these limitations is that, although I analyzed LGB populations, transgender and other queer populations remain beyond the scope of this article. Relying on binary sex measures, my analyses continue to be populated by “men” and “women,” “boys” and “girls.” Wilkinson, Shifrer, and Pearson (2021) provide important evidence on the academic outcomes of gender-diverse youth in the HSLS, and future work should continue to break down the gender binary that prevails in studies of educational stratification.
Another important limitation of the current study is that, while I have information on respondents’ sexual identities, I know nothing about how those identities manifest in respondents’ lives. For instance, I do not know whether respondents are “out” in their daily lives or the age at which they came out. I do not know whether their sexuality was met with stigma or support in their families, schools, and communities. All of these variations surely shape students’ academic experiences, but not in any one obvious direction. For example, gay boys in more stigmatizing environments may feel a greater drive for academic performance, such that those who are able to come out earlier in life might actually underperform compared to those who are forced to remain closeted.
The unavailability of these kinds of measures reveals the extent to which demographic research on LGBTQ populations is, in many ways, still in its infancy. All of the analyses in this study were only possible because public servants recently included sexual identity measures in a few key parts of the federal research apparatus. During the Obama administration, plans were finalized to include sexual identity and gender identity measures in a much larger, more consequential demographic survey: the 2018 American Community Survey. The size and breadth of those data would have profoundly expanded the possibilities for LGBTQ demographic research. Under Trump, these plans were canceled abruptly and without justification (Wang 2018). This erasure of LGBTQ Americans not only affects governments’ budget decisions and researchers’ opportunities. It also makes a fundamental statement about who we recognize and which lives we value: it structures a “recognition gap” of the kind Lamont (2018) compels us to close.
Conclusion
The question of how gender shapes academic performance has animated sociological research for decades. In the wake of the Covid-19 pandemic, this old question has taken on new meaning. Although the pandemic suppressed college enrollment among both men and women, the decline for men was seven times as steep (National Student Clearinghouse Research Center 2021). Given the benefits of higher education, finding ways to promote masculinities more compatible with educational attainment is an increasingly urgent social problem.
As questions of gender and school success continue to shape U.S. life in the years to come, this study provides new reasons for sociologists to heed a lesson long taught by queer theorists: any analysis of gender is incomplete without an analysis of sexuality. By making the margins of the academic gender order visible, LGB students allow us to see the spectrum of academic performance in a new light. Incorporating sexuality into the study of educational stratification, we find the persistent penalties for women who defy the dictates of hegemonic femininity and the tremendous possibilities for men outside the confines of hegemonic masculinity.
Supplemental Material
sj-pdf-1-asr-10.1177_00031224221075776 – Supplemental material for Intersecting the Academic Gender Gap: The Education of Lesbian, Gay, and Bisexual America
Supplemental material, sj-pdf-1-asr-10.1177_00031224221075776 for Intersecting the Academic Gender Gap: The Education of Lesbian, Gay, and Bisexual America by Joel Mittleman in American Sociological Review
Footnotes
Acknowledgements
This research benefited from the thoughtful feedback of the ASR editors and three anonymous reviewers, as well as Jennifer Jennings, Sanyu Mojola, Danya Lagos, Abigail Ocobock, Erin Metz McDonnell, Marta Tienda, Sara McLanahan, and seminar participants in Notre Dame’s Center for Research on Educational Opportunity. The analyses reported here would not be possible without the generations of researchers, activists, and public servants who have worked to make LGBTQ lives visible in population research.
Funding
The research reported here started at the Princeton University Office of Population Research, with support from the Eunice Kennedy Shriver National Institute of Child Health & Human Development of the National Institutes of Health under Award Number P2CHD047879.
Notes
References
Supplementary Material
Please find the following supplemental material available below.
For Open Access articles published under a Creative Commons License, all supplemental material carries the same license as the article it is associated with.
For non-Open Access articles published, all supplemental material carries a non-exclusive license, and permission requests for re-use of supplemental material or any part of supplemental material shall be sent directly to the copyright owner as specified in the copyright notice associated with the article.