
Abstract
Objective: The present study asks the question: What variables accounted for people’s tendencies to take steps to prepare for COVID-19 during the earliest stage of the pandemic? Data collection took place from March 6 to 11, 2020. In particular, the study examines variables that have been shown to predict health behavior in previous research outside the context of the present pandemic, including hope, optimism, perceived risk, fear, and mental health variables. Method: Participants (222 adults in 39 U.S. states) were recruited via Amazon Mechanical Turk. Online surveys included the Adult Hope Scale (AHS), Life Orientation Test (LOT-R), Health Anxiety Inventory (HAI), Depression, Anxiety, and Stress Scale (DASS-21), Impact of Events Scale (IES-R), and Positive and Negative Affect Schedule (PANAS). Also included were items inquiring about COVID-19 perceived mortality risk, fear/anxiety, and preparedness. Results and Conclusion: Participants were asked to imagine that COVID-19 had different hypothetical levels of mortality risk, ranging from 1 to 10 percent mortality (at the time of data collection, the WHO estimated actual mortality of the disease at approximately 3 percent). For each level, participants rated the degree to which they would be willing to take steps to prepare and protect themselves from the disease on a 7-point scale. Nearly 49 percent of participants said they would be relatively unlikely (i.e., provided a rating below the midpoint of the scale) to take steps to protect themselves if the mortality rate were at the 3 percent level. Stepwise multiple regression including the aforementioned predictors showed that three variables accounted for unique variance in participants’ levels of current preparedness: COVID-19 fear/anxiety, posttraumatic stress (as measured by the IES-R), and hope. Implications of these results are briefly discussed in the context of raising preparedness given that future public health crises are likely inevitable.
Coronavirus disease 2019 (COVID-19), first identified in late 2019, was officially characterized as a pandemic by the World Health Organization (WHO) on March 11, 2020. Although a great tragedy, COVID-19 also offered an opportunity to study factors that predict personal preparedness during a nascent public health crisis.
Data collection for the present study took place from March 6 to 11, 2020, an initial period of rapid spread of COVID-19. It was also a period of ambiguity regarding precautionary recommendations. Health authorities had not yet recommended mask usage and confusion existed in the media regarding ways to protect oneself. In the United States, people were concerned about widespread panic, there were shortages of groceries and cleaning supplies, and widely disseminated guidelines did not yet exist on how the public should prepare.
The present study asks the question: What variables accounted for the tendency to take steps to prepare for COVID-19 during this early stage of the pandemic? In particular, the study examines variables that have been shown to predict health behavior in previous research outside the context of the present pandemic. These include hope, optimism, perceived risk, fear, and mental health variables. Each of these factors is briefly summarized here.
The most widely researched model of hope in the psychology literature is Snyder’s (2002) Hope Theory, which conceptualizes the construct as a trait-like goal-directed expectancy composed of two inter-related components: agency and pathways. Agency consists of thoughts regarding one’s ability to initiate and sustain movement toward desired goals. As in Watty Piper’s (1978) children’s book The Little Engine that Could, agency thoughts like “I think I can” provide motivation, particularly when facing setbacks. Pathways are plans or strategies people believe will lead to goals. High-hope individuals produce more pathways (Snyder, 2002) and accomplish their goals more frequently than their low-hope counterparts (Feldman et al., 2009).
Past research shows that hope, conceptualized in this way, is associated with a variety of health-promoting behaviors, including being a non-smoker (Berg et al., 2012), regular physical activity (Anderson & Feldman, 2020), consuming fruits and vegetables (Nollen et al., 2008), and other salutary dietary behaviors (e.g., limiting fat intake; Berg et al., 2011; Nothwehr et al., 2013). Hope interacts with cardiovascular disease knowledge to predict reduced salt and fat intake as well as attending preventative physician visits (Feldman & Sills, 2013). Following injury, higher hope also predicts compliance with rehabilitation regimens (Lu & Hsu, 2013; Kortte et al., 2012).
A construct related to hope is dispositional optimism (Scheier et al., 1994). Past research has shown that optimism predicts regular physical activity and better nutrition (Holahan & Suzuki, 2006), being a non-smoker (Steptoe et al., 2006), and adherence to rehabilitation guidelines in cardiac patients (Schroder & Schwarzer, 2005), among other health-promoting behaviors. It should be noted, however, that optimism and hope conceptually differ. Optimism is a generalized expectancy that a positive future will occur irrespective of one’s actions (Scheier et al., 1994), whereas hope explicitly involves personal planning (pathways) and motivation (agency). Because of hope’s more proactive stance, some have suggested that in situations involving a degree of personal control, hope may more strongly predict outcomes than optimism (Rand et al., 2011). For this reason, both hope and optimism have been included as potential predictors in the present study with regard to explaining variance in COVID-19 preparedness.
Within the Health Belief Model (HBM; Janz & Becker, 1984; Rosenstock, 1974) and Protection Motivation Theory (PMT; Rogers, 1983; Rogers & Prentice-Dunn, 1997), perceived risk is theorized to be another predictor of health-promoting behavior, an assertion supported by numerous studies (see Brewer et al., 2007). For instance, greater perceived risk of diabetes has been shown to predict healthier dietary intake and greater exercise (Fischetti, 2015), greater perceived risk associated with substance use has been shown to predict lower rates of use (Ojeda et al., 2008), and greater perceived risk associated with texting while driving has been shown to predict less texting behavior (Hallett et al., 2012).
In addition to the cognitive construct of perceived risk, PMT also hypothesizes that the emotion of fear should predict preventative behavior. This assertion is supported by a meta-analysis of 27 studies covering a variety of health behaviors (Milne et al., 2000). However, it should be noted that research on the motivating effects of fear is somewhat mixed, with some studies showing that fear predicts greater levels of health-promoting behavioral intentions and other studies showing that it predicts lower levels of health-promoting behavior (Ruiter et al., 2014). It is also important to note that fear arousal and perceived risk, though related, are separate constructs (LaTour & Rotfeld, 1997). Thus, in the present study, both perceived COVID-19 mortality risk and fear/anxiety regarding the pandemic have been included as potential predictors in explaining variance in COVID-19 preparedness.
Finally, past research has shown that positive and negative mental health indicators predict a variety of health behaviors, including diet, physical activity, smoking, alcohol consumption, and substance use (Cohen et al., 1991; Hall et al., 2015; Park & Sim, 2004; Santacroce & Lee, 2006; Zuckerman et al., 1989). As such, in the present study, measures of both positive and negative affect as well as mental health symptoms (anxiety, depression, stress, health-related anxiety, and posttraumatic stress) have been included as possible predictors of variance in COVID-19 preparedness.
Method
Participants and Procedure
Participants were 222 adults (126 males, 95 females, 1 declining to specify) in 39 U.S. states, ages 19–78 (M = 39.65, SD = 12.73), recruited via Amazon Mechanical Turk (MTurk). Using MTurk, individuals can post tasks, including research studies, that others can complete online for a small payment. Given the quickly evolving nature of the pandemic and the exploratory nature of the present study, MTurk afforded the ability to recruit participants rapidly from a wide geographic area and take a “snapshot” of factors potentially accounting for preparedness in an early stage of the pandemic. Because the country as a whole was grappling with the emerging pandemic, the intention of the present study was to collect data at the national level. Data collection was limited to the U.S. and, as mentioned, took place from March 6 to 11, 2020. After providing informed consent, participants completed the instruments detailed below and collected US$4.50 in compensation.
Means and Standard Deviations of Study Variables.
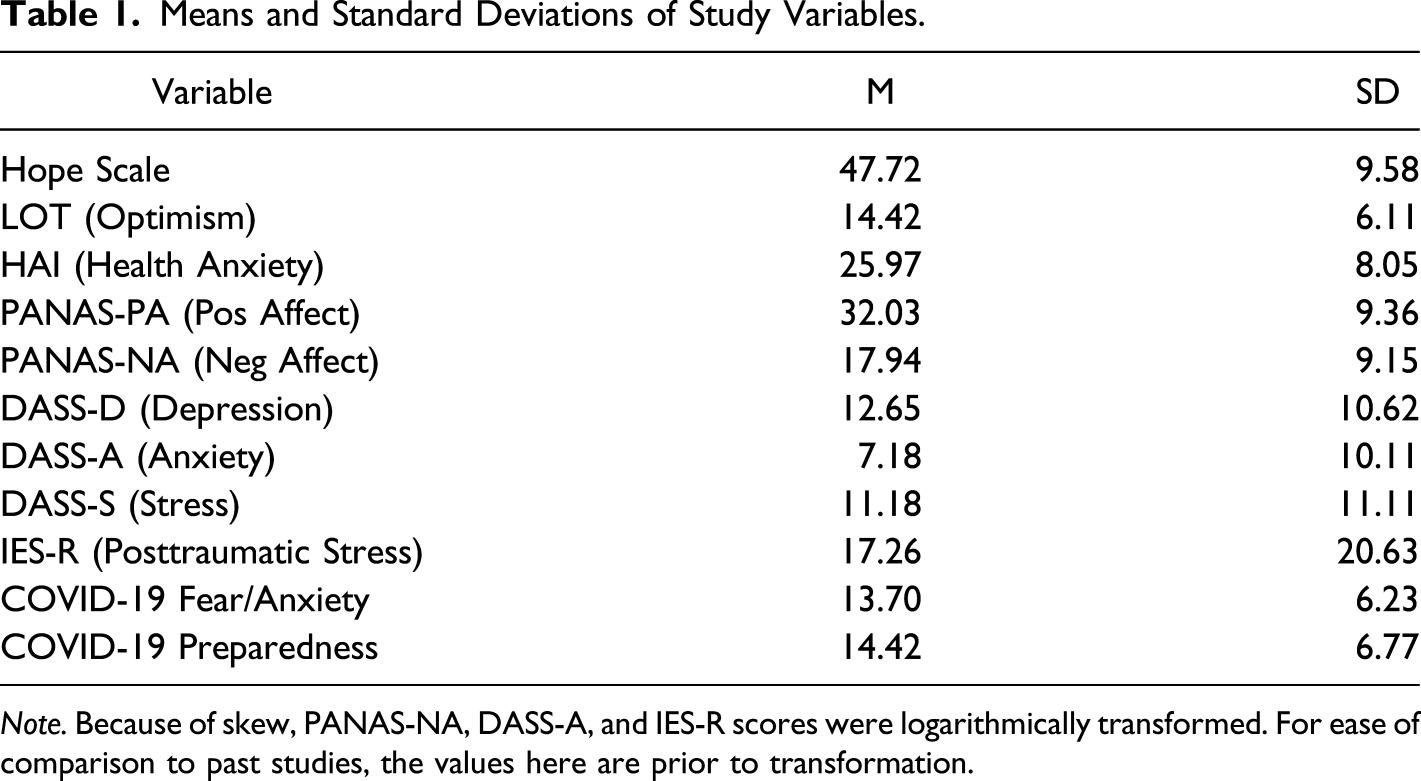
Note. Because of skew, PANAS-NA, DASS-A, and IES-R scores were logarithmically transformed. For ease of comparison to past studies, the values here are prior to transformation.
Measures
Demographics: A questionnaire inquired about age, gender, ethnicity, education, and income.
Trait Hope: The Adult Hope Scale (AHS) is a trait-like measure of hope (Snyder et al., 1991). Of 12 items total, four tap pathways, four tap agency, and four are distracters. The AHS measures hope in a continuous manner, with possible scores ranging from 8 to 64. Higher scores indicate greater levels of hope. Respondents rate all items on 1 (definitely false) to 8 (definitely true) scales. Items include “I energetically pursue my goals” (agency) and “I can think of many ways to get the things in life that are most important to me” (pathways). Research supports the reliability and validity of the AHS (Snyder et al., 1991). In the present study, Cronbach’s alpha was .92. Using guidelines presented by Bulmer (1979), absolute values for skewness (−.92) and kurtosis (.95) were both <1.0, indicating a relatively normal distribution of scores.
Dispositional Optimism: The Life Orientation Test, Revised (LOT-R) is a measure of dispositional optimism (Scheier et al., 1994). It measures optimism in a continuous manner, with possible scores ranging from 6 to 30. Higher scores indicate greater levels of optimism. It contains 10 items, six that are scored as well as four that serves as “fillers” and are not scored. Respondents rate all items on 1 (strongly agree) to 5 (strongly disagree) scales. A sample item is “Overall, I expect more good things to happen to me than bad.” Research supports the reliability and validity of the LOT-R (Scheier et al., 1994). In the present study, Cronbach’s alpha was .92. Absolute values for skewness (−.48) and kurtosis (−.5) were both <1.0, indicating a relatively normal distribution of scores.
Depression, Anxiety, and Stress: The Depression Anxiety Stress Scale, 21-item form (DASS-21) contains three 7-item subscales measuring depression (DASS-D), anxiety (DASS-A), and stress (DASS-S) (Lovibond & Lovibond, 1995). Each of these subscales provides a continuous score. Because the convention is to double each subscale’s score to make it comparable with the 42-item version of the DASS, possible scores range from 0 to 42. Higher scores indicate greater levels of depression, anxiety, and stress. Respondents use a 0 (did not apply to me at all) to 3 (applied to me very much, or most of the time) scale to rate how much they experienced the symptom described by each item over the past week. Items include “I couldn’t seem to experience any positive feeling at all” (depression), “I was worried about situations in which I might panic and make a fool of myself” (anxiety), and “I found it difficult to relax” (stress). Research supports the reliability and validity of the DASS-21 (Antony et al., 1998). In the present study, Cronbach’s alphas were .96 for depression, .93 for anxiety, and .93 for stress. Absolute values of skewness for the depression (.93) and stress (.73) subscales as well as kurtosis for the depression (−.44) and stress (−.70) subscales were <1.0, indicating relatively normal distributions of scores. The values for skewness (1.3) and kurtosis (.66) of the anxiety subscale, however, indicated a somewhat positively skewed distribution. As such, a logarithmic transformation was performed on anxiety subscale scores, resulting in new variable with a skewness of .41.
Positive and Negative Affect: The Positive and Negative Affect Schedule (PANAS) contains two 10-item subscales, one assessing positive (PANAS-PA) and one assessing negative affect (PANAS-NA) (Watson et al., 1988). It measures both constructs in a continuous manner, with possible scores on each subscale ranging from 10 to 50. Respondents rate the degree to which they have felt the emotions described by each item during the past week using 1 (Very Slightly) to 5 (Extremely) scales. Sample PA items include “excited” and “inspired,” and sample NA items include “upset” and “irritable.” Higher scores on the PA subscale indicate higher levels of positive affect, whereas higher scores on the NA subscale indicate higher levels of negative affect. Research supports the reliability and validity of the PANAS (Watson et al., 1988). In the present study, Cronbach’s alphas were .93 for the PANAS-PA and 0.95 for the PANAS-NA. Absolute values for skewness (−.11) and kurtosis (.70) of the PANAS-PA were <1.0, indicating a relatively normal distribution of scores. The values for skewness (1.38) and kurtosis (.96) of the PANAS-NA, however, indicated a somewhat positively skewed distribution. As such, a logarithmic transformation was performed on PANAS-NA scores, resulting in new variable with a skewness of .75.
Posttraumatic Stress: The Impact of Events Scale, Revised (IES-R) is a 22-item measure of posttraumatic stress (Weiss & Marmar, 1996). It provides a continuous score with a possible range of 0–88, with higher scores indicating greater levels of posttraumatic stress symptoms. Items include “I thought about it when I didn’t mean to,” “I tried not to think about it,” and “I was jumpy and easily startled,” which respondents rate on 0 (not at all) to 8 (extremely) scales. Research supports the reliability and validity of the IES-R (Weiss & Marmar, 1996). In the present study, Cronbach’s alpha was .98. Values for skewness (1.4) and kurtosis (.96) of the IES-R indicate a somewhat positively skewed distribution. As such, a logarithmic transformation was performed on IES-R scores, resulting in new variable with a skewness of .24.
Health Anxiety: The Health Anxiety Inventory, Short Form (HAI) is a 14-item measure of worry about physical health (Salkovskis et al., 2002). It provides a continuous score ranging from 14 to 56, with higher scores indicating greater health anxiety. The short form contains 14 items. Each comprises four statements representing low to high health anxiety. A typical item is “(a) I do not worry about my health, (b) I occasionally worry about my health, (c) I spend much of my time worrying about my health, and (d) I spend most of my time worrying about my health.” Research supports the reliability and validity of the HAI (Salkovskis et al., 2002). In the present study, Cronbach’s alpha was .93. Absolute values for skewness (.59) and kurtosis (−.15) were both <1.0, indicating relatively normal distribution of scores.
COVID-19 Fear/Anxiety: Four items, developed for the present study, constituted an index of COVID-19 fear/anxiety. These items were “How worried are you about catching the coronavirus?”, “During the last few days, how much anxiety have you experienced about the coronavirus?”, “How worried are you about any possible public panic connected to the coronavirus?”, and “During the last few days, how much anxiety have you experienced about any possible public panic connected to the coronavirus?”. Participants rated these items on scales ranging from 1 (not at all or none) to 7 (extremely or extreme), which were summed to yield a total score with a possible range of 4–28. Higher scores indicate greater levels of COVID-19 fear/anxiety. This index had a Cronbach’s alpha of .89, indicating high internal consistency, and exploratory principal components analysis indicated a single-factor solution (using both eigenvalues >1.0 and visual examination of the scree plot), with all items loading between .80 and .92. Absolute values for skewness (.30) and kurtosis (−.78) were both <1.0, indicating a relatively normal distribution of scores.
COVID-19 Current Preparedness: An additional four items, developed for this study, constituted an index of COVID-19 current preparedness. These items were “To what degree have you done anything to protect yourself against the possible spread of coronavirus?”, “To what degree have you purposely sought out news or information about coronavirus?”, “Due to the possibility of catching the coronavirus, to what degree have you stopped or cut back on doing things you would normally do?”, “To what degree have you bought extra groceries or other supplies to prepare for the possible spread of coronavirus?”. Participants rated these items on scales ranging from 1 (not at all) to 7 (to a great degree), which were summed to yield a total score with a possible range of 4–28. Higher scores indicate greater levels of COVID-19 current preparedness. This index also displayed high internal consistency, with a Cronbach’s alpha of .87, and exploratory principal components analysis indicated a single-factor solution (again using both eigenvalues >1.0 and scree plot), with all items loading between .72 and .90. Absolute values for skewness (.32) and kurtosis (−.95) were both <1.0, indicating a relatively normal distribution of scores.
COVID-19 Anticipated Preparedness: At the time of this study, the media were reporting that the mortality of COVID-19 was approximately 3–4%. However, there was speculation both in the media and among the public that this percentage was underreported (often attributed to a lack of available testing), as well as fringe speculation that the statistics were being inflated to increase public alarm (Lee, 2020). To assess whether participants’ anticipated future degrees of preparedness would be different depending on mortality risk, a set of six items asked participants to imagine that the mortality of COVID-19 was at six different hypothetical levels of risk between 1 and 10%, then rate to what degree they would anticipate taking steps to protect themselves at each level. This rating was provided on a scale ranging from 1 (not at all) to 7 (to a great degree). For each of the six levels of hypothetical COVID-19 mortality, absolute values for skewness (.37, .27, −20, −.43, −.98, respectively) and kurtosis (−1.27, −1.38, −1.22, −.98, −.40, respectively) of anticipated preparedness ratings were examined; these values were generally <1.0, indicating relatively normal distributions of scores. Though some of the kurtosis values exceeded 1.0, they were well below 7.0, the more generous threshold often applied to kurtosis in larger samples. As such, no transformation was used.
COVID-19 Mortality Risk: Two items were designed to assess participants’ perceived mortality risk associated with COVID-19. The first item asked participants to rate the degree to which they believed the accuracy of the COVID-19 mortality risk statistics reported in the news (which was approximately 3–4% at the time of the survey). This was assessed using a scale ranging from −3 (the number is extremely inaccurately low) through 0 (the number is accurately reported) to 3 (the number is extremely inaccurately high). Absolute values for skewness (.46) and kurtosis (.51) of this item were both <1.0, indicating a relatively normal distribution of scores. The second item asked participants to indicate the actual mortality risk they perceived was associated with the disease as a percentage. Absolute values for skewness (4.13) and kurtosis (17.92) of this item indicated a distribution deviating markedly from normality. As addressed further in the Results section, this skewed distribution appeared to be the result of a small number of outliers, which were corrected by winsorizing the variable to the 95th percentile.
Statistical Analyses
Demographic data were summarized using descriptive statistics (counts, means, and standard deviations). Bivariate relationships among continuous variables were analyzed using Pearson correlations, and analysis of variance (ANOVA) was used to compare means of continuous variables between groups (e.g., race/ethnicity). To test for possible differences in COVID-19 anticipated preparedness among the six different hypothetical levels of COVID-19 mortality risk, a repeated-measures ANOVA was used. Finally, in order to identify an “essential” set of variables that accounted for unique variance in COVID-19 current preparedness, multiple linear regression with stepwise selection was used, a detailed description of which can be found in the Results section. Finally, to determine whether this essential set of variables accounted for unique variance in COVID-19 current preparedness over and above relevant demographic factors, we reran the analysis statistically controlling for demographic variables that had previously manifested zero-order relationships with current preparedness.
Results
Demographics
The sample contained 126 males and 95 females (1 participant declined to specify), and ages ranged from 19 to 78 (M = 39.65, SD = 12.73). The majority of participants (n = 183) identified as White, with 18 identifying as African American, 14 identifying as Asian or Asian American, 10 identifying as Latinx, four identifying as Native American, and four identifying as other (because participants could choose multiple categories, these numbers total over 222). With regard to personal income, 43 participants indicated making less than $20,000, 68 between $20,001 and $40,000, 55 between $40,001 and $60,000, 24 between $60,001 and $80,000, 22 between $80,001 and $100,000, six between $100,001 and $120,000, two between $120,001 and $140,000, and one between $140,001 and $160,000. One participant declined to indicate. Finally, four participants reported some high school, 20 high school diploma or GED, 42 some college, 33 associate’s degree, 86 bachelor’s degree, 32 master’s degree, two doctoral degree, and three declined to state.
Correlations among Study Variables.
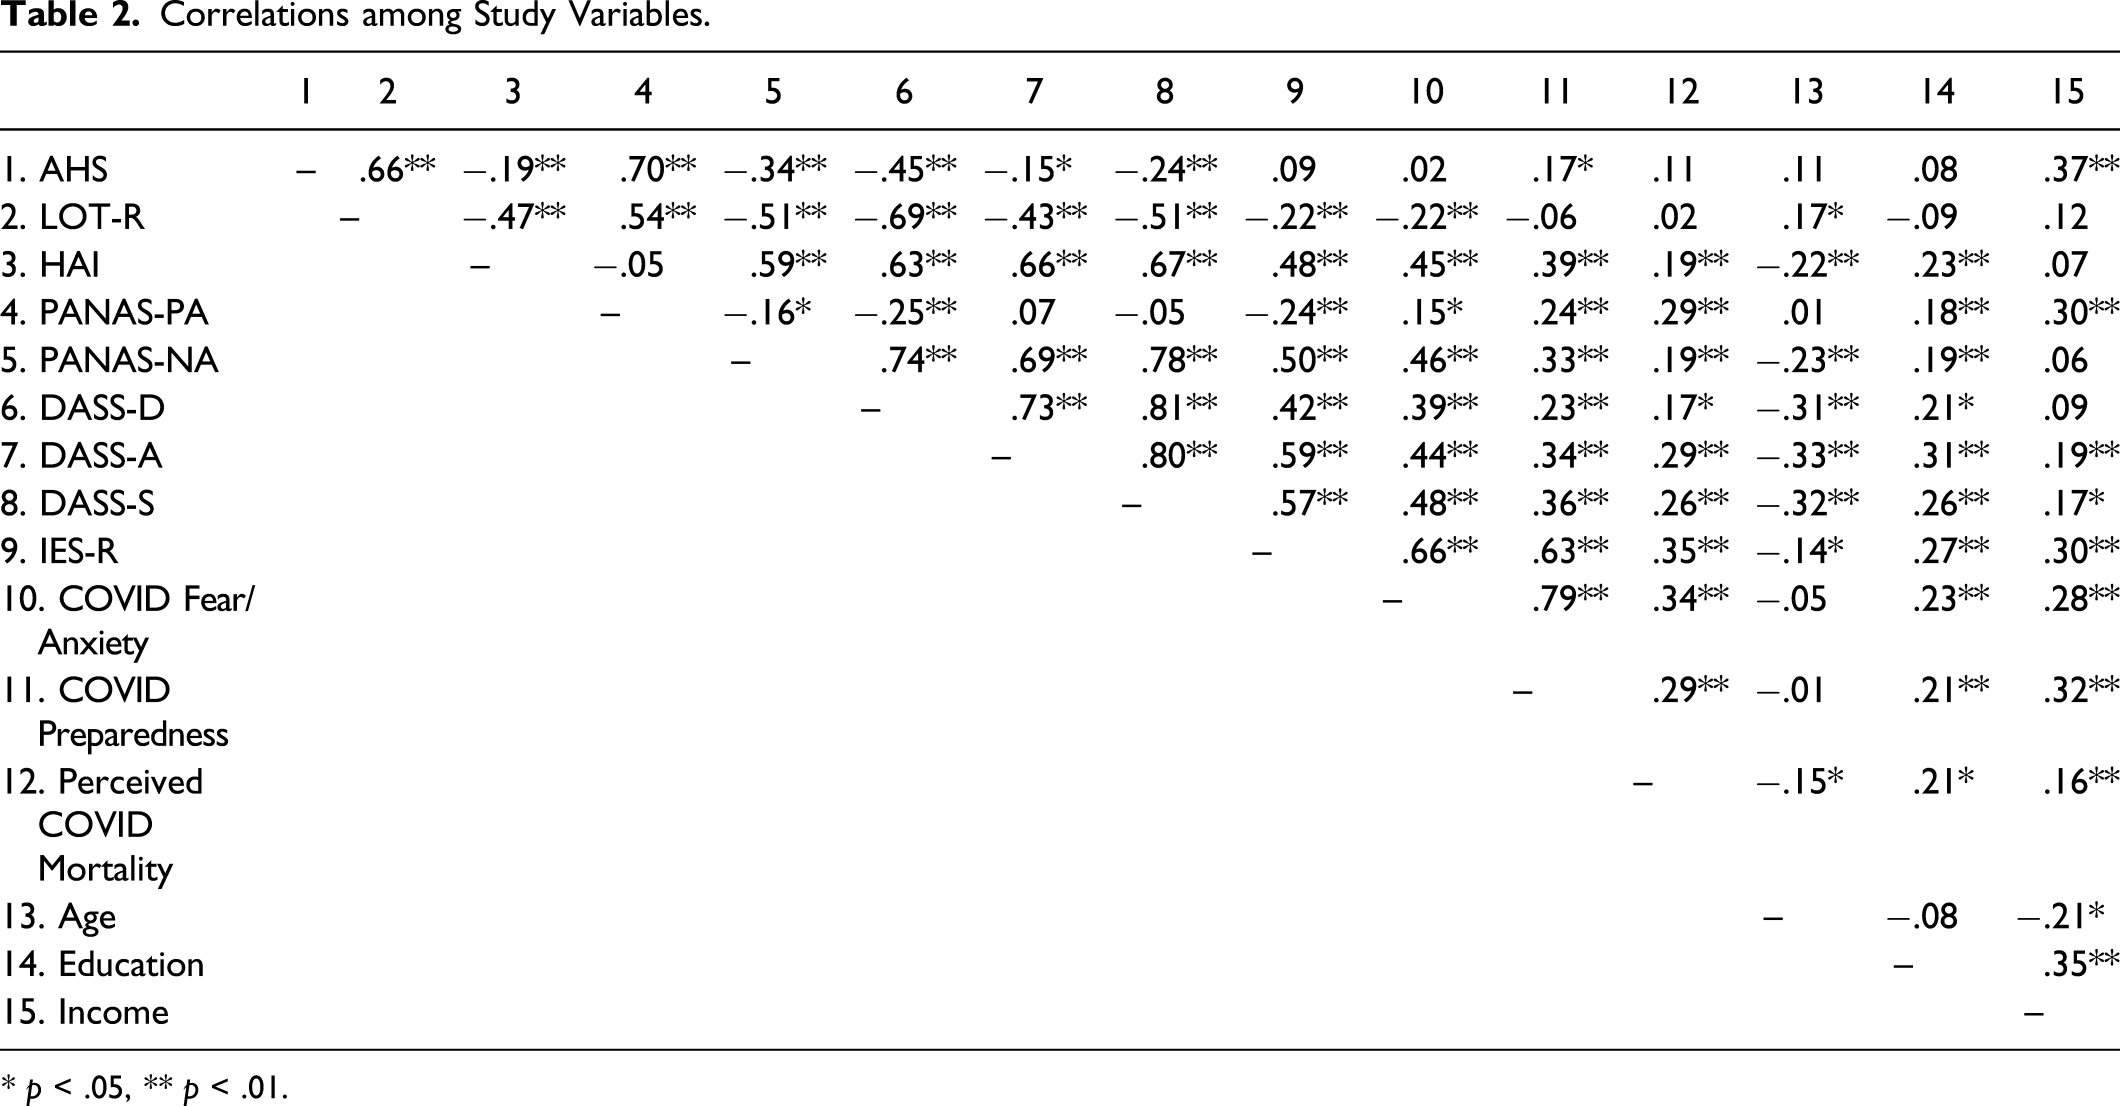
* p < .05, ** p < .01.
Correlations between COVID-19 Anticipated Preparedness Levels and Continuous Demographic Variables.
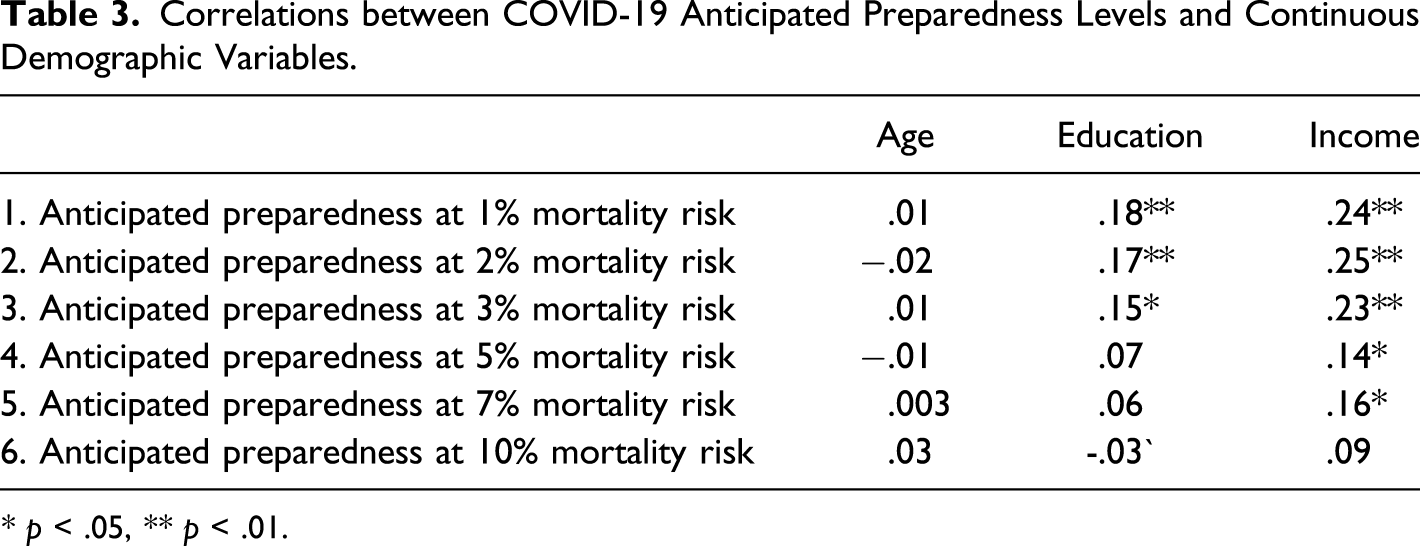
* p < .05, ** p < .01.
Beliefs Regarding Mortality Estimates
Participants’ estimates of the mortality risk of COVID-19 appeared relatively accurate. Although the mean mortality estimate of 6.74% (SD = 14.42) was high, this was driven by a small number of very high estimates (e.g., 95, 50). As mentioned in the Measures section, this resulted in a strongly positively skewed distribution. To correct for these outliers, values above the 95th percentile were winsorized. The decision to winsorize was based on Tukey’s (1962) recommendations for preventing extreme values from producing spurious findings not representative of the population under study. Winsorization was used rather than fully eliminating (i.e., trimming) these values from the data set, given that participants may not necessarily have entered these values accidentally. The winsorized variable will be used in subsequent analyses. It should be noted that the median of 3.0 much more closely accorded with the figure of 3–4 percent reported by the WHO at the time of the study. Participants also indicated believing that the number of COVID-related deaths reported in the news was accurate. On a scale of −3 to +3, where 0 indicated belief that the number was accurate, the mean rating of −.01 did not differ from zero, t (196) = −.058, p = .95.
Anticipated COVID-19 Preparedness
Recall that a set of items asked participants to imagine that the mortality rate of COVID-19 were at six levels of risk between 1 and 10%, rating the degree to which they would anticipate taking steps in the future to protect themselves for each mortality level. A repeated-measures ANOVA was used to test for differences in anticipated preparedness across the six mortality risk levels. Income and education were covaried, given that both had manifested zero-order relationships earlier with the items being analyzed here. The omnibus test for mortality levels was significant, F (5, 204) = 94.25, p < .001, partial eta2 = .31.
Means, Standard Deviations, and Pairwise Comparisons for Hypothetical Mortality Risk of COVID-19.
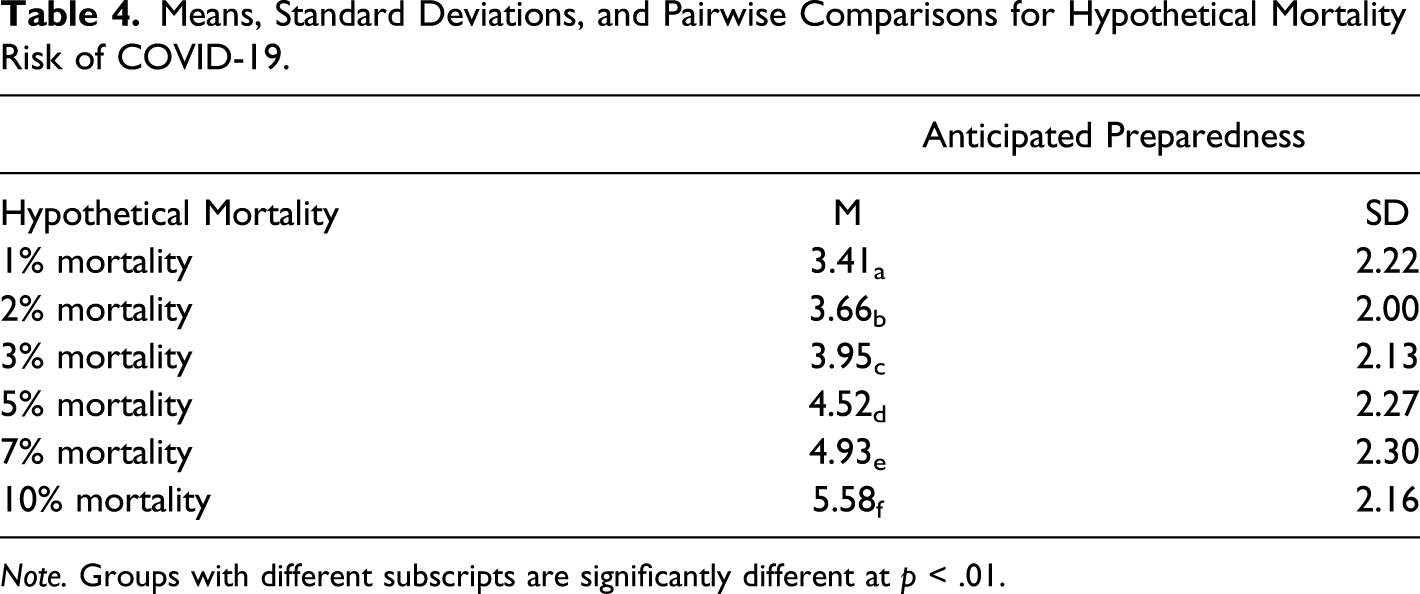
Note. Groups with different subscripts are significantly different at p < .01.
Current COVID-19 Preparedness
The previous analysis concerned participants’ anticipated future levels of preparedness given different hypothetical risk levels. In addition, analyses were performed to determine the factors that contributed to their current levels of preparedness. As mentioned, zero-order correlations can be found in Table 2, which reveal that all variables except for the LOT-R correlated significantly with COVID-19 current preparedness.
To further determine which of these variables accounted for unique variance in COVID-19 current preparedness, a multiple regression analysis with stepwise selection was used. This procedure begins with no predictors in the model and then enters the one candidate predictor variable per step that increases R2 the most, checking to determine that all other predictors in the model remain significant. Variables cease to be added when none of the remaining candidates would statistically significantly add to the model. This results in an “essential” set of predictors, each accounting for unique variance in the criterion. The COVID-19 preparedness index served as the criterion variable. Candidate predictor variables included all study variables that manifested zero-order correlations with COVID-19 preparedness: AHS, DASS-D, DASS-A, DASS-S, PANAS-NA, PANAS-PA, IES-R, HAI, COVID-19 fear/anxiety index, and participants’ personal estimate of the mortality risk of COVID-19.
Stepwise selection terminated after three steps. The final model accounted for 64.7% of the variance in COVID-19 preparedness, F (3, 201) = 127.07, p < .001. The three variables in this model were the COVID-19 fear/anxiety index (β = .70, t = 12.29, p < .001), AHS (β = .14, t = 3.39, p = .001), and IES-R (β = .13, t = 3.14, p = .002).
To apply a more conservative test to this model, a second regression analysis was performed. This time, the demographic variables that manifested zero-order relationships with current COVID-19 preparedness (i.e., education and income) were entered into the model at step 1, and the three final significant variables from the previous analysis (i.e., hope, COVID-19 fear/anxiety, and IES-R) were entered into the model at step 2. This provides a test of the ability of these three variables to account for unique variance in COVID-19 current preparedness after statistically controlling for demographic variables. The total model accounted for 66.6% of the variance in COVID-19 preparedness, F (4, 206) = 82.14, p < .001. Step 1 (containing the demographic variables) accounted for 11.0% of the variance in COVID-19 current preparedness, F (2, 209) = 12.91, p < .001. Step 2 (containing hope, COVID-19 fear/anxiety, and IES-R) accounted for an additional 55.6% of the variance, ΔF (2, 206) = 114.29, p < .001. At step 2, neither of the demographic variables retained significance. The three predictors from the previous model—COVID-19 Anxiety (β = .67, t = 12.26, p < .001), hope (β = .11, t = 2.61, p = .01), and IES-R (β = .17, t = 3.03, p = .003)—remained significant.
Discussion
According to the present results, participants’ estimates of the mortality risk associated with COVID-19 appeared relatively accurate. When asked to imagine various hypothetical levels of mortality risk associated with the disease, the degree to which they anticipated preparing to protect themselves increased approximately equally across risk levels. Nonetheless, at all levels of hypothetical risk, a large proportion of participants anticipated doing relatively little to prepare. For instance, at the 3% mortality risk level, 48.6% of the sample rated their willingness to take steps to protect themselves below the midpoint of the scale.
In addition to understanding the link between mortality risk levels and COVID-19 anticipated preparedness, analyses were performed to determine which variables accounted for unique variance in participants’ current levels of COVID-19 preparedness. A stepwise multiple regression showed that three variables accounted for unique variance in current preparedness: dispositional hope, COVID-19 fear/anxiety, and posttraumatic stress symptoms (as measured by the IES-R).
The finding that dispositional hope accounted for unique variance in COVID-19 current preparedness is consistent with the aforementioned suggestion by Rand et al. (2011) that hope should be a better predictor than its theoretical cousin—optimism—in situations with some degree of controllability. In this regard, hope has been shown to be a better predictor than optimism of various outcomes in the relatively controllable domains of physical fitness (Feldman & Anderson, 2019) and academics (Feldman & Kubota, 2015; Rand et al., 2011). Similarly, preparing to protect oneself in the midst of COVID-19 involves some measure of personal control.
In addition, COVID-related fear/anxiety accounted for unique variance in current preparedness. This finding is consistent with research regarding Protection Motivation Theory (PMT), which asserts that fear predicts preventative behavior (Rogers & Prentice-Dunn, 1997). As mentioned earlier, however, past findings have been mixed on this point (Earl & Albarracín, 2007; Milne et al., 2000). Some studies have found that fear predicts greater health-related behavioral intentions, whereas others have found that it actually predicts lower levels of behavioral intentions (Ruiter et al., 2014). As such, the present study lends support for the possible protective role of fear in the relatively ambiguous early stage of the pandemic.
Overall, the current findings regarding the complimentary roles of hope and fear in COVID-19 preparedness are in line with previous theory and research. For instance, Halevy (2017) observed that hope is often mixed with negative feelings such as fear. Moreover, Lazarus (2006) wrote that hope develops when people are “fearing the worst but yearning for better and believing the wished-for improvement is possible” (p. 16). Smith and Leiserowitz (2014) found that hope and worry both predicted people’s willingness to engage in collective actions to curtain global warming, which some have described as a public health crisis (Hollis, 2019). More specific to the present research, however, a study by Kim et al., 2021 of restaurant customers in the United States found that both fear and hope predicted the tendency to support local businesses during the COVID-19 pandemic.
In contrast to hope and fear, perceived mortality risk did not account for unique variance in COVID-19 preparedness. This is inconsistent with research regarding the Health Belief Model (Janz & Becker, 1984). This is not the only study to find a lack of relationship for risk with preventative health behavior (e.g., Lipkus et al., 2000; Spain et al., 2008). It should be noted, however, that this lack of relationship only occurred in the context of the multiple regression analysis, with other variables in the model. Perceived mortality risk did manifest a zero-order correlation with preparedness. Furthermore, the lack of relationship occurred when attempting to account for unique variance in COVID-19 current preparedness. In analyses asking participants to imagine that COVID-19 had different mortality risk levels, higher imagined risk was indeed associated with greater anticipated willingness to take steps to prepare and protect themselves against the disease. This difference in finding may reflect the distinction between anticipating behavior under hypothetical circumstances versus reporting on current behavior.
Although most mental health variables measured in the present study, including depression, anxiety, and stress, as well as general positive and negative affect, manifested zero-order correlations with COVID-19 current preparedness, they did not account for unique variance in COVID-19 current preparedness once hope and fear were statistically accounted for. However, there was one exception: posttraumatic stress symptomatology (as measured by the IES-R) did account for unique variance in COVID-19 preparedness. This is consistent with recent work by Olapegba et al. (2021), who found that greater posttraumatic stress symptomology predicted greater levels of COVID-19-related preventative health behavior. It is unclear why this should be the case, given that outside of the context of COVID-19, posttraumatic stress is typically understood to decrease functioning (Matthews et al., 2009; Veling et al., 2013). However, the present results provide some limited additional support for their finding in the context of COVID-19. One possible explanation is that the levels of posttraumatic stress symptoms reported by participants in this study were, on average, low compared to samples of people diagnosed with PTSD. For instance, Creamer et al. (2003) found that a cutoff score of 33 on the IES-R represented the minimum level for clinically significant symptoms. In the present sample, 80.4% of participants did not reach this minimum threshold.
Limitations and Conclusions
As with any research, the present study has limitations. First, because of its cross-sectional design, care should be taken not to infer causation. Although hope accounted for unique variance in self-reported preparedness, we cannot know whether hope caused greater preparedness or vice versa. Because hope was measured in a trait-like manner, it is unlikely to be the latter, but this cannot be ruled out given the present data.
Second, participants were obtained via MTurk. As previously noted, there are distinct advantages to this recruitment method. Notably, it allows for rapid recruitment of participants from a wide geographic area. As such, in the present study, MTurk was key in providing the opportunity to take a “snapshot” of factors associated with preparedness at an early stage of the pandemic. However, MTurk samples have also been found to be younger, to be higher in education, to be less ethnically diverse, and to report lower levels of perceived health than other general samples (Walters et al., 2018). Particularly given the relative lack of ethnic diversity in the present sample combined with the fact that important racial differences emerged during the pandemic with regard to severe disease and death, appropriate caution should be taken in interpreting and generalizing the current results.
Finally, because of the self-report nature of the study, we cannot know for sure whether participants’ perceptions of their COVID-19 preparedness reflect actual preparedness. Though challenging, in the future, investigators should consider measuring preparedness through direct observation.
Despite these limitations, this study offers a useful glimpse into variables related to preparedness in the early stage of a widespread public health crisis. The results show that fear and anxiety, as well as posttraumatic stress symptoms, may be connected usefully to taking steps to protect oneself, even in the midst of ambiguity regarding exactly how to do so. But, perhaps even more useful is the finding that hope is related to preparedness. These findings may provide clues regarding how to best present public health information—emphasizing a dual message of fear and hope. Current communication campaigns regarding COVID-19 have often seemed to emphasize the former rather than the latter, perhaps missing an important opportunity.
These findings also highlight the possible usefulness of hope interventions. Brief interventions have been shown to increase hope in past research (Cheavens et al., 2006; Daugherty et al., 2018; Feldman & Dreher, 2012). Feldman and Dreher (2012), for instance, have developed a single-session, 90-minute “Hope Workshop,” which has been shown to increase hope, academic achievement, and goal accomplishment in college students (Davidson et al., 2012). It also has been recently applied to patients with cancer (Shah et al., 2021) as well as oncology healthcare professionals (Feldman et al., 2021) in two small-scale feasibility studies, with positive results. Such brief interventions may be feasible in times of crisis, particularly given that they can be delivered in both in-person and online formats.
As tragic and painful as COVID-19 has been for so many, it is likely that it will not be the last pandemic that our world witnesses. The present study has offered a rare glimpse into factors accounting for preparedness in the earliest stage of the current pandemic, hopefully providing clues for how to prepare the public for inevitable future crises.
Footnotes
Declaration of Conflicting Interests
The author(s) declared no potential conflicts of interest with respect to the research, authorship, and/or publication of this article.
Funding
The author(s) received no financial support for the research, authorship, and/or publication of this article.