
Abstract
As active involvement in protest has been legitimized as an acceptable form of political activity, citizens’ protest potential has become an important measure to understand contemporary democratic politics. However, the arbitrary use of a forced-choice question, which prevents those who have previously participated in protests from expressing willingness to engage in future protest, and the limited coverage of international surveys across countries and years have impeded comparative research on protest potential. This research develops a new systematic weighting method for the measurement of protest potential for comparative research. Using the 1996 International Social Survey Program survey, which asks two separate questions about “have done” and “would do” demonstrations, I create a weighting scale for the forced-choice question by estimating the predicted probabilities of protest potential for those who have already participated in demonstrations. Capitalizing on the survey data recycling framework, this study also controls for harmonization procedures and the quality of surveys, thereby expanding the cross-national and temporal coverage beyond the affluent Western democracies. The results show that this weighting scale provides a valid measure of protest potential, and the survey data recycling framework improves comparability between surveys.
Introduction
As protest has been legitimized as a form of political participation in recent decades, protest has become an essential element in the political processes of Western democracies (Kriesi et al., 1995; Meyer & Tarrow, 1998). With the cross-national diffusion of protest, citizens’ protests in developing democracies have grown more important in pressing for democratic reforms (Kadivar & Caren, 2016; Teorell, 2010). In such a social movement society, active citizen participation in protest behavior has a significant effect on political change and policy adoption alongside conventional forms of political participation such as voting and electioneering. As such, measuring protest potential, which rests on citizens’ willingness to participate in future protest, is needed. It is notable that past protest behavior is not an adequate measure of future protest because individual participation is critically shaped by specific mobilization contexts (Barnes & Kaase, 1979). By protest potential we mean the general capacity or willingness to engage in protest, which may be realized in actual behavior if the proper contexts are satisfied.
Comparative research on protest potential has lagged. The primary reasons are poorly verified measurement and the limited coverage of cross-national surveys. First, the measurement of protest potential remains underdeveloped. Discussions of survey measures have tried to construct a composite protest scale using a battery of protest types and various weighting scales (Crozat, 1998; Dalton et al., 2009; Jenkins & Wallace, 1996; Norris, 2002; Welzel & Deutsch, 2011), while others have focused on cross-national equivalence (Quaranta, 2013). Recent critics have pointed out that the standard survey question does not specify a time frame for when past participation occurred, which makes it difficult to examine causality and political trends (Biggs, 2015; Jenkins & Kwak, 2018; Jenkins & Kwak, this issue; Saunders, 2014; Tomescu-Dubrow et al., 2018). However, protest potential has received little attention since Barnes & Kaase (1979) devised their protest potential scale. They used approval of the specific form of protest as a screening tool to validate expressed willingness, but others have shown that this might reflect ignorance of respondents about specific protest forms more than their willingness (Rootes, 1981). Consequently, the subsequent international surveys include only the willingness question, which asks the respondents to report past protest behavior or their willingness to participate in future protests. However, this forced-choice design prevents respondents who have previously participated in protests from directly expressing their willingness to join future protests, leading to imprecise measurement of protest potential. Several studies use an arbitrary weighting scale to address this problem (Jenkins et al., 2008; Welzel & Deutsch, 2011), but these have never been evaluated for validity.
Second, cross-national comparative research on protest potential has been impeded by lack of country and time coverage. Most international surveys cover affluent Western democracies, whereas historically marginalized developing countries have been excluded (Slomczynski & Tomescu-Dubrow, 2019). Global trends in protest behavior and attitudes have rarely been investigated, and social movement theories developed in Western democracies have not been broadly tested in a global context. A key method for addressing these problems is the harmonization of the large inventory of surveys in existence (Dubrow & Tomescu-Dubrow, 2016), but the issue of intersurvey variability inherent in the process of survey data harmonization obstructs the advance of protest potential research. Recently, the survey data recycling (SDR) project devised a method to address variation between surveys through harmonization and survey quality control variables, which capture a difference in the properties of the harmonized protest potential items in the source survey and variation in data qualities across surveys (Slomczynski et al., this issue; Tomescu-Dubrow & Slomczynski, 2016). To improve cross-national comparative research on protest potential, the utility of the SDR framework for addressing intersurvey variability needs to be assessed.
This article examines the measurement of protest potential and the methods for making ex post harmonized survey data comparable. First, this article develops a new measurement of protest potential using the 1996 International Social Survey Program (ISSP): Role of Government survey, which provides separate items about past participation and future willingness for 4,684 individuals nested within 22 countries. I estimate predicted probabilities of protest potential from logistic multilevel models to devise a weighting scale for the protest potential measure from a forced-choice question. I then examine the issue of intersurvey methodological variability in the harmonized protest potential measure using the sample of the country-years that have multiple surveys in the SDR database version 1.1. Using three-level multilevel models for 107,413 individuals nested within 77 national surveys in 38 country-years, I assess whether intersurvey methodological variability can be addressed by harmonization and survey quality control variables. The SDR framework for survey data harmonization contributes to cross-national research on protest potential by expanding the coverage across countries and time.
Research on Protest Potential
Social movement scholars incorporated unconventional protest actions into the repertoire of political participation and accepted the centrality of protest to democratic political processes since the 1970s (Gamson, 1975; McCarthy & Zald, 1973; Meyer & Tarrow, 1998; Tilly, 1978). With widespread protest activity and its increasing legitimacy as a channel for political participation, people’s willingness to participate in future protest becomes an important element that policymakers must engage within the political process. Protest potential, which indicates individual propensity to engage in protest, is conceptually different from actual participation in protest. Actual involvement in protest is contingent on specific political or economic issues, influence of friends or family, and/or exposure to certain recruitment efforts. Protest behaviors would immediately affect political processes and be measured by surveying past participation across countries (Verba et al., 1978). However, past behaviors do not guarantee future participation because specific contextual conditions may be necessary to trigger protest behavior. Also, the actors’ appraisal of the effectiveness and legitimacy of past protest may affect the link between past behavior and willingness to engage in future protest. For example, if someone was disappointed by the demonstration that he participated in 10 years ago because of its aggressive and disorderly form, we cannot expect her or him to have a strong protest willingness just because she or he previously participated in a demonstration. Therefore, past protest behavior is not an appropriate way to predict individual willingness for future protest.
In contrast, Barnes and Kaase (1979) suggest that individual readiness for protest could be an approximation of actual behavior if behavioral willingness is conscious and qualified by their approval for protests. It does not matter whether actual participation currently occurs or not. The important point of protest potential is the individual capacity and desire for protest if the conditions that trigger protest activity occur. Therefore, protest potential is a more valid measure of the likelihood of protest participation than past behavior. Research into protest potential focuses, therefore, not on the factors that facilitate a specific protest event but on the factors that contribute to creating a pool of potential participants for future protests.
Prior studies have examined individual and contextual features that may affect protest potential (Anderson & Mendes, 2005; Crozat, 1998; Jenkins et al., 2008; Jenkins & Wallace, 1996; Welzel, 2013). Among individual-level predictors, most studies identify gender, age, and education as common sociodemographic predictors. First, women in general are less likely to participate in protest than men. Earlier studies attributed this gender disparity in political participation to traditional gender norms that place women’s role in the private sector of the home (Dalton, 1996). In contrast, critics contended that women’s lack of resources for political activity such as education and money contribute to their low protest (Schlozman et al., 1994). Although the gender gap in protest participation has declined in advanced societies, most research using the cross-sectional survey data confirms the existence of gender disparities in protest potential.
Age is also a key predictor of protest potential, but past studies provide different results. Some studies suggest that younger people are more likely to participate in protest than older people because younger people hold more ideal and postmaterialist values and psychological willingness to take risks (Dalton, 1996). They are also more biographically available for protest because they have lower personal constraints that impose risks on protest such as marriage and full-time employment (McAdam, 1989). Other studies report that age has a curvilinear relationship with protest activity, indicating that the middle age-group is more likely to protest than the youngest and oldest groups (Caren et al., 2011; Dubrow et al., 2008). The middle age-group is affected by increased community integration and commitment, which may increase their protest activity. The analyses from both approaches demonstrate that the age effect is consistently relevant to protest potential, whether the effect is negative or curvilinear.
The better educated are more likely to engage in protest. According to resource theory, protest is more common among the better educated who are more politically knowledgeable and have more political skills (Jenkins & Wallace, 1996). Modern educational systems that stress a psychological sense of ability to influence societies (Hall et al., 1986), commitment to civil liberties (Dahlum & Wig, 2019), and postmaterialist values of self-expression and autonomy (Welzel, 2013) encourage the better educated to engage in political protest. Therefore, education is likely to contribute positively to protest potential.
Among the various macro and institutional explanations for protest (see Jenkins et al., 2008), democratization is one important predictor rooted in political opportunity theory, which suggests that political processes and institutional structures shape the potential for political activity. Some research shows that open, democratic societies facilitate protest (Anderson & Mendes, 2005; Tarrow, 2011). In well-established democratic societies, where governments treat protest as a legitimate means of political access, people can attend most protests without fear of oppression (Dalton et al., 2009). This lower social barrier to protest allows citizens to perceive protest as an acceptable and normal form of political action, which leads to widespread willingness to protest. This suggests that affluent democracies with longer histories of democratic rules provide stable opportunities for protest, whereas autocracies and new democracies provide less opportunities for protest (Jenkins et al., 2008). In short, democracy enhances protest potential by opening up political opportunities for protest.
The Measurement Problem
Barnes and Kaase (1979) developed their protest potential scale using two sets of questions that asked about protest approval and behavioral willingness. They claim that an individual’s propensity for protest could lead to actual behavior if the respondent seriously considers participation in protests. They construct a protest potential scale by combining approval and behavioral willingness responses through a Guttman scaling procedure. The problem in their measurement approach is an inconsistency between approval and behavioral willingness, which occurs to respondents who do not approve of a certain protest type but have a willingness to engage in protest. Barnes and Kaase treat the inconsistent cases as lacking potential despite their expressed willingness to engage in protest. It is notable that this inconsistency increases as the protest gets more aggressive, moving from petitions to boycotts. This suggests that the inconsistency is related to a lack of familiarity with the protest form (Barnes & Kaase, 1979), such that the protest potential measure is skewed toward the better educated who have greater knowledge of protest activities (Rootes, 1981). In contrast, the inconsistencies may indicate a strong commitment to protest because the respondents express their willingness even though they do not view certain protest forms as legitimate. Therefore, Barnes and Kaase’s measurement approach lacks face validity for measuring individual protest potential.
The subsequent international surveys such as the World Values Survey (WVS) and the European Value Study, consequently, adopted only the behavioral willingness question, which became a standard question for protest potential research (Tomescu-Dubrow et al., 2018). Barnes and Kaase’s original question about behavioral willingness asked respondents whether they (1) had done during the past 10 years, and if not, whether they (2) “would do”, (3) “might do”, or (4) “would never do” each of a battery of protest activities, ranging from attending lawful demonstrations to blocking traffic. This standard question includes answers that appropriately capture protest willingness, but its forced-choice design represents a problem, compelling respondents to choose between past behavior (“have done”) and protest willingness (“would do” or “might do”). This forced-choice design prevents respondents who have participated in protest from expressing their willingness to attend future protests. These omitted responses are a severe problem in measuring valid protest potential.
A popular strategy for solving this problem is to use a weighting scale that adjusts for the unobserved protest willingness. This method gives specific weights to each of past participation and protest willingness after combining the two response categories. Some studies gave an equal weight to protest participation with protest willingness (e.g., Crozat, 1998; Jennings et al., 1989; Kim & McCarthy, 2018). This method assumes that those who have previously participated in protests are willing to engage in future protests, but the assumption has never been validated. Other studies applied a larger weight to past participation than willingness for future protest (e.g., Jenkins et al., 2008; Jenkins & Wallace, 1996; Welzel & Deutsch, 2011). Welzel and Deutsch (2011), for example, weighted three times more the “have done” response than the “might do” response (might do = 0.33, have done = 1) to measure a person’s tendency to protest but did not provide any rationale for this weighting. As we have noted, there is no necessity that past behavior leads to future willingness. As a result, protest potential has been measured by arbitrary solutions that have not been validated.
These arbitrary weighting scales present several challenges. First, they do not consider the extent to which those who have previously engaged in protest are willing to participate again in the future. Higher or equal weights for past participation rather than willingness in previous research may overestimate protest potential. Second, arbitrary weighting scales ignore the disparities of protest potential across demographic groups and countries. The weighting scales assign the same weighting values to all respondents regardless of their demographic and contextual characteristics, so the scales do not account for differential protest potential across subgroups. Finally, the measure of protest potential is affected by the time frame in the question (Crozat, 1998). Participation rates derived from the question lacking any time boundary for respondents’ past actions should be higher than the question that set a 1-year or 5-year time frame for past participation. Therefore, protest potential that includes the past-behavior responses systematically inflates or deflates by virtue of the question’s time frame. Consequently, the previous arbitrary weighting scales for the forced-choice question do not guarantee the protest potential measure’s validity.
Intersurvey Methodological Variability in Survey Data Harmonization
Studies that have examined individual- and country-level predictors of protest behavior and willingness relied on data from international survey projects such as WVS and ISSP. These international surveys were initiated back in the 1980s but were limited to the affluent democracies of Western Europe and North America (Dubrow & Tomescu-Dubrow, 2016). Although they have expanded to include countries in Asia, Latin America, and Africa, limited coverage over time and space is still a barrier to accumulating cross-national comparative research on protest activity.
Ex post survey harmonization is a useful approach to overcome limited coverage over periods and countries by creating a single data set that pools and adjusts variables from different surveys that were not designed to be compared in the first place (Granda & Blasczyk, 2016; Tomescu-Dubrow & Slomczynski, 2016). The SDR project has constructed a large data set that harmonizes the survey items about attending demonstrations and signing petitions from 19 international survey projects for 136 countries and territories from 1966 to 2013 (Slomczynski et al., 2016; Slomczynski et al., this issue). It is notable that the data set harmonizes regional surveys such as the Afrobarometer (AFB), Asian Barometer, and Latinobarometer, which cover historically underrepresented regions in protest research.
Survey data harmonization, however, carries the unavoidable challenge of intersurvey methodological variability. Discrepancies between surveys can lead to methodological errors in the process of ex post harmonization by impairing the validity and reliability of harmonized variables. The SDR framework suggests that these errors can be addressed by using control variables that measure the sources of intersurvey variability in the analysis (Slomczynski et al., this issue; Slomczynski & Tomescu-Dubrow, 2019). A prominent source of intersurvey methodological variability is a difference in the formulation of harmonized questions (Kołczyńska & Slomczynski, 2019). Different meanings and formats of questions across surveys are a major obstacle. Surveys that ask about past participation in demonstrations, for example, provide different time frames for when the participation occurred. Given that longer time frames allow respondents more opportunities for participation, this may lead to systematic variation in outcomes. Most surveys ask only about demonstrations, but some mention demonstrations along with other forms of protest such as marches and rallies. The different scope of protest in the questions might be another reason for variation between surveys. Whether the question wording asks about the “lawful” status of demonstrations may also affect respondents’ answers. Finally, respondents’ answers to the question that comprises a subset of questions may differ from those to the question that asks only one question about demonstrations. The SDR project creates harmonization control variables that measure these different formulations of the harmonized questions.
Another potential source of intersurvey variability is variation in data quality across surveys. The SDR framework identifies three dimensions of survey quality (Slomczynski et al., this issue; Slomczynski & Tomescu-Dubrow, 2019). The first dimension is the quality of data records in the computer file. Errors in the data files, such as a large amount of missing data and duplicate records, reduce confidence in the data. Second is the quality of surveys as mirrored in the survey documentation (Kołczyńska & Schoene, 2019). Survey methodologists suggest that survey documentation should include information on the key steps of the survey process, including the sampling scheme, response rate, questionnaire translation, questionnaire pretesting, and fieldwork control. Inadequate information in the survey documentation casts doubt on the quality of the survey. The third dimension is the consistency between the description of the data and the data records in the data file (Oleksiyenko et al., 2019). The contradiction between data documentations and the actual data may stem from errors in the stage of data processing, including data coding, variable transformation, and weighting. These three dimensions of intersurvey data quality are measured by the SDR data set.
These harmonization and survey quality variables can be used as statistical controls in the multivariate analysis to account for methodological intersurvey variability (Kwak, 2020; Slomczynski & Tomescu-Dubrow, 2019). In their assessment of these measures, Slomczynski et al. (2021) show that these measures account for at least 5% of the variation in past protest behavior and are not randomly distributed. It would seem to be important to control for these in analyses of these data.
Data and Method
Data
This research requires two sets of data: (1) to construct a weighting scale for the protest potential measurement and (2) to examine the impact of different question properties in the source survey and survey qualities on intersurvey methodological variability. The first uses a multilevel design that nests individuals within countries. All Level-1 individual-level variables are derived from the 1996 International Social Survey Program (ISSP): Role of Government survey. This cross-national survey provides separate items about respondents’ past participation in the past 5 years and future willingness for joining demonstrations, 1 which makes it possible to capture the willingness of those who have previously participated in demonstrations to engage in future demonstrations. To this data set, I append a Level-2 variable for a country’s history of democracy based on democracy scores devised by the scoring method of Hadenius and Teorell (2007). The final sample size for creating a weighting scale is 4,684 individuals nested within 22 countries. 2
The second analysis uses the SDR database version 1.1 to examine the impact of question properties and qualities of the source survey on intersurvey methodological variability of protest potential. The SDR harmonized variables addressing political protest, institutional trust, and demographic information from 1,721 national surveys stemming from 22 international survey projects, covering 142 countries and territories in 1966-2013. This SDR data also include control variables that measure the possible sources of intersurvey methodological variability in the formulation of questionnaires and survey qualities. To examine the effects of the control variables on intersurvey variability, I restrict the sample to countries with multiple surveys in the same year, which covers 77 national surveys in 38 country-years between 1995 and 2008. In this sample, Brazil had three surveys in 2006, and another 37 country-years have two surveys each year. After listwise deletion, the final sample for this analysis is 107,413 individuals nested within 77 national surveys in 38 country-years.
Protest Potential for Demonstrations
Protest potential indicates respondents’ willingness to engage in future demonstrations. Most studies use various dimensions of protest activities such as signing a petition, joining in boycotts, and attending demonstrations to construct a composite index of protest potential (Barnes & Kaase, 1979; Jenkins et al., 2008; Jenkins & Wallace, 1996). This study, however, focuses only on joining demonstrations because it is the most modular form of contentious protest (Tarrow, 2011) and it is covered by both the 1996 ISSP and the SDR version 1.1 data set.
I create two protest potential variables derived from a separate question design and a forced-choice design. The first protest potential measure for a weighting scale is derived from the 1996 ISSP’s question that askes about protest willingness only. This question clearly measures protest potential because past behavior is asked about in a separate question. The original question about willingness for future protest includes four response categories, but this is recoded into binary response categories by combining “definitely would” and “probably would” responses for positive willingness and “probably would not” and “definitely would not” responses for negative willingness. This makes it comparable with the protest potential measure from the forced-choice question in the SDR version 1.1 data set.
The second variable is derived from a forced-choice question, which does not allow respondents to express willingness to participate in future demonstrations while claiming past behavior. I create the weighted protest potential measure by giving weights to the “have done” responses by the weighting scale, which is systematically created by the separate questions in the 1996 ISSP.
Predictor Variables for a Weighting Scale
Following the previous studies on protest potential, I use three sets of individual-level sociodemographic measures in the 1996 ISSP to construct a weighting scale of protest potential. Female indicates gender (0 = male, 1 = female). I include three age groups: young for 15 to 29 years, middle for 30 to 54 years, and old for 55 years and older. College education is the most important stage in educational attainment that promotes civic involvement and political interests related to political participation (Van Dyke, 2003). To capture the effect of the highest level of education completed by the respondent, I create college graduate, which measures whether the respondent earned a bachelor’s degree (0 = noncollege graduate, 1 = college graduate). 3 At the country level, long-standing democracy measures whether the country has a well-established democratic history (0 = new democracy and autocracy, 1 = long-standing democracy). Following Hadenius and Teorell (2007), I converted each country’s mean of Freedom House scores for political rights and civil liberties and Polity score from Polity5 to an 11-point scale ranging from 0 (autocracy) to 10 (democracy) 4 and calculated the mean of these two democracy scores. Using a threshold score of 7.5 to distinguish democracies from autocracies (Hadenius & Teorell 2007), 5 I treated countries that initiated a democratic political system prior to 1980 to “long-standing democracies” versus other countries that have either a relatively short history of democracy or still maintain features of an autocratic regime, called “new democracies and autocracies.” The annual democracy scores for the countries in the analysis are provided in the online supplement.
Harmonization and Survey Quality Control Variables
The SDR version 1.1 data set provides a set of harmonization variables that capture properties of the source questions about joining demonstrations (Kołczyńska & Slomczynski, 2019; Slomczynski et al., 2016). Time span indicates whether a time frame for when a demonstration occurred falls within the respondent’s lifetime versus past 1 to 5 years (0 = past 1 to 5 years, 1 = lifetime). The sample contains only one survey for the past year and two surveys for the past 5 years, so I integrate these two different time frames into one category. Extended meaning indicates whether, in the same question or a set of questions within the same survey, the respondents are asked about other events such as marches, protests, or sit-ins as well as demonstrations (0 = no, 1 = yes). Illegality indicates if the question mentions the illegal status of demonstrations (0 = no, 1 = yes). 6
I use three survey quality indexes created from the SDR framework to account for varying survey quality (Slomczynski & Tomescu-Dubrow, 2019). Quality of computer files measures errors or inaccuracies in computer data files by constructing an additive scale ranging from 0 to 3 in three dichotomous variables that capture whether the survey has (1) nonunique records, (2) more than 5% of missing data on either age or gender, and (3) errors in respondent IDs. Quality of documentation measures survey quality as reflected in the documentation of the source data (Kołczyńska & Schoene, 2019; Tofangsazi & Lavryk, 2018). This index is also created as an additive scale that ranges from 0 to 5 and is based on five dichotomous variables that measure whether the survey documentation has information on (1) sampling, (2) response rate, (3) control of the quality of the questionnaire translation, (4) questionnaire pretesting, and (5) fieldwork control. Finally, quality of data processing measures contradictions between the data file and the survey documentation provided by the survey project or data archive, which includes illegitimate variable values, misleading variable values, contradictory variable values, variable values discrepancy, and lack of variable value labels (see Oleksiyenko et al., 2019). This index is created by counting the number of errors in seven selected variables (gender, age, birth year, education level, schooling year, trust in parliament, and participation in demonstration) and dividing it by the total number of variables in the survey (Oleksiyenko et al., 2019). This index, therefore, captures the number of processing errors normalized against the total number of variables in the survey. For each index, higher values indicate poorer quality. Descriptive statistics for all variables in the sample are listed in Table 1.
Descriptive Statistics for Variables in the Analysis.
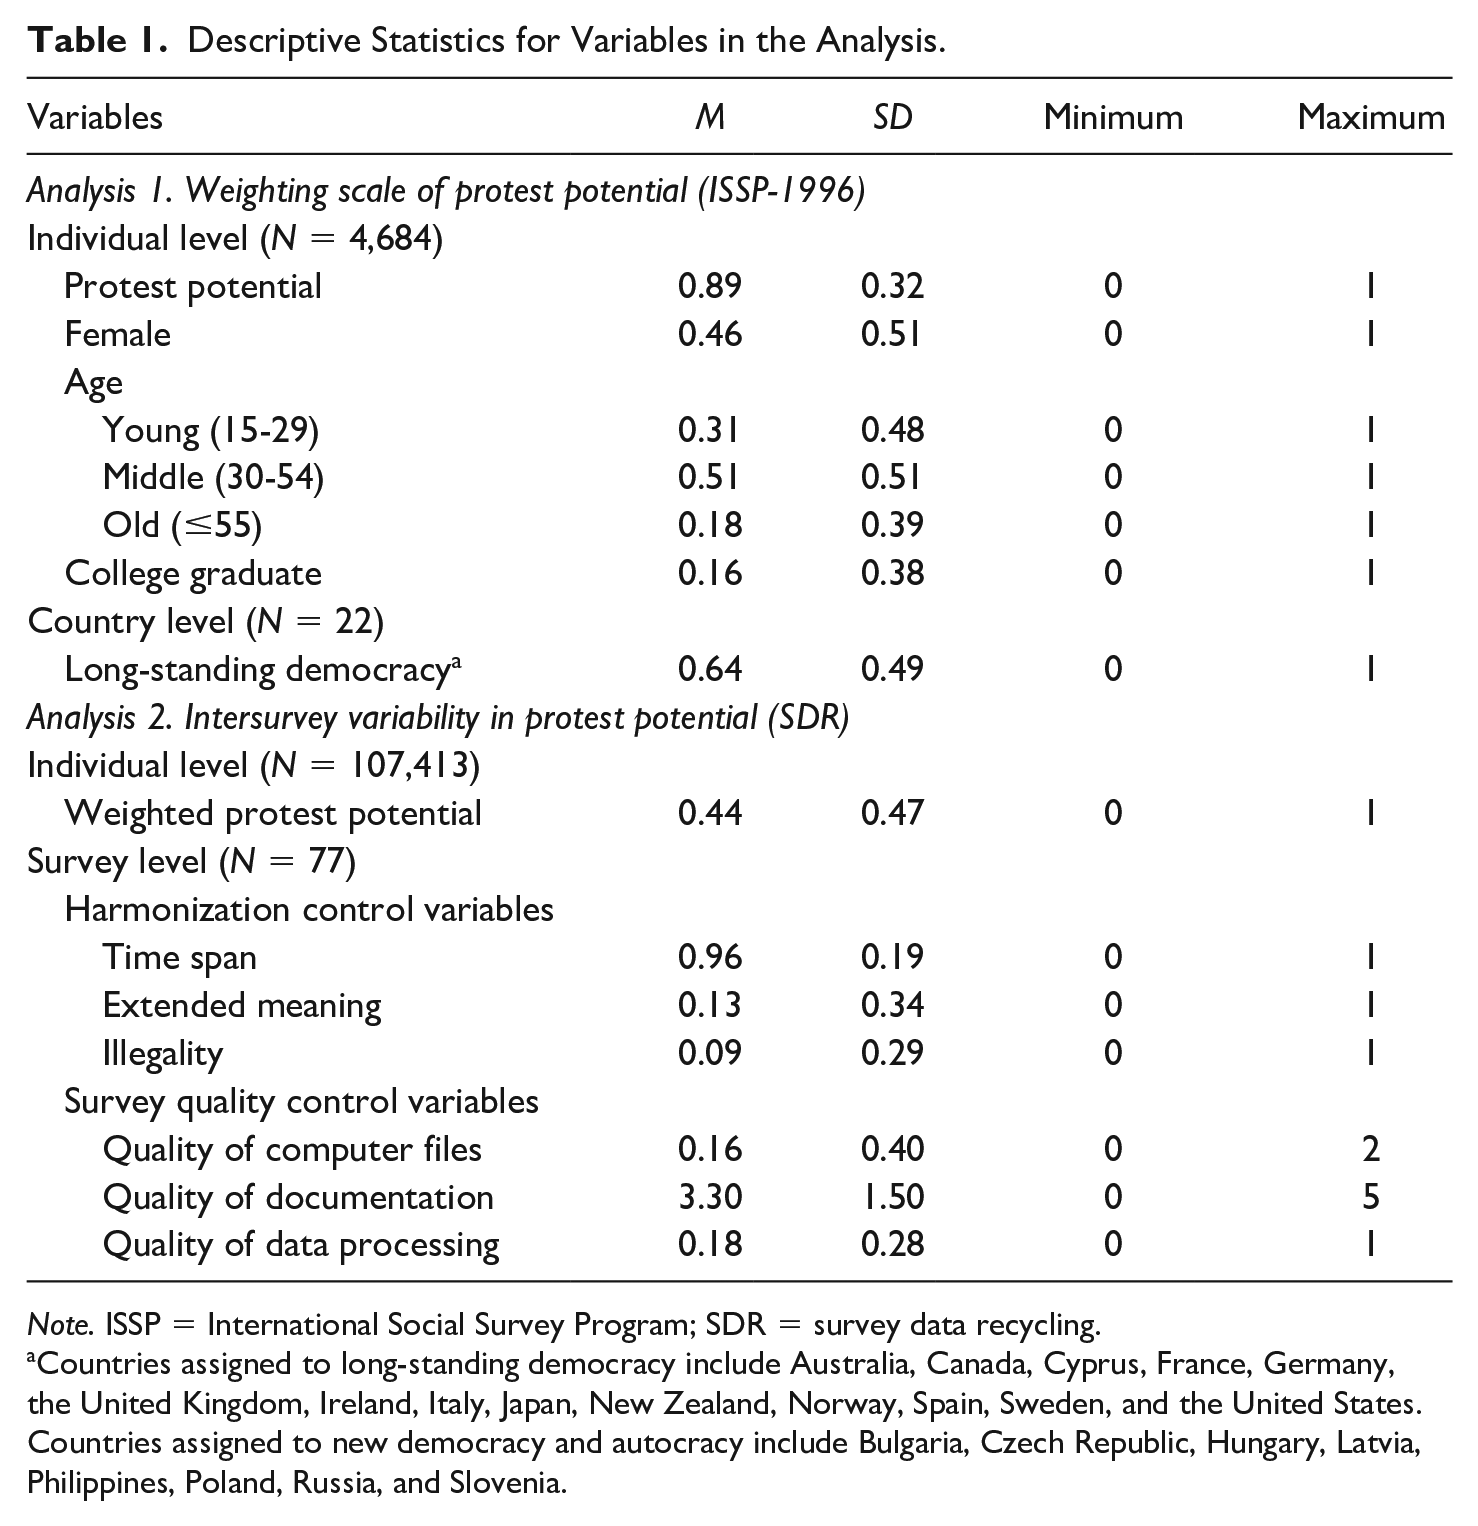
Note. ISSP = International Social Survey Program; SDR = survey data recycling.
Countries assigned to long-standing democracy include Australia, Canada, Cyprus, France, Germany, the United Kingdom, Ireland, Italy, Japan, New Zealand, Norway, Spain, Sweden, and the United States. Countries assigned to new democracy and autocracy include Bulgaria, Czech Republic, Hungary, Latvia, Philippines, Poland, Russia, and Slovenia.
Analytical Strategy
In Analysis 1, I examine a multilevel logistic regression model for the binary protest potential measure from the 1996 ISSP for 4,684 individuals nested within 22 countries to construct a weighting scale of protest potential. This weighting scale represents the likelihood of being willing to participate in demonstrations for respondents who declared past participation. Given the previous research on differential protest potential by individual- and county-level features, I estimate a multilevel logistic model for the cross-level interaction of the sociodemographic variables for gender, age, and education and the country indicator of democratic history after restricting the sample to those who have participated in demonstrations. I then estimate predicted probabilities of protest potential for 24 subgroups as defined by the combination of gender (male, female), age (young, middle, old), education (noncollege graduate, college graduate), and history of democracy (new democracy and autocracy, long-standing democracy).
The multilevel logistic regression model for interaction analysis for protest potential can be represented by the following equation:

where the left-hand-side component is the log odds of protest potential for individual i in country j, b0 is the intercept, x1. . .4ij represent four individual-level covariates (female, young, old, and college graduate) for individual i in country j, d0j is country-level binary indicator for the history of democracy (long-standing democracy), and U0j is a country-level random effect.
In Analysis 2, I examine a three-level multilevel linear model for the weighted protest potential measure, which is applied by the weighting scale, from the SDR database for 107,413 individuals nested within 77 surveys in 38 country-years (24 countries) to assess whether harmonization and survey quality control variables solve the issue of methodological variability between surveys in the same country-year. The SDR data have a three-level hierarchical structure with respondents who are clustered within national surveys nested within country-years. Because national surveys are conducted with a nationally representative sample, the protest potential at the aggregate level should be theoretically the same between national surveys collected in the same year (Kwak, 2020). The practical intersurvey differences of these aggregate measures are treated as unmeasured errors that might be inherent in properties of the question in the surveys or might occur during the fieldwork and data processing (Slomczynski & Tomescu-Dubrow, 2019). This analysis tests whether the harmonization and survey quality control variables adjust for the intersurvey variability, using the sample restricted to country-years that have multiple surveys.
The three-level linear multilevel model for this analysis takes the following form:

where yijk is the weighted protest potential for individual i nested within survey j in country-year k, b0 is the intercept, h1 . . . 3jk represent three harmonization control variables in survey j in country-year k, q4 . . . 6jk represent three quality control variables in survey j in country-year k, uk is country-year random effect, ujk is survey-level random effect, and eijk is individual-level random effect.
I examine intraclass correlation coefficients (ICCs), which are derived from variance components—uk, ujk, eijk—in the model. ICCs represent not only the degree of similarity between individuals of the same grouping factor but also the amount of variation explained by the grouping factor (Pais, 2010). The country-year-level and survey-level ICCs are calculated in the following manner:


The country-year-level ICC indicates the similarity among individuals within the same country-year but different surveys. The survey-level ICC represents not only the homogeneity among individuals in the same survey and, therefore, the same country-year but also how much individuals’ variation in protest potential is attributed to difference of protest potential between surveys in the same country-year. The impact of the SDR control variables on intersurvey variability can be identified by a change in ICCs between a null model and a constrained model that adjust for the effect of the controls.
Results
Analysis 1: Weighting Scale of Protest Potential
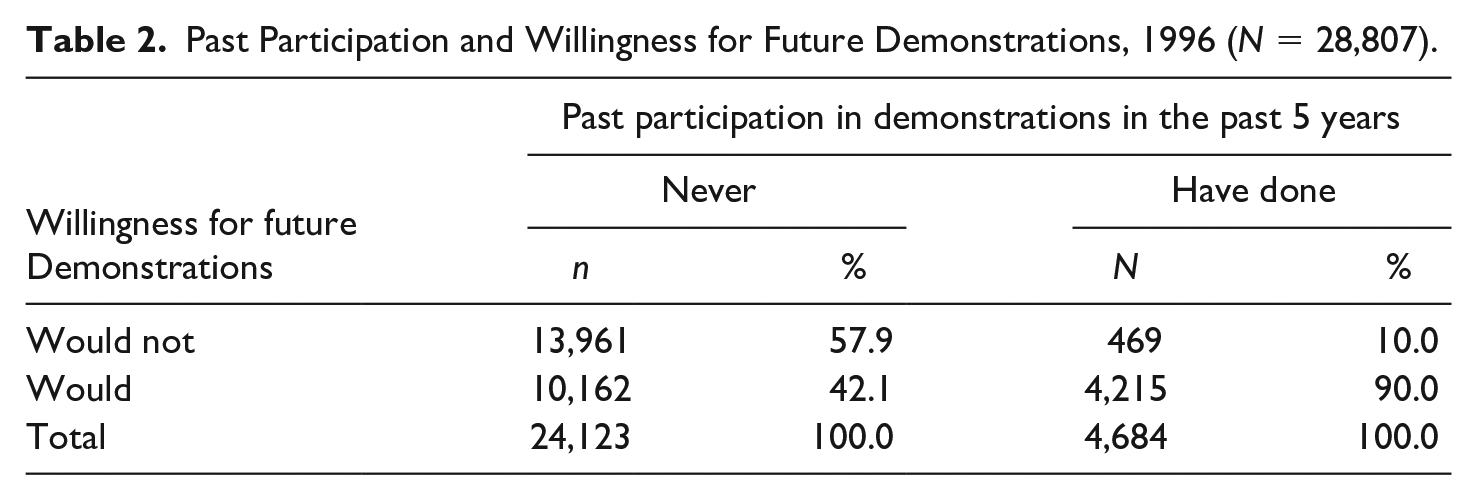
Table 2 presents the cross-tabulation between past participation in demonstrations and willingness for future demonstrations from the separate questions in the 1996 ISSP. I found that 57.9% of respondents who have never participated in demonstrations in the past 5 years are not willing to participate in future demonstrations, whereas 42.1% expressed that they would do demonstrations in the future. Among those who have previously attended demonstrations, 10% said that they would not do it again, but 90% expressed a willingness to engage in the same kind of demonstration again in the future. This finding shows that there is at minimum a 10% error if protest potential measures give equal or greater weight to past participation than to people’s expressed willingness. Therefore, the conventional weighting approaches to the protest potential measure seem to be invalid.
Past Participation and Willingness for Future Demonstrations, 1996 (N = 28,807).
To construct a weighting scale of protest potential, I examine whether respondents’ sociodemographic characteristics and the country’s history of democracy affect protest potential among those who report participating in the past. Since this is a restricted sample, effects may differ from those with full population samples. Table 3 displays results for the multilevel logistic regression models for the individuals who reported past participation in demonstrations in 22 countries. Model 1 shows that the main effects of all predictors are in the expected direction. I found that gender has no statistically significant effect, although the expected negative direction of the odds ratio with a t score above 1.00 suggests that women with past participation might have lower protest potential than comparable men. The results of age groups showed that the middle age group has significantly stronger protest potential than young and old age groups. The effect for college graduates is nonsignificant, but its positive direction is consistent with the expectation that the better educated has a stronger willingness for protests. The country-level variable of long-standing democracy has a positive significant effect, suggesting that citizens who live in countries that have a long stable history of democracy have stronger protest potential for demonstrations.
Multilevel Logistic Regression of Protest Potential for Respondents Who Have Previously Participated in Demonstrations, 1996 (N = 4,684 Individuals Nested Within 22 Countries).
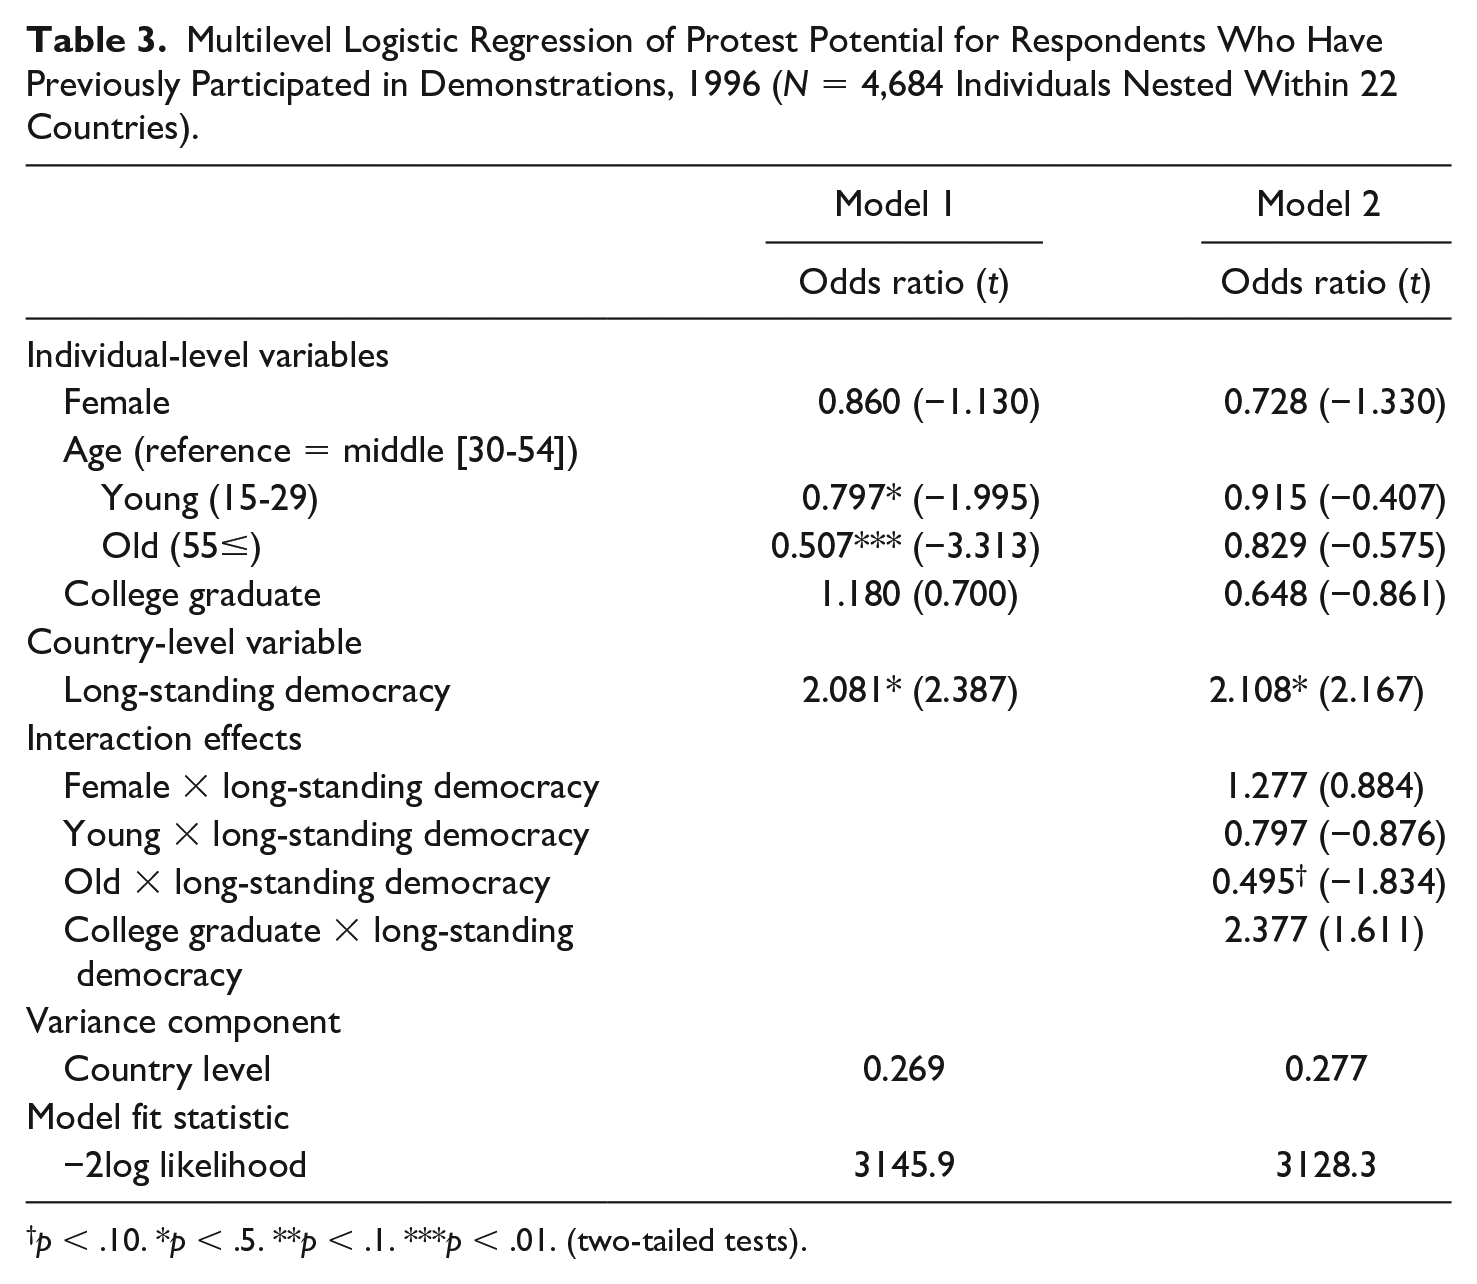
p < .10. *p < .5. **p < .1. ***p < .01. (two-tailed tests).
In Model 2, I include cross-level interactions of individual-level predictors and the country-level indicator of democratic history to test whether the context of democracy affects the impact of individual-level predictors. Among the four interactions, only one is statistically significant—the interaction between long-standing democracy and the old age group is negatively associated with protest potential at p < .10. This result shows that the gap of protest potential between the middle and the old age groups might be larger in long-standing democracies than in new democracies and autocracies. Though not significant, the positive interaction of long-standing democracy with college graduate with a t score of 1.611 and the negative main effect of college graduate suggests that college graduates in long-standing democracies might have stronger protest potential than noncollege graduates, whereas college graduates in new democracies and autocracies might have lower protest potential than noncollege graduates. As a result, the effects of the individual-level predictors on protest potential slightly differ across the country’s history with democratic institutions.
Using Model 2 of Table 3, I estimate predicted probabilities of protest potential for 24 subgroups as defined by the combination of the four predictors. The predicted probabilities represent an expected level of protest potential for those who have previously participated in demonstrations, so I use these predictions for a weighting scale for the protest potential measure derived from the forced-choice question. Table 4 presents a weighting scale of the protest potential measure applied in the SDR data, which give the same weights to past and potential participation. I give weights to the “have done” responses by the 24 subgroups’ predicted probabilities of protest potential, whereas the “would never do” and the “would do” responses in the SDR data maintain their original values because these responses clearly present respondents’ protest potentials. Consistent with the result of Table 3, the average protest potential of all gender-age-education groups for long-standing democracy (M = 0.898) is higher than new democracy and autocracy (M = 0.780). The subgroups that have the lowest protest potential are college-graduated older women (0.698) for new democracy and autocracy but non-college-graduated older women (0.821) for long-standing democracy. Noncollege middle-aged men (0.850) have the highest protest potential among subgroups in new democracies and autocracies, whereas college middle-aged men attain the highest potential (0.947) in long-standing democracies. These results show that the weighting scale captures divergent protest potential of those who reported past participation across sociodemographic groups and the country’s history of democracy.
Weighting Scale for the Protest Potential Measure.
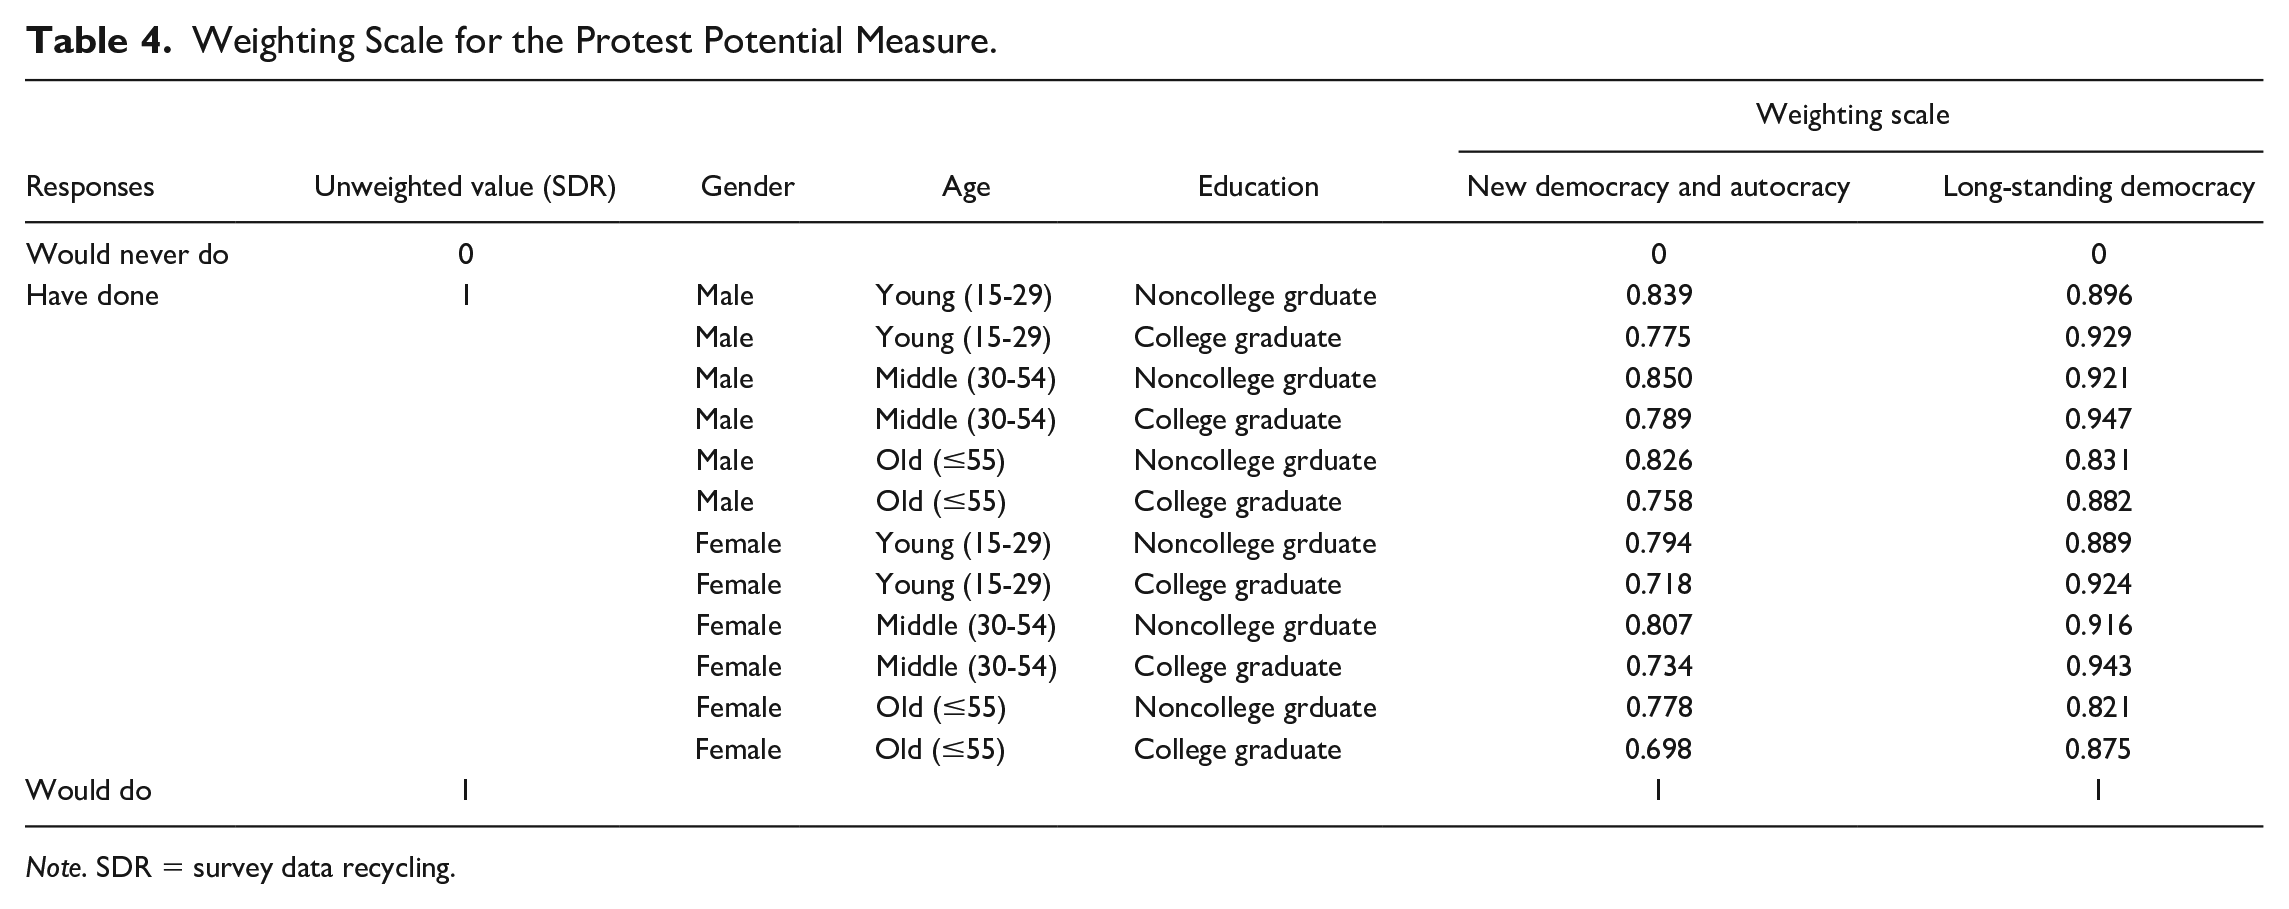
Note. SDR = survey data recycling.
Table 5 compares mean values of the protest potential measure from the forced-choice question of the WVS in 1996 with the one from the pure protest willingness question in the 1996 ISSP across four countries that joined both surveys. The weighted measure by the weighting attains an average protest potential score of 58.4% in the four countries. The weighted scores are lower than the unweighted scores that give equal weight to the “have done” and the “would do” responses in all four countries. All the countries except for the Philippines have higher unweighted protest potentials than the ISSP protest willingness scores and, on average, the weighting scale reduces the difference between WVS and ISSP from 13.4% to 10.7%. This result shows that the weighting scale contributes to addressing the conventional protest potential measure’s overestimation of the “have done” responses.
Country Means of Protest Potential From WVS and ISSP, 1996 (%).
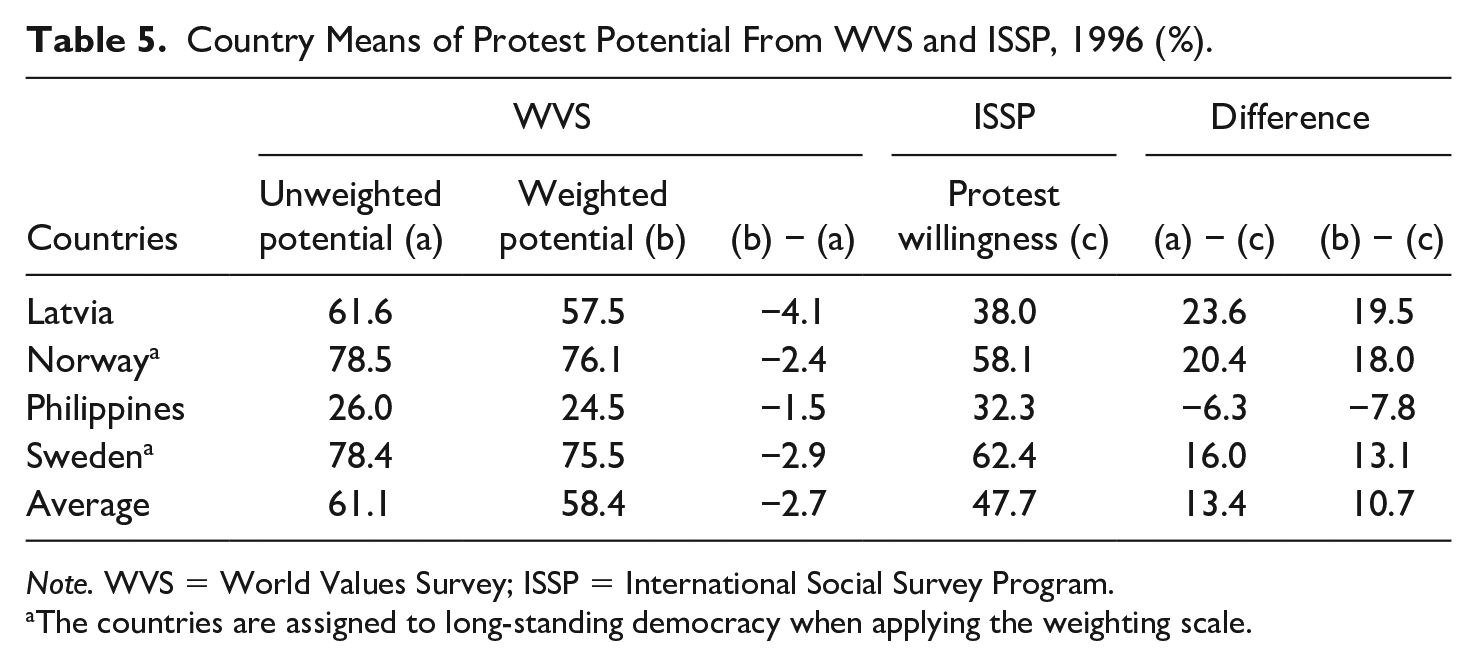
Note. WVS = World Values Survey; ISSP = International Social Survey Program.
The countries are assigned to long-standing democracy when applying the weighting scale.
However, it is notable that the gap between the two measures is large. The weighting scale is based on respondents who have already participated in demonstrations during the past 5 years, but the “have done” response in the WVS is measured by respondents’ lifetime experience. Different time frames in the question might limit precise comparison between the measures. It is also important to note that the weighted measure in the Philippines expands the gap of protest potentials between the two measures. Differences in the quality of national surveys might lead to this issue because the Philippines’ WVS has poorer survey documentation (quality of documentation = 5) than the ISSP survey (quality of documentation = 1). Therefore, cross-national research on protest potential needs to take into account intersurvey variability in terms of the question properties and data qualities across surveys.
Analysis 2: Intersurvey Methodological Variability in Protest Potential
In the second analysis, I examine whether the harmonization and quality control variables reduce the variability in the aggregate protest potential between surveys. Table 6 displays the survey-level means of the weighted protest potential in 77 national surveys within 38 country-years. The national surveys within the same country-year should theoretically produce identical mean values of weighted protest potential, but I found that the mean for the intersurvey differences in the same country-years is 12.4%. It is notable that Tanzania-2001(70.6%) and Nigeria-2000 (43.5%), which include the AFB, attain tremendous differences between surveys. This suggests that the question properties and the qualities of the source surveys might be related to intersurvey variability.
Country Means of Weighted Protest Potential for 77 National Surveys Within 38 Country-Years (%).
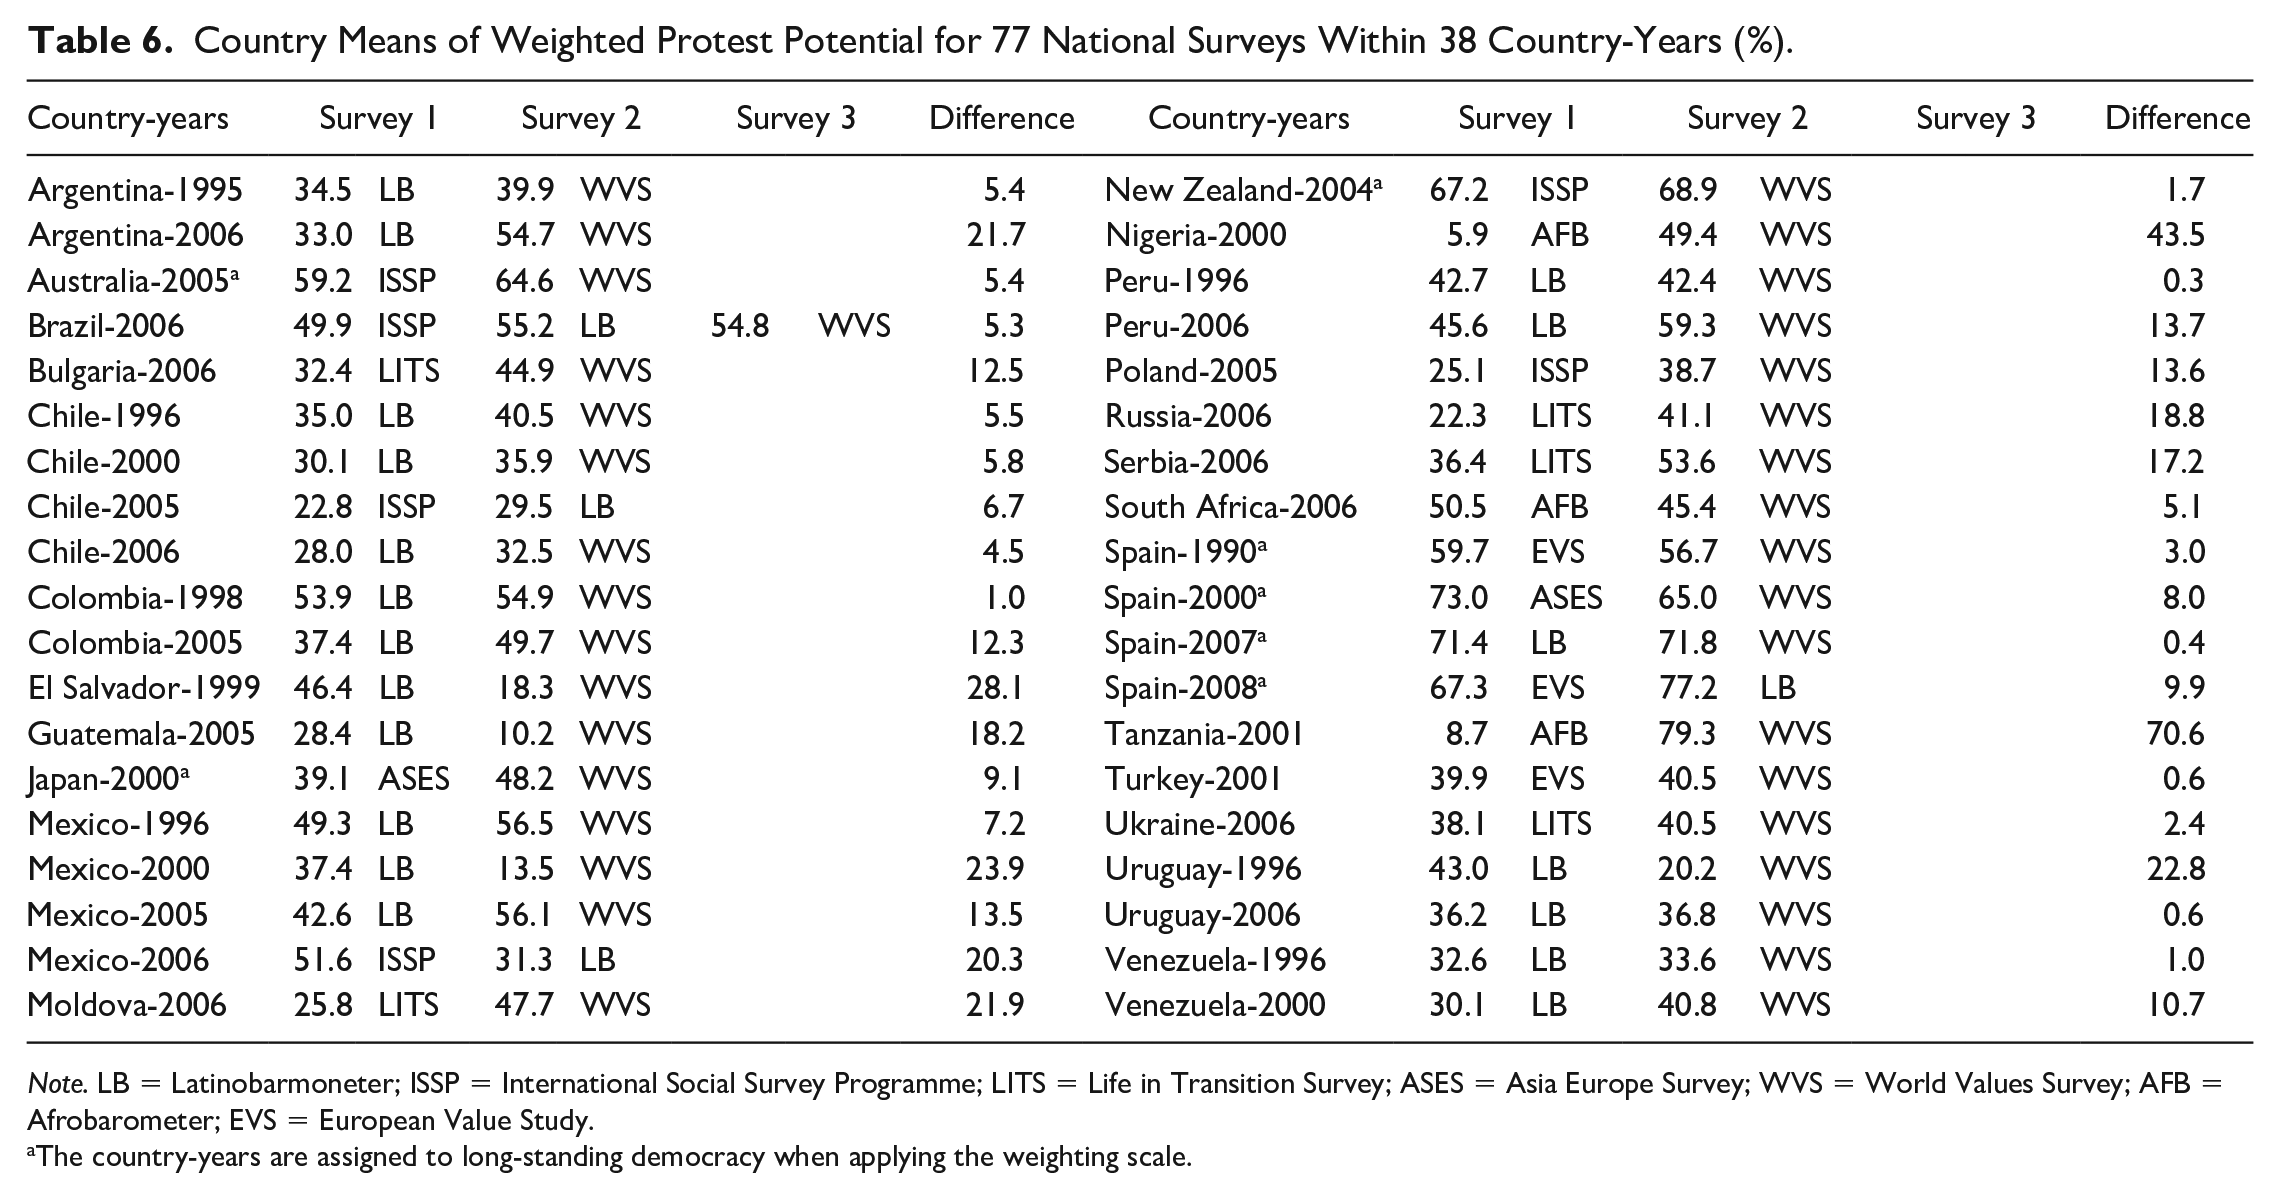
Note. LB = Latinobarmoneter; ISSP = International Social Survey Programme; LITS = Life in Transition Survey; ASES = Asia Europe Survey; WVS = World Values Survey; AFB = Afrobarometer; EVS = European Value Study.
The country-years are assigned to long-standing democracy when applying the weighting scale.
Table 7 presents three-level multilevel linear models of weighted protest potential. This analysis captures whether harmonization and survey quality control variables affect intersurvey variability. Model 1 is a null model that does not include any covariates. The ICCs in Model 1 show that 4.2% of variance of protest potential is explained by country-year-level variation, and 11.5% of variance is attributed to the survey-level variation, which suggests that protest potential is affected by survey factors more than country-year context.
Three-Level Linear Multilevel Regression of Weighted Protest Potential (N = 107,413 Individuals Nested Within 77 National Surveys in 38 Country-Years).
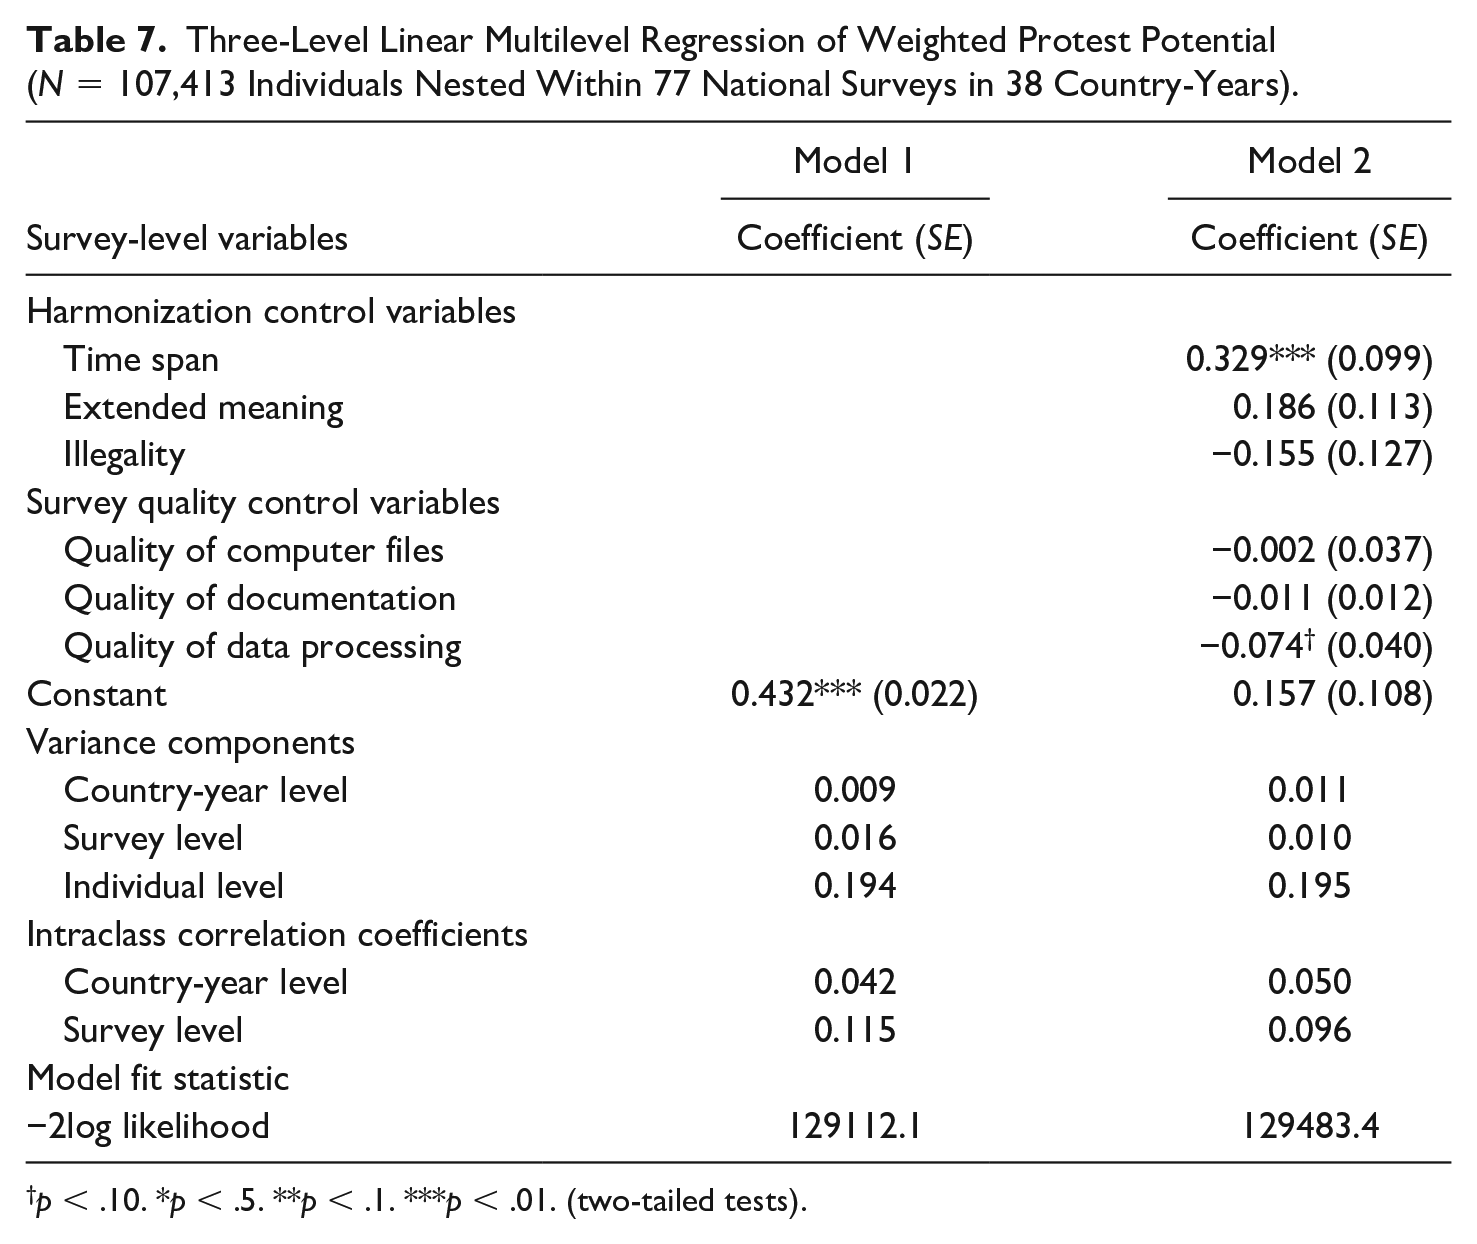
p < .10. *p < .5. **p < .1. ***p < .01. (two-tailed tests).
In Model 2, I include three harmonization control variables and three survey quality control variables. The positive effect of time span suggests that the time-delimited question obtains stronger protest potential than the question that limits the time frame to the past 1 to 5 years. This result explains the large difference between surveys for Tanzania-2001 and Nigeria-2000 in Table 6 because these two country-years include the WVS that asks about lifetime participation and the AFB that asks about participation in the past 5 years. This suggests that different time frames between surveys increases intersurvey variability. The negative effect of quality of data processing (p < .10) shows that surveys with more contradictions between the data file and survey documentation decrease protest potential. The effects for qualities of computer files and documentation are negative but statistically nonsignificant. The negative direction of all survey quality controls suggests that poor survey qualities might systematically underestimate protest potential.
Comparing ICCs between the null and the constrained model shows that the country-year-level ICC increases by 19.0% (= [0.050 − 0.042] / 0.042 × 100). This result indicates that the harmonization and survey quality controls increase the similarity of protest potential among individuals in different surveys within the same country-year. I also find that the survey-level ICC declines by 16.5% (= [0.096 − 0.115] / 0.115 × 100), indicating that the harmonization and survey quality controls reduce the unexplained variance between surveys in the same country-year. This suggests that adjusting for the question properties and survey qualities increases the homogeneity of protest potential between surveys—that is, it reduces intersurvey methodological variability in protest potential.
Conclusion
Research on protest potential has relied on international surveys to measure and analyze willingness for future protests, but both a measurement of protest potential and a comparative research method for the harmonized data remain underdeveloped. First, this article examined a new weighting scale for the protest potential measure to address the limitation of a forced-choice survey item that prevents respondents who declared past participation from expressing their willingness for future protests. Using the separate items about respondents’ past participation and willingness for future demonstrations in the 1996 ISSP, I constructed a weighting scale by estimating predicted probabilities of protest potential for 24 subgroups—as defined by gender, age, education, and a country’s history of democracy—who had previously participated in demonstrations. In the analysis with the WVS to which I applied the weighting scale, I found that the previous arbitrary weighting scales significantly overestimate protest potential at the aggregate level.
This analysis emphasizes the advantages of the weighted protest potential measure. First, it captures protest potential for those who declared past participation. Previous measures arbitrarily assumed that past participation guarantees future participation, and consequently this unverified assumption led to the overestimation of protest potential. In contrast, the weighted protest potential measure draws on external survey data that enable the estimation of predicted probabilities of holding protest willingness for those who have previously participated in protest. Measurement based on the external benchmark contributes to more precisely measuring protest potential. Second, it reflects divergent protest potential across subgroups. Prior studies suggest that there is a disparity in protest potential across sociodemographic groups and a country’s history of democracy. This weighted protest potential measure adequately captures the variable probabilities of protest potential for each subgroup and macro political context.
In the second analysis, I examined the tools provided by the SDR framework to address methodological intersurvey variability in the protest potential measure from the harmonized cross-national data. Three-level multilevel analysis shows that adjusting for the different properties of questions in the source survey and variation in survey quality helps improve comparability between surveys. Survey data harmonization for broader cross-national and temporal coverage is needed to test theories developed in the Western democracies, but it is challenging because these individual surveys were not originally designed to be comparable. This analysis of intersurvey methodological variability suggests that research with multiple national surveys should implement controls like those used by the SDR project to control for intersurvey variability.
These analyses are limited by data availability. I used the 1996 ISSP to construct a weighting scale because that is the only international survey that asked separate questions about past participation and willingness for future protest as well as basic sociodemographic questions for gender, age, and education. My weighting scale does not account for the potential time-varying effects of the sociodemographic variables on protest potential because the 1996 ISSP is limited to 1 survey year. However, there is some evidence that at least in the United States the effects of gender, age, and education on protest participation were consistent between 1973 and 2008 after controlling for period and cohort effects (Caren et al., 2011). Testing whether the current weighting scale is homogeneous with the scales derived from other separate questions that might be available in the future would contribute to constructing a more elaborate weighting scale. This article also focused only on demonstrations because of the limited harmonized variables for protests in the SDR. Protest potential for various forms of protest would enable us to understand the level of contentiousness that people can accept in society and to see if a composite protest potential index is different.
Even with these limitations, the rationale for the measurement and analytical methods in this article is worth applying to future research on protest potential. It is for future research to examine whether attitudes about potential behavior are relevant to actual future behavior. Protest potential indicates individual willingness to engage in future protest, but the mechanisms linking protest potential to actual protest behavior remains unclear. The appropriate measure of protest potential and broader cross-national and temporal coverage would fill this gap by making it possible to examine how protest potential in the past is transferred to protest participation in the future at the aggregate level. This methodological development also contributes to the precise testing of the individual and contextual factors that affect protest potential in a global context beyond the affluent Western democracies.
Supplemental Material
sj-xlsx-1-abs-10.1177_00027642211021626 – Supplemental material for Measuring and Analyzing Protest Potential From a Survey Data Recycling Framework
Supplemental material, sj-xlsx-1-abs-10.1177_00027642211021626 for Measuring and Analyzing Protest Potential From a Survey Data Recycling Framework by Joonghyun Kwak in American Behavioral Scientist
Footnotes
Declaration of Conflicting Interests
The author declared no potential conflicts of interest with respect to the research, authorship, and/or publication of this article.
Funding
The author disclosed receipt of the following financial support for the research, authorship, and/or publication of this article: This article was supported by funding from the National Science Foundation (SBE-1738502).
Notes
Author Biography
References
Supplementary Material
Please find the following supplemental material available below.
For Open Access articles published under a Creative Commons License, all supplemental material carries the same license as the article it is associated with.
For non-Open Access articles published, all supplemental material carries a non-exclusive license, and permission requests for re-use of supplemental material or any part of supplemental material shall be sent directly to the copyright owner as specified in the copyright notice associated with the article.