
Abstract
Scholars have focused on the relationship between income inequality and voter turnout cross-nationally and within the United States. However, rising inequality and declining turnout has afflicted Canada to a greater extent than most other Western countries. As turnout in Canadian federal elections began to decline appreciably in the 1990s, inequality began to rise. With multilevel pooled analysis utilizing Canadian Election Studies from 1984 to 2015, party manifesto data, and measures of inequality at the subnational level, this article tests the effects of income inequality on turnout in Canada, and whether the relationship is conditioned by party policy programs. In line with relative power theory, mixed-effects regressions indicate that inequality is negatively associated with turnout, especially for low-income earners. However, latent conflict is manifested when political parties propose greater redistribution, as the negative effects of inequality on turnout are then significantly alleviated.
Introduction
Voting has long been viewed as being interrelated with the performance and health of a democracy and thus a decline in voter turnout produces anxiety over the future of liberal democracy (Gidengil & Bastedo, 2014). While declining voter turnout has many correlates, such as declining youth participation and socioeconomic factors (LeDuc & Pammett, 2014), others have pointed to economic inequality (C. J. Anderson & Beramendi, 2008; Filetti, 2016; Galbraith & Hale, 2008; Jaime-Castillo, 2009; Jensen & Jespersen, 2017; Lancee & Van de Werfhorst, 2012; Lister, 2007; Mahler, 2002; Schäfer, 2013; Solt, 2008, 2010; Steinbrecher & Seeber, 2011).
Mounting evidence also demonstrates that governments are far more responsive to the wealthy over everyone else (Bartels, 2008; Bowman, 2020; Gilens, 2012; Hacker & Pierson, 2010; Schakel, 2019). Thus, the nature of the relationship between income inequality and voting is important because widening income inequality can concentrate political and decision-making power in the hands of a few. Both the “relative power” and “power resource” theories posit that a greater concentration of wealth and, therefore, political power, leads to reduced turnout, especially for the lower classes (Goodin & Dryzek, 1980). However, policies that focus on the lower classes can help mitigate inequality. Conflict theory predicts that by demanding greater redistribution through mass participation in elections, lower classes can potentially redress this power imbalance (Meltzer & Richard, 1981). Indeed, as Mahler (2008) demonstrates, electoral turnout is positively related to redistribution in Western democracies. Yet, the evidence for conflict theory is sparse and the empirical utility of the accompanying median voter theorem has been questioned (Kenworthy & McCall, 2008).
A potential explanation for the lack of evidence in favor of conflict theory could be owing to the fixation that the inequality and turnout literature has had with the demands of citizens, while neglecting the potential influence that the party aspect can have. As scholars have so far primarily concentrated on the “bottom up” or demand side of the equation and neglected the “top down” supply side. However, a growing consensus of academics now emphasize that party supply—in terms of the choices that parties present to the public—substantively matter for political participation (Evans & de Graaf, 2013; Heath, 2015; Leighley & Nagler, 2014). In the context of rising inequality, how parties respond through their manifesto positions on redistribution, should then exert greater influence on whether people decide to participate in voting. Recent evidence also shows that voters do indeed listen to parties and understand their policy messages, especially on the issue of redistribution (Somer-Topcu et al., 2020). Therefore, this study builds on the previous literature by incorporating an unexplored mechanism potentially moderating the relationship—the programmatic policy choices on redistribution of political parties.
Moreover, although scholars have examined the relationship between inequality and turnout cross-nationally, and within the United States, none have focused on the relationship between inequality and turnout in Canada. Canada has experienced one of the most rapid and sustained increases in income inequality (Organisation for Economic Co-operation and Development [OECD] 2015) and one of the most dramatic declines in voter turnout across the OECD (Gidengil et al., 2004). Turnout in federal elections began to decline appreciably in the 1990s, precisely when income inequality began to substantially rise. For example, between 1993 and 2004, turnout plummeted 15% and remained at this new level for the following three elections (Elections Canada, 2019). Whereas income inequality climbed 10% and has remained around this new level since (Heisz, 2016).
Only nine cross-national studies on the topic have contained Canadian elections in the estimations, with two thirds finding a negative and significant effect overall (mirroring the results of the overall pool of studies). Canada features in four of the five aggregate-level studies (Fumagalli & Narciso, 2012; Lister, 2007; Mahler, 2002; Stockemer & Scruggs, 2012), ranging in inclusion between 2 and 12 elections, from 1965 to 2008. However, only five individual-level studies feature Canadian elections from international surveys, which are typically smaller than the Canadian Election Study (CES; C. J. Anderson & Beramendi, 2008; Jaime-Castillo, 2009; Persson 2010; Schäfer 2013; Solt, 2008). Each study includes between one and three of the federal elections held between 1993 and 2004, for a mere nine cumulative elections. Furthermore, in the Canadian context, research has largely explored each phenomenon exclusive of one another and “no completely satisfactory answer for why turnout has declined in Canada has been reached” (C. D. Anderson & Stephenson, 2010, p. 27). Thus, the income inequality and turnout relationship in Canada remains considerably unexplored, despite it being an ideal case study.
Therefore, this study seeks to address these gaps in the literature through a longitudinal multilevel pooled analysis utilizing CES surveys from 10 federal elections held between 1984 and 2015, as well as macro-level socioeconomic and political data, to examine the effect of income inequality on voter turnout in Canada.
The article proceeds by reviewing the Canadian story and situating it within its international comparators. This is followed by a comprehensive review of the existing relevant literature, including the key hypotheses. The research design and modelling strategy are then outlined, followed by a test of the expectations against a unique data set of 100 province-year elections over three decades. Last, the article will conclude with a discussion of the key limitations, implications, and avenues for future enquiry.
Situating Canada
Income Inequality
Income inequality has risen both in countries that have traditionally had high levels of inequality such as the United States, but also in countries where it has traditionally been low, such as Denmark and Sweden. The Gini coefficient is the most popular indicator for measuring income inequality in a population and ranges between 0 and 1 (Osberg, 2018). The strength of the Gini is that it responds to all changes in the distribution of income but it tends to be more responsive to changes in the middle of the distribution, which can understate tail-end changes in inequality at the very top or bottom (Heisz, 2016). The average Gini coefficient for OECD countries stood at 0.29 during the mid-1980s but has since increased by roughly 10% (Sran et al., 2014).
Canada ranks above the OECD average in both its current inequality levels and the degree of the increase since the 1980s (Heisz, 2016; OECD, 2015). Prior to the Second World War, income inequality roughly matched current levels in Canada, then steadily declined until the late 1980s. Subsequently, between 1988 and 2004, in what has been dubbed the “Great U-Turn” (Yalnizyan, 2010, p. 4), Canada’s Gini coefficient rose dramatically from 0.282 to 0.322. It then fell after the financial crisis down to 0.312 in 2011 but has since continued its upward trajectory (Statistics Canada). As Figure 1 shows, the steepest rise in the Gini rate 1 occurred in the mid-1990s, which coincides precisely when the largest decline in federal turnout occurred. Inequality rose dramatically in the 1990s, largely due to Canadian governments shifting to the right by substantially reducing redistribution in its tax and transfer system, which had previously kept pace with rising market inequality (Banting & Myles, 2013; Heisz & Murphy, 2016).
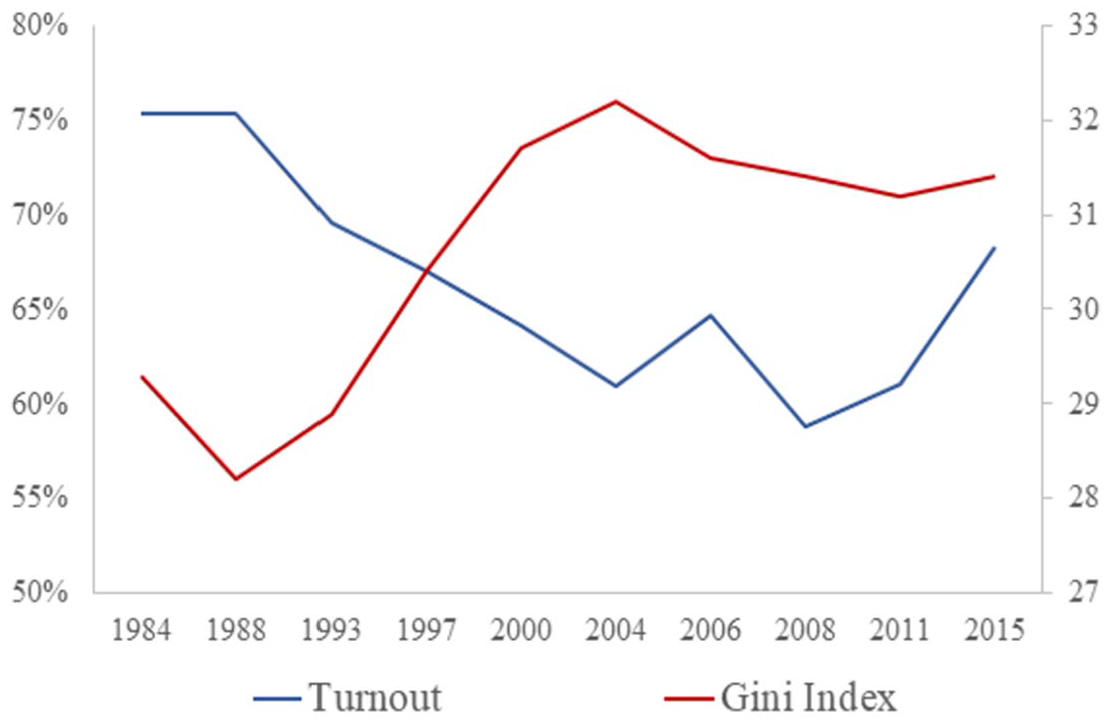
Turnout by Gini Index, Canada, 1984–2015.
Examining inequality across provinces and time has many advantages. 2 Canadian provinces possess considerable comparable autonomy in administering social policy and research shows that inequality shifts are predominantly owing to provincial rather than federal transfers (Boychuk, 2013). Inequality has risen across every Canadian province and region since 1988, although each province has experienced their own trajectory (Yalnizyan, 2014). Canada’s richest provinces (Alberta, British Columbia, and Ontario), along with Newfoundland, have witnessed the largest rises, while New Brunswick, Quebec, and Saskatchewan the smallest increases. Saskatchewan was able to avoid the sizeable rises that occurred throughout the rest of the country in the 1990s, likely owing to the domination of its government by the leftist New Democratic Party during the 1990s (Sealey & Andersen, 2015). While, Newfoundland has differed from its Maritime neighbors in witnessing a pronounced rise in recent years following an offshore oil boom (Fortin & Lemieux, 2016).
Voter Turnout
Across the West, voter turnout has declined steadily from an average of 82% in the 1970s to 72% (Schäfer & Streeck, 2013). The trend is nearly universal and the decline in turnout is particularly acute in Switzerland, and three Anglo-Saxon countries (the United Kingdom, the United States, and Canada). Postwar turnout at national elections averaged around 75% in Canada until 1988. Since then it has declined dramatically and averaged in the low-60s in the five elections between 2000 and 2011 (See Figure 1 above). The one exception being the 2015 election, which saw a substantial rise to 68.3%. However, it remains to be seen if this number is sustainable long-term, as it was an unusually competitive election, with essentially a three-way dead heat in polling up until the final few weeks of the campaign. There was also a deep desire for change, and much of the increase was owing to unprecedented youth turnout, despite continued underlying apathy and low political knowledge among the young (Urban, 2016). Although the turnout rates since 2000 have been roughly 10 percentage points higher than American presidential elections, they are still around 10 percentage points lower than the median average turnout for OECD members (Blais & Rubenson, 2013).
The leading explanations as to why Canada’s turnout is comparatively low, stem from its political system and demographics. As turnout tends to be lower by 3 percentage points in majoritarian systems, and tends to be lower in federal systems, as well as large, sparsely populated countries (Gidengil et al., 2004). Consensus is lacking in explanations for Canada’s marked turnout decline, which is particularly acute among the young. The leading explanations rely on period cohort effects in recent generations having lower political interest, knowledge, and civic duty (Blais et al., 2004), and a decline in the competitiveness of elections (Johnston et al., 2007).
Canada is also an anomaly in having higher turnout in subnational elections (Studlar, 2001). This is in part owing to Canada’s pronounced regionalism and diversity. As according to Fearon’s (2003) diversity index, it is the most ethnically and culturally diverse Western country. Exemplifying this regional diversity, Canada’s two Atlantic island provinces have long stood out on turnout. Prince Edward Island has since Confederation had the highest turnout, due to its extremely small constituency sizes and high interest in politics, while Newfoundland stands out as long having had the lowest turnout, due to it being a latecomer in joining Canada (1949), lower education levels, and general disengagement toward federal affairs (Blake, 2005). The island provinces have maintained their leading positions at opposite ends of the spectrum, having experienced largely uniform declines in turnout. Moreover, Alberta has voted the second least in all but three of the 10 elections, while the remaining provinces tend to not substantially differ from one another each election.
Previous Literature
Although most of the West has witnessed declining turnout and rising inequality the past few decades, only in recent years have scholars focused on the relationship between the two. They have so far only examined the relationship between income inequality and turnout cross-nationally, and within the United States. Country-case studies have also only been undertaken twice—a decade ago—involving American presidential (Galbraith & Hale, 2008), and gubernatorial (Solt, 2010) elections. Within this literature, inequality has been found to exert either a negative or null relationship on turnout, with scant evidence of a positive relationship. Academics have also developed three principal theories attempting to explain the effects of inequality on turnout: “relative power,” “conflict,” and “resource” theory. Therefore, this study formulates three separate hypotheses, one for each theory.
Relative Power Theory
Relative power theory predicts that income inequality has a negative effect on turnout and that the turnout of all income groups is expected to decline. This occurs due to inequality generating a greater concentration of wealth into the hands of high-income individuals, who then translate that increased wealth into more political power, as policy makers respond to their interests over the poor (Goodin & Dryzek, 1980). Consequently, low-income earners become disengaged from the political process as they “conclude that politics is simply not a game a worth playing” (Solt, 2008, p. 57). Eventually, the turnout of high-income individuals also declines (although not to the same extent), as less engagement is then required to maintain their dominant position in the political process (Steinbrecher & Seeber, 2011).
Solt (2008) finds evidence in support of relative power theory both cross-nationally and at the U.S. state level (Solt, 2010). He has produced the most pronounced results, whereby political participation is lower in countries with above average income inequality, particularly among those on low incomes. Similarly, Galbraith and Hale (2008) find that higher U.S. state-level income inequality leads to lower turnout in presidential elections in their study covering 1980-2004. Beyond the U.S. context, Steinbrecher and Seeber (2011) find in a round four European Social Survey sample of 27 countries, that income inequality lowers turnout at the individual level but also reduces the income gap in turnout.
Conflict Theory
In contrast to relative power theory, conflict theory predicts the opposite effect on turnout. It builds on Meltzer and Richard’s (1981) median voter model, by predicting that higher income inequality will lead to a more conflictive politics because increasing income inequality stimulates more engagement in the political process for all income groups. This occurs because low-income individuals will start to push for more redistribution, due to being made worse off from increased inequality. This in turn becomes costlier for the rich, who then become more politically engaged so that they can counter the adoption of redistributive policies (Stockemer & Parent, 2014).
Evidence for conflict theory is sparse, although Leighley and Nagler (2014) find some support in their case study of U.S. presidential elections from 1972 to 2008. They find that people who perceive greater policy differences are more likely to vote and that the poor are less likely to perceive policy differences than the wealthy. However, even though people largely underestimate the true extent of income inequality, often by substantial amounts (Hauser & Norton, 2017), polling indicates that the public is still very concerned about rising inequality in Canada. A 2014 EKOS Research poll found that 74% of Canadians believed “the middle class is shrinking and falling backward,” and a similar 2014 Pollara poll revealed that 85% “believe income inequality is no longer about the gap between the rich and the poor, but rather the very rich and everyone else” (Osberg 2018, pp. 43–44). Moreover, two thirds of Canadians feel that the gap between the rich and poor is widening (Adams, 2017) and an equal number believe the rich should be taxed more to support the poor (OECD, 2019). Despite heightened public concern about inequality it continues to rise in Canada, and governments have responded with less redistribution (Banting & Myles, 2013). Therefore, the second hypothesis tests whether turnout decline could be stemming from a lack of effective policy offerings on redistribution, as voters can only respond to the policy choices presented to them:
Power Resource Theory
Power resource theory posits that an individual’s participation in the political process depends on the amount of resources available to them (Verba et al., 1995). Greater income inequality typically results in less resources for lower class citizens and more for upper-class citizens. Thus, the greater the amount of income inequality in a society, the less politically active the poor become, as opposed to the wealthy, who increase their political engagement. More equal societies should also have a more equal system for provisioning services to all members of society and make it easier for the lower classes to participate in civic life (Lancee & Van de Werfhorst, 2012). It is possible that overall turnout can still rise with increased inequality because if all income groups are getting richer in absolute terms, then they will still have more resources available to participate in politics, despite the fact that the poorest are getting poorer in relative terms (Jaime-Castillo, 2009). However, the theory generally predicts that greater inequality is positively related for high-income earners and negatively related for low-income earners (Solt, 2008). This tends to lead to overall declining turnout, as well as greater turnout inequality.
Cross-national support for power resource theory can be found in multiple studies. C. J. Anderson and Beramendi (2008) find in a World Values Study from 1999 to 2001, that inequality suppresses turnout across national contexts because individuals living in more unequal countries are less likely to vote, with a consistent linear pattern for all income groups. Using data from the 2006 wave of the European Social Survey, Lancee and Van de Werfhorst (2012, p. 1176) demonstrate that “inequality seems to isolate low-income individuals from civic and social life,” while simultaneously promoting “the social integration of the rich.” Schäfer (2013) finds similar results in an expanded 1970-2008 study of 23 OECD countries, whereby predicted turnout is 18 percentage points lower when moving from the most to least equal country.
Canadian Contribution
In the Canadian context, income is known to exhibit a limited effect on voting (Alford, 1963; Johnston, 2017). Although income inequality and turnout are yet to be examined, the relationship between inequality and related political attitudes do, however, appear in two recent studies relying on the CES. Perrella et al. (2016) investigate the effect of a growing income gap on six political attitudes ranging from satisfaction with democracy, to external political efficacy from 1993 to 2011. They do not examine participation and they find that income disparities have little effect beyond reduced support for political institutions. However, they make a strong case that the CES produces conservative findings, because most of the attitudinal questions appear in the mail-back portion of the CES, whose respondents tend to be “older, more educated, and wealthier,” as well as “less cynical” (Perrella et al., 2016, p. 45). Similarly, Sealey and Andersen (2015) look at the relationship between inequality and redistribution from 1993 to 2008 and find that higher inequality leads to greater support for redistribution. Although baseline support is contingent on provincial context, as provincial political cultures moderate the relationship.
Furthermore, The Samara Centre for Democracy encapsulates aspects of all three hypotheses in a recent report on the views of the politically disengaged in Canada. Members of a low-income focus group that rarely votes, outlined “growing inequality” as one of the prime reasons for not participating politically (Hypothesis 1; The Samara Centre for Democracy, 2012). They also “viewed themselves as passive observers of politics—not by choice,” but because of a “lack of time or energy” owing to more pressing concerns in their lives (Hypothesis 3), as well as a pervasive feeling of powerlessness at being unable to influence an unresponsive political system (Hypothesis 2; Bastedo et al., 2011).
Altogether, it appears that there is not yet a conclusive answer to the effect of income inequality on turnout and the precise mechanisms warrant further exploration. Consequently, this study builds on the previous literature by incorporating a different mechanism—the redistributional policy offerings of political parties. As voters could be abstaining due to the lack of effective representation in the policy realm. Additionally, this article provides the first country-case study outside of the United States to explore the effect of income inequality on turnout, and covers the longest duration (31 years) within a single country yet.
Data and Methodology
Methodology
Analysis is undertaken via a uniquely created data set comprising individual-level and macro-level data. The individual-level data derive from the 10 most recent waves of the CES, which is merged with subnational level data from Statistics Canada, as well as national-level data from the Comparative Manifesto Project (CMP), and Elections Canada. The CES offers the most extensive surveys on public opinion and voting for Canadian elections and contains information on respondents from all 10 provinces for each federal election since 1965. The 10 federal elections included span over 30 years from 1984 to 2015, with each survey containing roughly 3,500 to 4,500 respondents, yielding a total analytical sample of 39,560.
The data set contains individuals nested within elections over time, therefore, multilevel models are applied to pooled cross-sectional data. As the dependent variable is dichotomous, logistic mixed-effects models are estimated, which include both fixed and random effects. Since the higher level units are too small to cluster by province or election (10 each) without introducing bias into the estimates, observations are clustered by province-year, providing 100 in total (Bryan & Jenkins, 2016). Thus, all models account for the clustering of individuals within the province-year electoral contexts through the specification of a random intercept and assume that the effect for all individual and contextual variables is fixed across each election.
Individual-Level Variables
The individual-level variables are all drawn from the CES. The dependent variable is turnout, which is a dichotomous measure of the straightforward question as to whether a respondent voted in the recent federal election.
A key independent variable utilized is income, which measures the total household income of each respondent, divided into five quintiles (lowest to highest). Quintiles were chosen because they have been the most commonly used form of measuring individual income in the literature, “since an individual’s ranking in the income distribution is more comparable over time than is the individual’s absolute income level” (Leighley & Nagler, 1992, p. 727). A prominent problem with surveys of household income is nonresponse, but within the CES response rates were nearly as high as most other sociodemographic variables, as respondents were normally provided the option of providing their total household income or identifying their placement within 10 categories (see Supplemental Information S1, available online). Nevertheless, a robustness check is still performed on the missing income values to ensure that the data set does not contain any bias (see Supplemental Information S5, available online).
The most relevant individual-level controls to turnout are included. Young people tend to vote in low numbers and the likelihood of voting increases substantially as one gets older until around age 55, when it then begins to level off (Blais, 2000). This curvilinear relationship has been found to be especially pronounced in Canada (Blais & Rubenson, 2013). Therefore, age and age-squared (age2) variables are included. Voting is also positively related to education, marriage, nativity, and religious and union status (Smets & van Ham, 2013). Therefore, religion, union, married, and native dummy variables are included, and education is added as a categorical variable. Gender is also controlled for via a female dummy variable. Last, a respondent’s political interest is included, to control for the notion that greater political interest predisposes one to vote. The variable is measured based on responses to the question: “how interested in politics are you generally?” via a 3-point (low to high) scale.
Socioeconomic Variables
Income inequality is measured at the provincial level. The adjusted after-tax Gini coefficient is employed rather than the market income Gini coefficient because the main mechanisms leading inequality to affect turnout are most likely to operate via a person’s disposable income after taxes and transfers, rather than their market income (Stockemer & Scruggs, 2012). Voters are typically backward looking with a memory of roughly 1 year when evaluating the performance of government and the impact of the economy (Lewis-Beck & Stegmaier, 2013). To account for this 1-year memory of retrospective voting, I lag the Gini indicator for 1 year. Gini’s are obtained from Statistics Canada’s (n.d.-b), Table 11–10-0134-01.
Furthermore, socioeconomic variables measured at the provincial level are added as controls. Union density has declined a full 10 percentage points from its peak of 41.8% in 1984 (Sran et al., 2014), which could also be negatively impacting turnout. Population size has been negatively associated with turnout, as smaller populations increase the likelihood that people know the candidates in their region (Cancela & Geys, 2016). Population differs markedly among Canada’s provinces, ranging from 146,000 (Prince Edward Island) to 13.8 million (Ontario). Thus, a logged measure of provincial population is added. To rule out spurious correlation, average logged income per capita, measured at current CAD dollars, is added, and lagged 1 year. In addition, the average advanced degree attainment for each province is added. Data for all four variables derive from Statistics Canada. Last, average level of church attendance is calculated from the General Social Survey (Statistics Canada, n.d.-a). As each survey includes a very sizable sample of respondents providing how often they attend religious services, on a 5-point (low to high) scale.
Political Variables
A key aggregate-level independent variable examines the policy space of the political parties in Canada. Following previous research, party issue positions are estimated utilizing party manifesto data, drawn from the CMP (Ezrow & Xenokasis, 2011). 3 The CMP is a popular data set for the study of political parties and offers reliable estimates that correlate highly with national experts and mass surveys, including 104 Canadian party experts surveyed by Benoit and Laver (2006; see also Cochrane, 2010). The policy statements are classified into 56 policy categories over seven domains and this study focuses on the items that relate most closely to matters of redistribution. The left–right redistributional scores of the various parties have been calculated by summing up the percentages of all the sentences in the left category and subtracting their total from the sum of the percentages of the sentences in the right category (Laver et al., 2003). 4 In order to examine the extent of redistribution offered by the parties for each election, a left–right party position variable is constructed (rescaled 1-10 from left–right). 5 The variable is calculated based on the mean weighted by party vote share position on redistribution for each election. 6
I also control for national-level political factors that may influence turnout in Canada. Uncompetitive elections tend to reduce incentives to vote, which has been particularly acute in Canada, and has been partially attributed with the sudden decline in turnout in the 1990s (Johnston et al., 2007). Thus, party competition for each federal election is measured, which is the difference in total votes between the first- and second-place parties. The effective number of parties (ENP) is also controlled for, and across most studies is negatively associated with turnout (Cancela & Geys, 2016), even though theory might predict a positive association (Blais, 2006). 7 Data for both variables derive from the CMP. The incumbent government is controlled for, which can influence who turns out to vote (Iversen & Soskice, 2006). As only two parties (Liberals and Conservatives) have formed the government in Canada, incumbent party is measured via a dummy variable (0 = “Conservative”; 1 = “Liberal”). Henderson and McEwen (2010, 2015) have shown that distinctive regional identities (including Québécois) can lead to greater turnout for those regions in subnational elections, when cultivated via regional parties. To test this at the federal level, a regional party dummy variable is included and coded as 1 for any province-year election, whereby a regional party achieved over 20% vote share in a province, and multiple seats in parliament (Henderson & McEwen, 2010). 8 Last, greater election frequency has been negatively related to turnout, especially in federal systems (Studlar, 2001). Thus, the time in months since the last election (provincial or federal) for each province-year election is calculated. These three variables derive from Elections Canada.
Results
Descriptive Analysis
First, the trends in turnout are investigated. The turnout rate is 87.6%, which is substantially larger than the actual turnout rates by a comparatively large (country-wise) 21.7 percentage points. Likelihood to vote increases with each income quintile and the richest quintile votes around 11.2 percentage points more than the bottom quintile in the sample. However, more than half of this increase occurs between the first and second quintiles. To further investigate the income gap in turnout, a ratio calculation of the turnout rate among the top quintile, versus the bottom quintile is performed. The mean ratio is 1.15, meaning that the top quintile voted 1.15 times more than the bottom quintile.
The turnout rate also incurs little provincial variation, as nine of the provinces reside within 4 percentage points of the average turnout rate—with Newfoundland the expected outlier at 80%. Despite the very small variance in turnout, we do see a weak correlation between provincial levels of turnout and income inequality. Figure 2 displays the cross-provincial average turnout plotted by average Gini index. As expected, there is a negative correlation, as provinces with higher turnout tend to have lower levels of inequality. We can see that turnout is nearly 3 percentage points lower in provinces with the highest income inequality, in comparison with provinces with the least, which is in line with relative power theory.
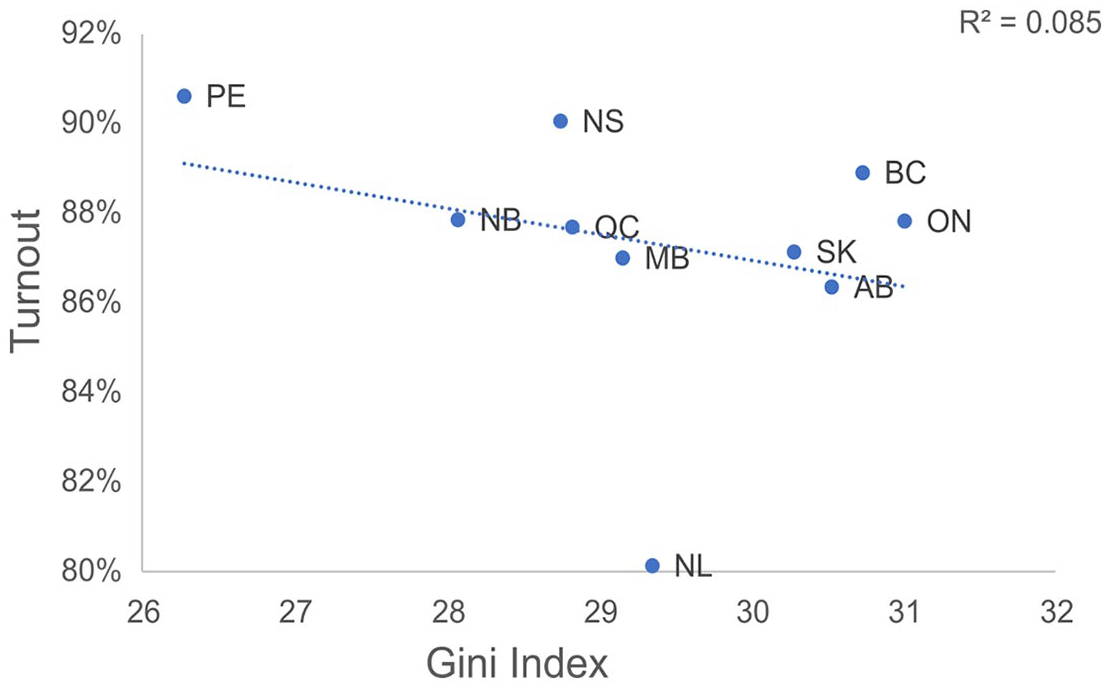
Provincial Turnout by Gini Index.
When the time trends are determined, turnout increases in the sample, which is at odds with the general increase in income inequality, and the income gap in turnout also decreases slightly.
Estimation Results
To test the main hypotheses, I specify a mixed-effects logistic regression. Table 1 presents the results from three different models. Model 1 provides a baseline estimate and includes each of the individual and contextual variables. The individual-level variables largely perform as expected and are all significant. Those on high incomes are significantly (p < .001) more likely to vote than those on low incomes (b = .163).
Mixed-Effects Logistic Regression Predicting Propensity to Vote.
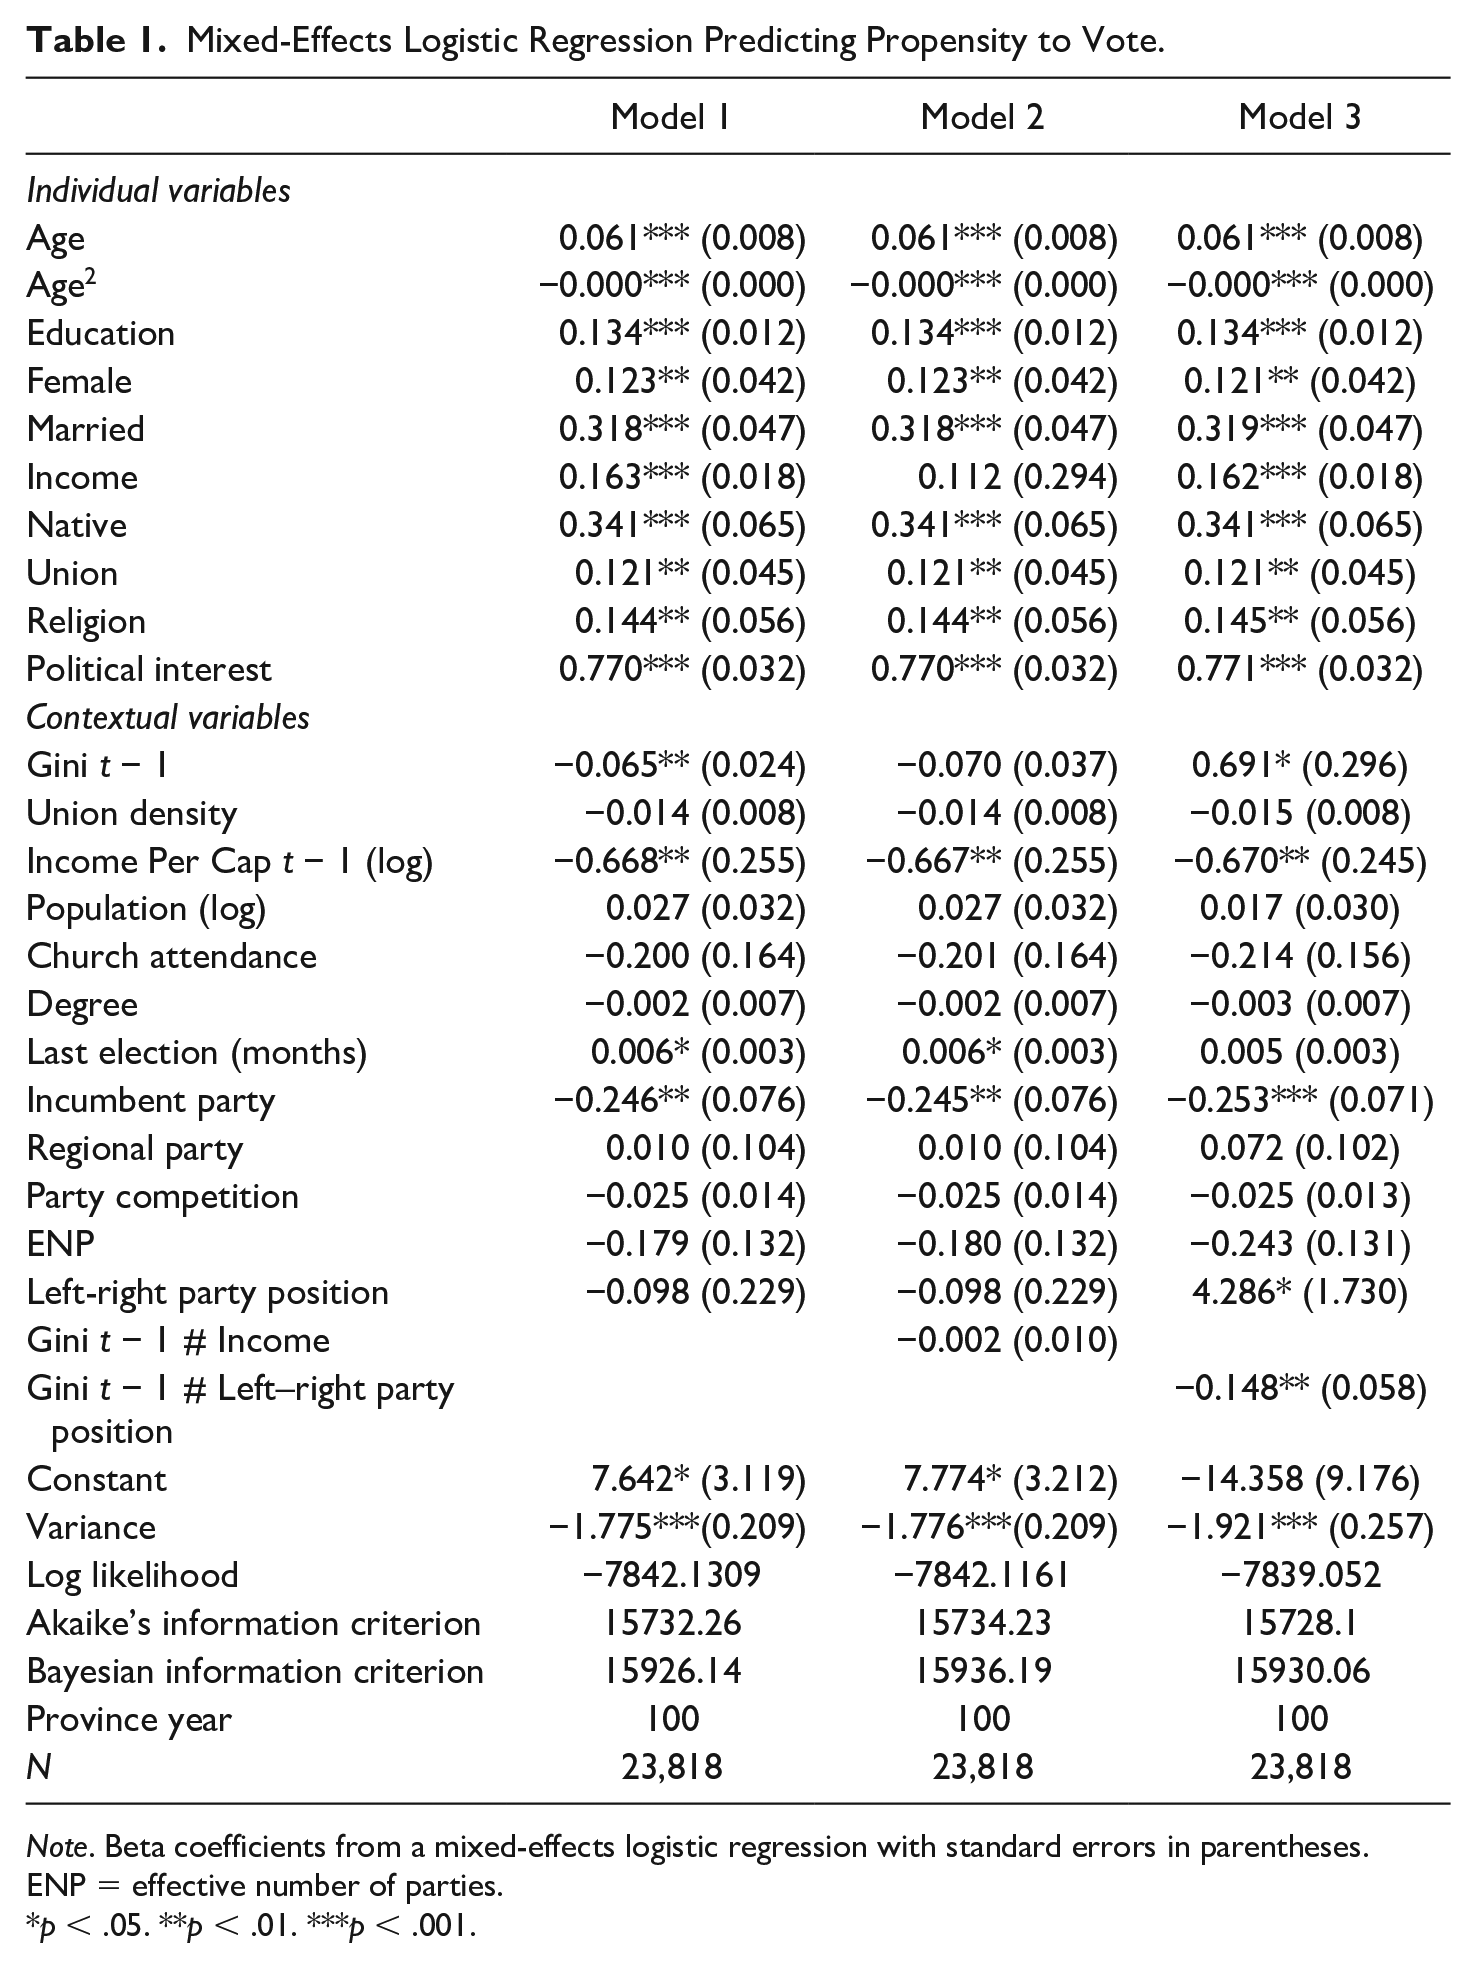
Note. Beta coefficients from a mixed-effects logistic regression with standard errors in parentheses. ENP = effective number of parties.
p < .05. **p < .01. ***p < .001.
Most of the contextual controls are not significant. When the Liberals are in power people are significantly less likely to vote, which could in part be owing to the Liberals centrism and role as Canada’s natural governing party. As Johnston (2017) has shown, turnout is negatively related to Liberal vote share, who tend to benefit from times with high indifference, and stand to lose vote share in times of insurgency when turnout increases. When provincial average income is higher, people are also significantly less likely to vote. People are more likely to vote when elections are less frequent and when there are less parties, which likely is owing to the much higher turnout in the 1980s, when there were only three parties. Some evidence appears that people are more likely to vote when political parties offer more redistribution, although left–right party position is not significant.
Most important, Model 1 indicates that inequality does significantly depress turnout at (p < .01). Figure 3 below displays the predicted probabilities of turnout at different levels of income inequality. We can see that the likelihood to vote is substantially lower at higher levels of inequality. At the lowest levels of inequality, people are much more likely to vote (roughly 90%), but at the highest level of inequality, significantly less so (roughly 85%). Thus, support is found for relative power theory and Hypothesis 1.
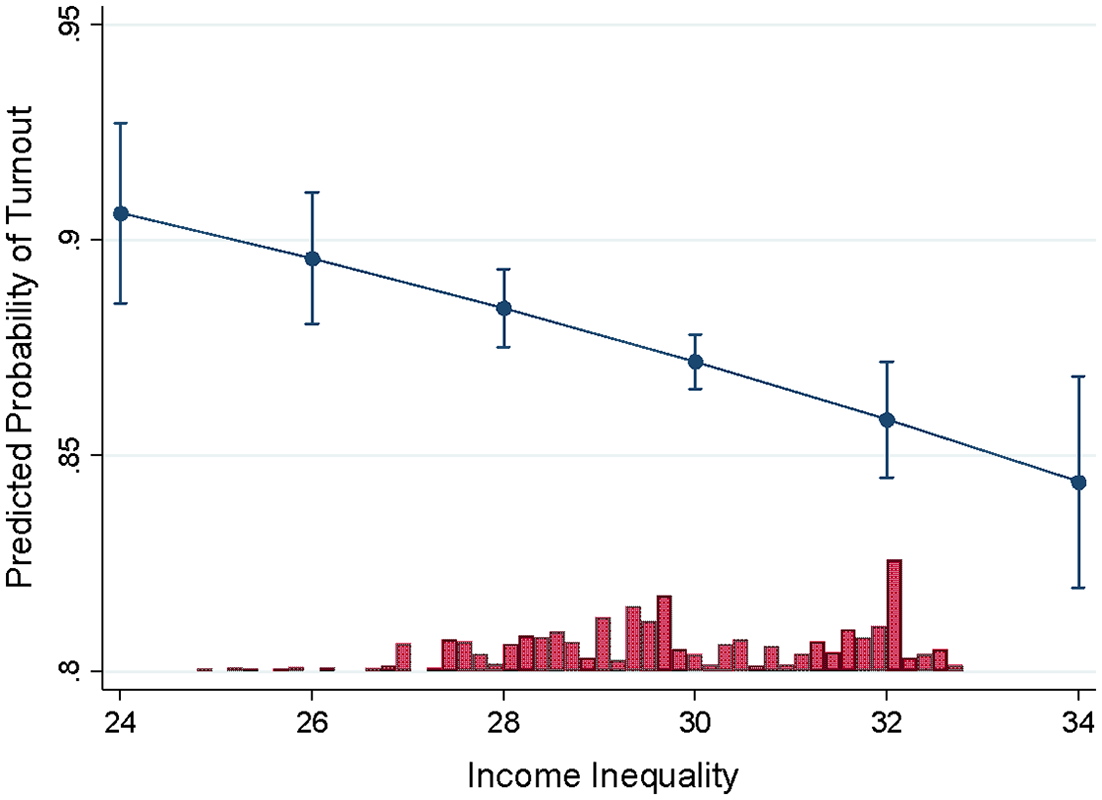
Predicted probability of turnout by income inequality with 95% confidence interval (Model 1).
Model 1 reveals a sizeable income gap in turnout that is often larger in countries with lower turnout such as Canada. Mahler (2008) reports that the income gap in turnout for the 1997 federal election was 17.6 percentage points in the Comparative Study of Electoral Systems, which is 6.4 percentage points larger than in the CES. Turnout is also 8 percentage points larger in the CES, which provides much less scope for a large turnout income gap. It is likely then that the CES considerably underestimates turnout inequality.
To test for power resource theory (Hypothesis 3)—that the income gap in turnout is greater when inequality is higher—Model 2 specifies an interaction between Gini t − 1 and income. The interaction is not significant, and we do not see much evidence that provincial inequality differentially affects income groups. The lack of a significant effect could be owing in part to survey underestimation of turnout inequality or perhaps to the comparatively persistent absence of class voting in Canada (Alford, 1963; Andersen 2013; Johnston, 2017).
Model 3 tests the second hypothesis—that greater policy redistribution increases overall turnout during periods of high inequality—via an interaction between Gini t − 1 and left–right party position. The interaction is negative and significant at (p < .01). Figure 4 below displays the average marginal effects of inequality by the redistributional party system position (left–right) on turnout. It shows that the effect of inequality is slightly above zero when the party system is very left-wing on redistribution, but that turnout gradually dampens the more right-wing the system becomes. When party systems move from the most leftward to the most rightward position, a 1 standard deviation increase in inequality exhibits roughly a 1.7 percentage point decrease in turnout. The interaction provides some support for Hypothesis 2. As the negative effects of inequality on turnout are exacerbated when parties offer less redistribution and are mitigated when the party system offers greater redistribution.
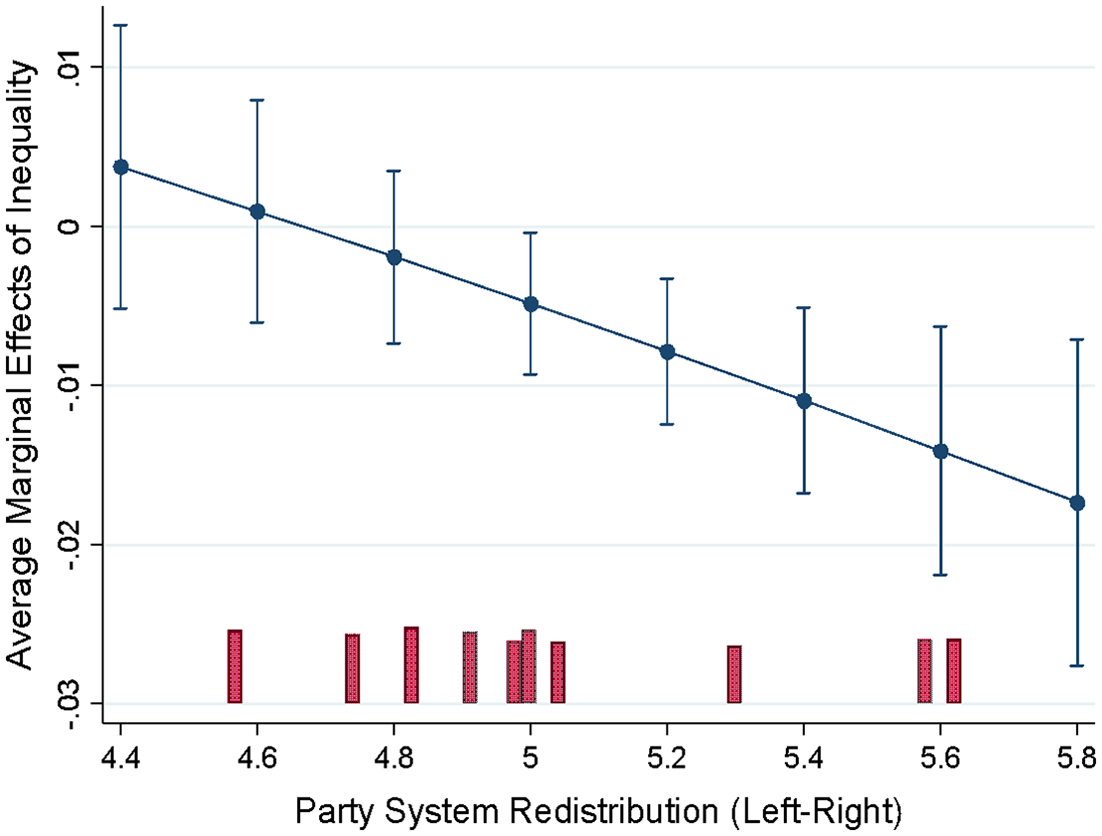
Average marginal effects of inequality by party system redistribution on turnout with 95% confidence interval (Model 3).
When we investigate the interaction further by breaking Model 3 down by income groups, we can see more precisely how conflict theory is dependent on the offer of greater redistribution. Table 2 presents the results from the interaction for the bottom two quintiles versus the rest of the population. We can see that the interaction is only significant for the bottom two quintiles (p < .01) and that the negative effect is nearly twice as strong for the bottom two quintiles.
Mixed-Effects Logistic Regression Predicting Propensity to Vote for Bottom Two Versus Top Three Income Quintiles.
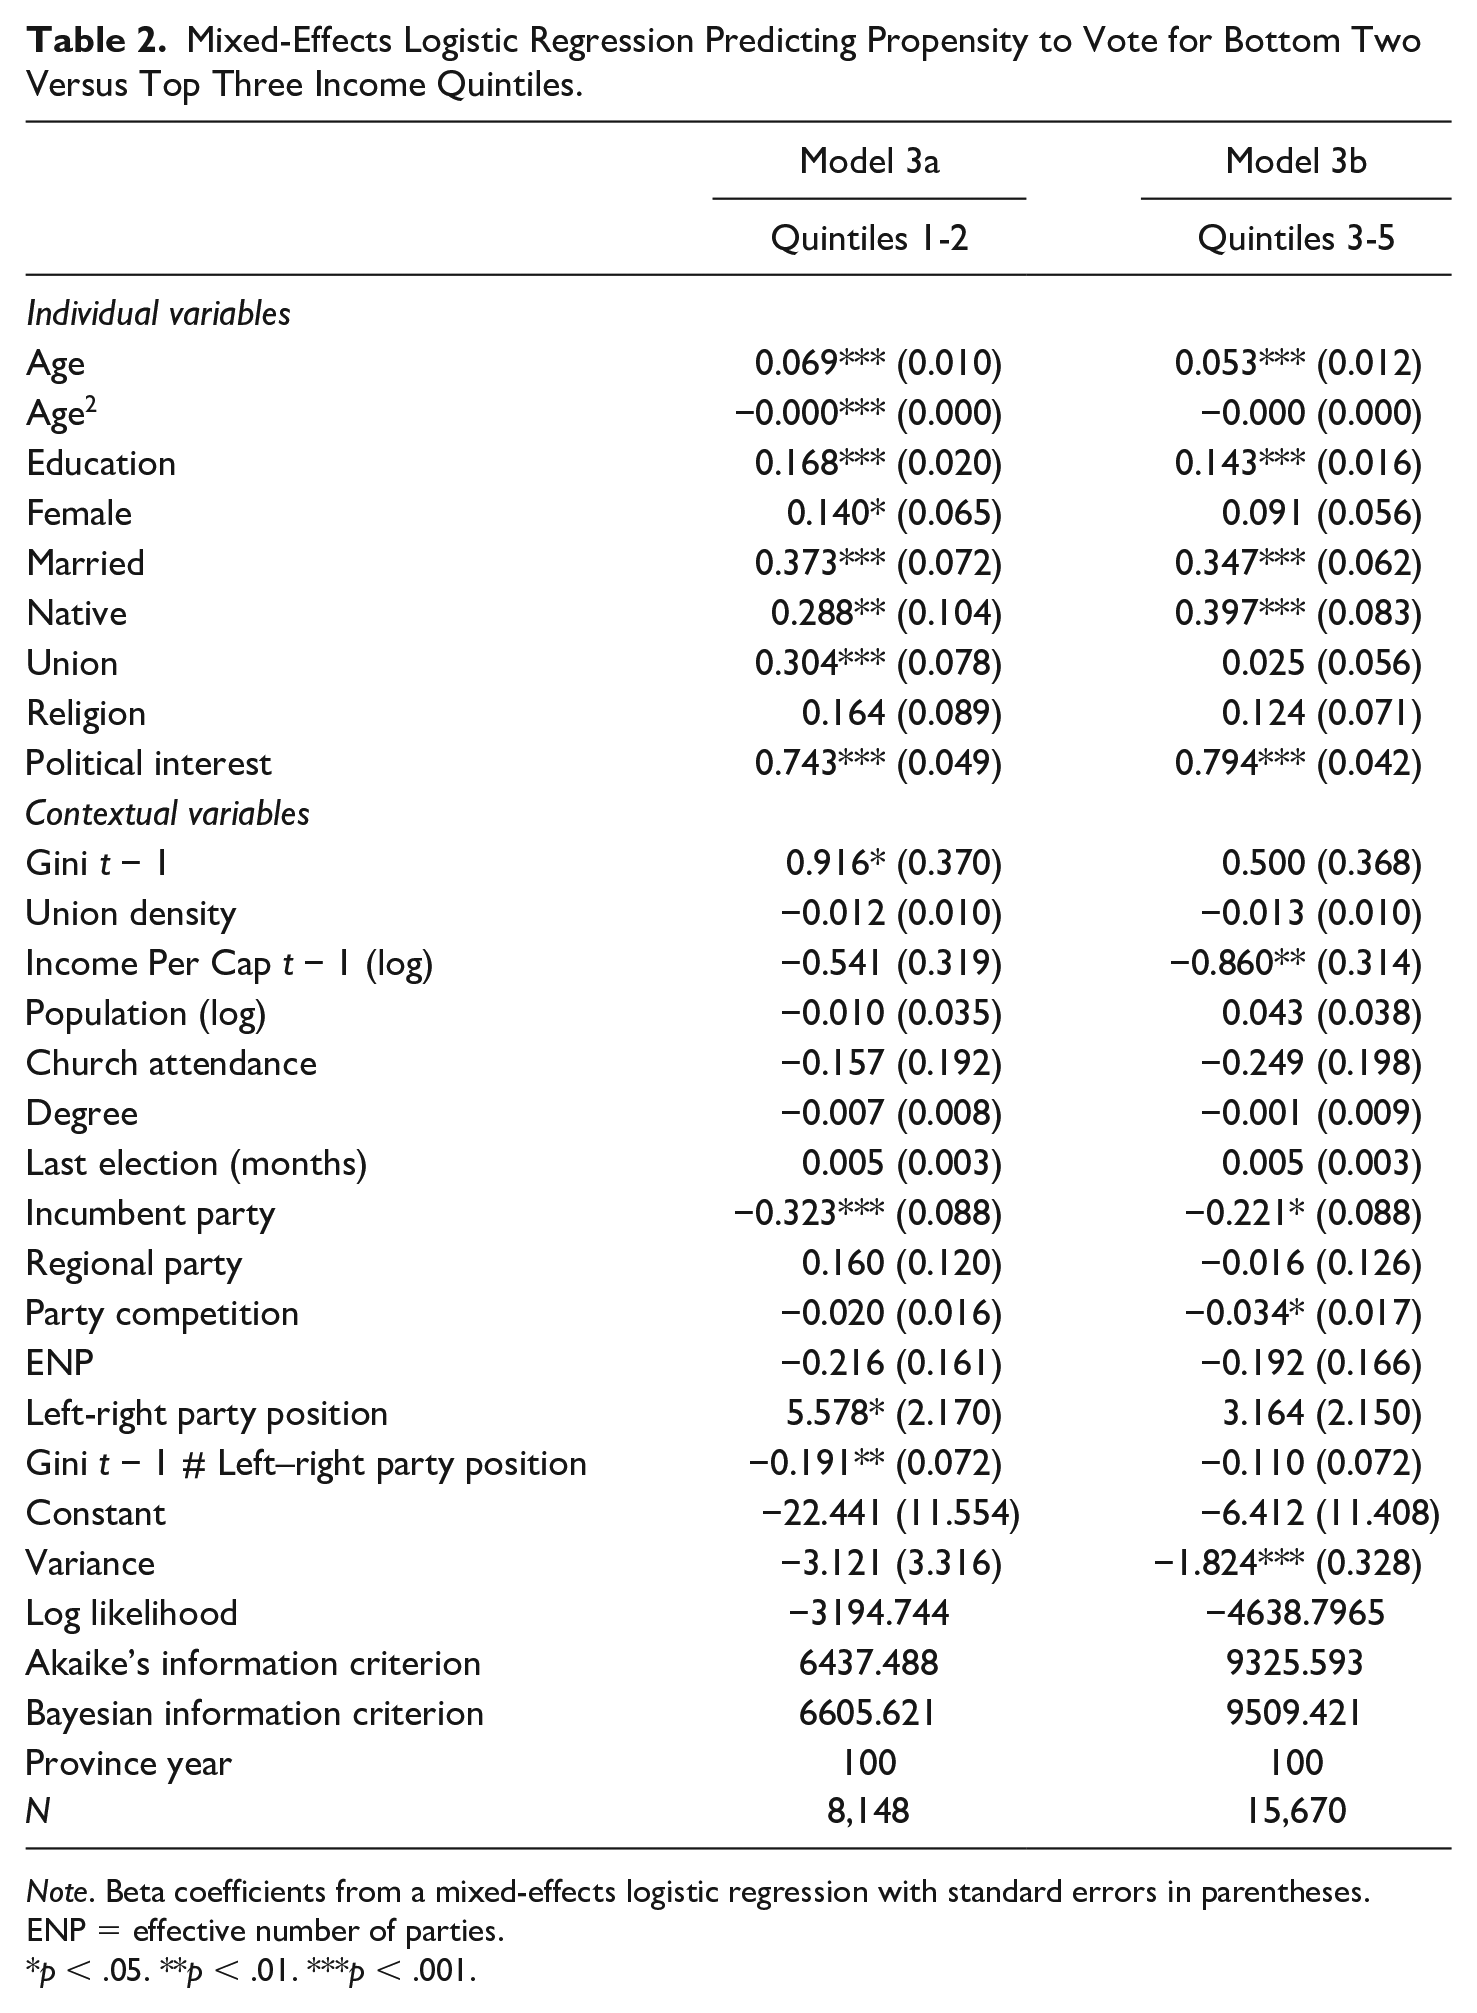
Note. Beta coefficients from a mixed-effects logistic regression with standard errors in parentheses. ENP = effective number of parties.
p < .05. **p < .01. ***p < .001.
Figure 5 below offers a comparison of the average marginal effects of inequality by the redistributional party system position on turnout, for the bottom two quintiles (left), and quintiles 3 to 5 (right). We can see that at the most leftward position on redistribution, the effect of inequality on turnout is around zero for the richest three quintiles, whereas for the bottom two quintiles, greater inequality increases turnout. Reduced offers of redistribution then gradually reduce turnout for all income groups, although to a much larger extent for the bottom two quintiles. This suggests that people on low incomes are affected to a greater extent by party system redistribution and that leftward positions of redistribution can increase turnout for this group under higher inequality, despite the negative effects of inequality on turnout.
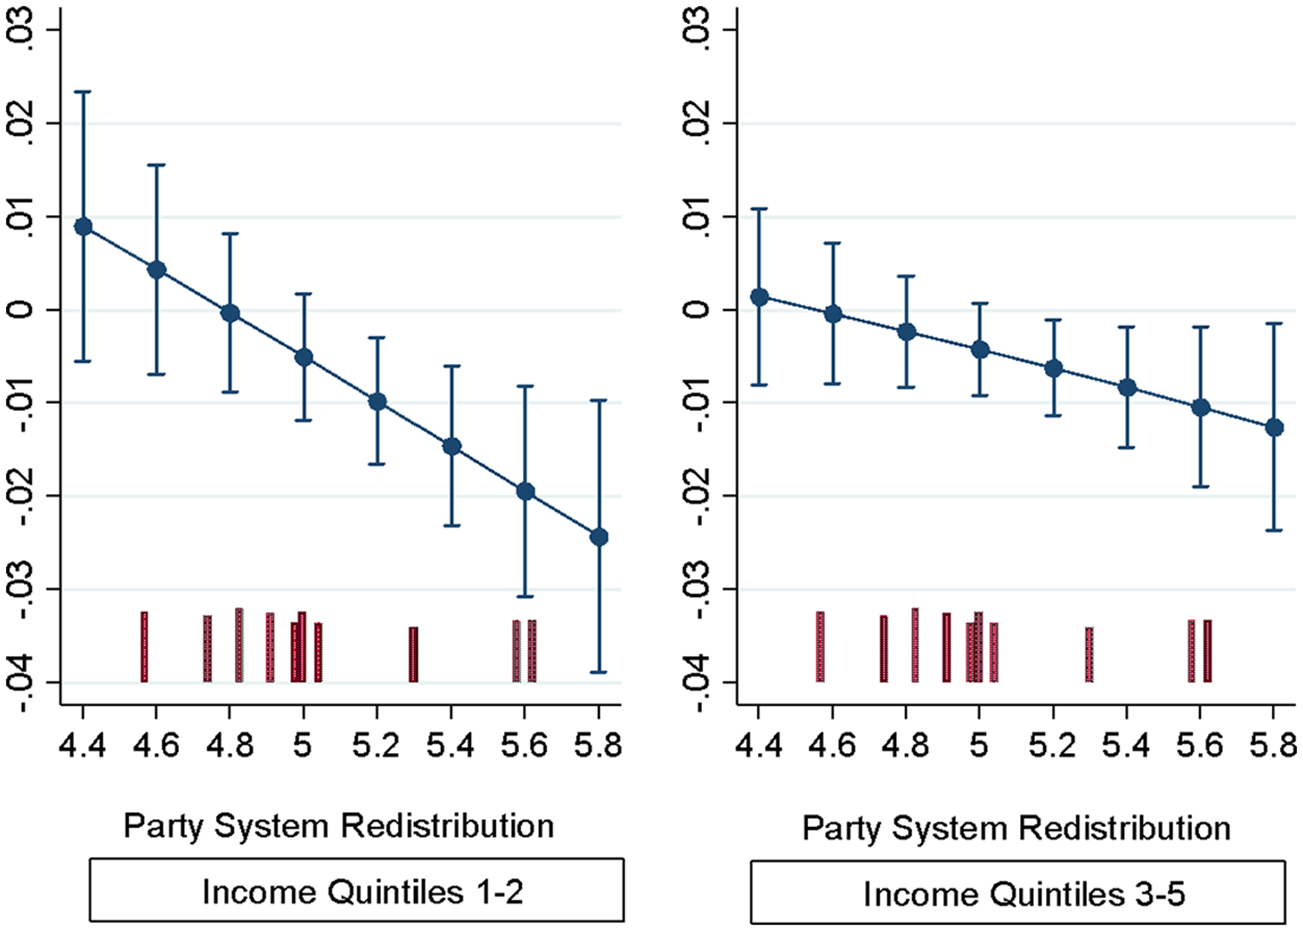
Average marginal effects of inequality by party system redistribution on turnout for income Quintiles 1 to 2 (left) and 3 to 5 (right) with 95% confidence interval (Models 3a and 3b).
Conclusion
This study provides a novel theoretical case study on the effects of income inequality on turnout. It makes use of two uniquely intensive developments in time that occur within a specific geography. As the marked increase in income inequality in Canada during the 1990s, forms a noteworthy comparison with the precipitous concurrent decline in voter turnout that befell the country. The study also seeks to address multiple gaps in the literature. Previous research has been focused cross-nationally or on the United States, so a case study of Canada expands our knowledge of this key topic beyond the usual regional scope. It also introduces a previously unexplored mechanism moderating the relationship between inequality and turnout—the policy choice offerings of political parties at the time of elections.
Past research has tended to offer support for either relative power or resource theory. This study offers evidence in support of the former, as it finds that income inequality does significantly reduce turnout in Canada, with low-income earners negatively affected the most. Past research has also offered little support in favor of conflict theory. However, by examining the economic policy space of Canada’s party system, we can provide a more direct test of conflict theory. The results here indicate that latent conflict (Meltzer & Richard, 1981) only manifests from increasing income inequality—when parties offer greater redistribution. As this article shows that the negative effects of inequality on turnout can be mitigated with party system movements to the left on matters of redistribution, which is especially pronounced for low-income earners. This finding is particularly relevant to current policy debates, since turnout decline in Canada coincided with a strong rightwards policy shift on redistribution (Banting & Myles, 2013; Johnston, 2017). Turnout also substantially increased in the 2015 election to the highest level since 1993, with inequality a salient issue during the campaign, and the Liberal’s moving to the left of the New Democratic Party on redistribution for the first time since the CMP began coding elections in 1945.
However, further research is required, and the limitations of this study provide direction. Prime among them is the extent of endogeneity in this situation, as politics affects inequality and inequality affects politics. Another limitation involves case confinement. There are only 10 provinces in Canada, which provide a far lower number of aggregate-level units for measurement than is available cross-nationally or within larger federations such as the United States. Similarly, this study contains only 10 federal elections, which points to the lack of survey availability at the provincial level.
Nevertheless, this article sheds further light on the detrimental effects of inequality on democracy. A primary function of elections is the distribution of power and mounting American evidence demonstrates their governments are far more responsive to the wealthy over everyone else (Bartels, 2008; Bowman, 2020; Gilens, 2012; Hacker & Pierson, 2010). It would appear from this study that Canada is treading down a similar path to its southern neighbor. Although the influence of money is not as prevalent in Canadian democracy as in the United States, it is still hindered by the narrow boundaries of what is considered acceptable public debate and a sometimes “distorted presentation of economic and social realities” (Broadbent Institute, 2012, p. 5). Therefore, when there is little chance of electing a representative that will champion their interests, individuals are often behaving rationally by refraining from voting (Solt, 2010).
This article also has important policy ramifications. The self-reinforcing nature of political and economic inequality means that policy makers need to address both sides of the equation. On the political side, an important reform lies with Canada finally redressing the inequities inherent in its electoral system with a move toward proportional representation (PR). Reforming Canada’s majoritarian electoral system was a central plank to the Liberals’ 2015 winning campaign, with Prime Minister Trudeau promising an end to the first-past-the-post system by the subsequent election, but the pledge was expediently suppressed once in power. PR systems provide better representation for low-income earners by facilitating alliances between working-class and middle-class voters on redistribution (Iversen & Soskice, 2006) and turnout is higher in PR systems (Cancela & Geys, 2016; Gidengil et al., 2004).
This study has contributed to a growing body of literature examining the political side of inequality. It has yielded important insights into income inequality and turnout in Canada, with implications outside the country. As it identifies income inequality as another significant culprit in turnout decline and consequently provides further impetus to policy makers to adopt reforms and policies that aid in combating income inequality.
Supplemental Material
Supplemental_Information – Supplemental material for Party Positions, Income Inequality, and Voter Turnout in Canada, 1984-2015
Supplemental material, Supplemental_Information for Party Positions, Income Inequality, and Voter Turnout in Canada, 1984-2015 by Matthew Polacko in American Behavioral Scientist
Footnotes
Acknowledgements
I would like to thank Damien Bol and Oliver Heath for very valuable advice and comments as well as three anonymous reviewers who helped substantially improve the article. Versions of this article have also benefited from the advice and comments of André Blais, Joshua Dubrow, Simon Kiss, Benjamin Lobo, Matias López, and Robert Speel. Versions of the article were presented at the 2017 Canadian Political Science Association annual conference and the 2019 Canada Research Chair in Electoral Democracy weekly seminar at the Université de Montréal.
Declaration of Conflicting Interests
The author declared no potential conflicts of interest with respect to the research, authorship, and/or publication of this article.
Funding
The author received no financial support for the research, authorship, and/or publication of this article.
Supplemental Material
Supplemental material for this article is available online.
Notes
Author Biography
References
Supplementary Material
Please find the following supplemental material available below.
For Open Access articles published under a Creative Commons License, all supplemental material carries the same license as the article it is associated with.
For non-Open Access articles published, all supplemental material carries a non-exclusive license, and permission requests for re-use of supplemental material or any part of supplemental material shall be sent directly to the copyright owner as specified in the copyright notice associated with the article.