
Abstract
Prior to the passage of the Affordable Care Act (ACA), part-time workers were much less likely than full-time workers to have health insurance. The ACA included multiple provisions intended to raise health insurance coverage rates, including a mandate that employers provide affordable coverage to full-time workers, a requirement that dependents be allowed to remain on their parents’ plan until age 26, extensions of Medicaid coverage, and the establishment of health insurance exchanges on which lower-income households could purchase subsidized coverage. Implementation of these provisions was associated with a decline in the full-time/part-time coverage gap from 6.5 percentage points in 2013 to 3.1 percentage points in 2021. Increases in Medicaid coverage and insurance purchased on the exchanges were the largest contributors to the reduction in the full-time/part-time coverage gap.
Keywords
Part-time jobs are often regarded as “lousy jobs.” Part-time workers earn less per hour than full-time workers (Bardasi and Gornick 2008; Blank 1990; Manning and Petrongolo 2008) and, even when they are on a company’s payroll rather than self-employed, are much less likely to have access to employer-provided benefits—most important among them, health insurance (Blank 1990; Farber and Levy 2000; Kalleberg, Reskin, and Hudson 2000). These differences are reduced, but not eliminated, by controlling for characteristics such as a worker’s age, education, race, sex, and marital status. Part-time workers also typically have fewer opportunities for career advancement (Connolly and Gregory 2008; Hoque and Kirkpatrick 2003; Tilly 1996). For some people, such as those who have another earner in the household or who are combining work with school, the flexibility afforded by part-time work may make it attractive, but this is less likely to be the case among people who rely on part-time work to make a living.
It is not entirely surprising that employers typically do not offer health insurance to part-time workers. Unlike other employer-provided benefits, such as 401(k) plans, where the employer contribution is based most often on how much the employee earns, health insurance is essentially a capitated benefit with a fixed per-person cost. 1 Part-time workers are more likely than full-time workers to have health insurance coverage as a dependent on someone else’s employment-related plan, to have coverage that is provided by Medicaid, or to purchase coverage through a private plan. The overall coverage rate for part-time workers nonetheless historically has been significantly below that of full-time workers. We estimate that, in 2013, 22.7 percent of part-time workers had no health insurance, compared to 16.2 percent of full-time workers, a gap of 6.5 percentage points. 2
The gap in health insurance coverage rates between full-time and part-time employees has closed significantly since the provisions of the Affordable Care Act (ACA) of 2010 began to be implemented. In this article, we use information on coverage by type to explore how each of the various ACA provisions related to health insurance coverage may have affected the full-time/part-time coverage gap. These provisions include the act’s mandate that large employers offer health insurance to full-time workers (implemented beginning in 2015), expansion of dependent coverage for young adults (effective in 2010), Medicaid expansion (begun in 2014), and the establishment of exchanges through which many lower-income households are now able to purchase private health insurance policies at a subsidized price (introduced in 2014).
Changes in Medicaid coverage since the ACA’s passage have played the largest role in closing the full-time/part-time coverage gap. We estimate that the share of full-time workers covered by Medicaid grew by 2.2 percentage points between 2013 and 2021, while the share of part-time workers with Medicaid coverage grew by 6.9 percentage points. On their own, these changes would have closed the full-time/part-time coverage gap by 4.7 percentage points. In addition, we estimate that insurance purchased through the ACA exchanges raised coverage rates by 3.7 percentage points for full-time workers but double that amount for part-time workers, thus closing the full-time/part-time gap by another 3.6 percentage points. According to our estimates, gains in own-employer coverage for full-time workers and declines in dependent coverage and in directly purchased non-exchange coverage among part-timers worked in the opposite direction, partially offsetting the relative gains for part-time workers associated with the Medicaid expansion and health exchanges. Still, as overall coverage rates rose following the passage of the ACA, the gap in coverage rates between full-time and part-time workers declined significantly, falling from 6.5 percentage points in 2013 to 3.1 percentage points in 2021.
Health Insurance Coverage Provisions of the Affordable Care Act
One of the ACA’s most important provisions is the employer mandate, which requires larger employers to offer affordable coverage to all full-time workers, defined as those working 30 or more hours per week. Although originally scheduled to take effect in January 2014, implementation was delayed until January 2015 for firms with 100 or more full-time equivalent employees (FTEs) and January 2016 for firms with 50 to 99 FTEs (Whittaker 2016). Because the employer mandate applies only to full-time workers, we would expect that, on its own, it might, if anything, have widened rather than shrunk the full-time/part-time coverage gap.
Perhaps the ACA’s most popular provision is the requirement that, if a health insurance plan includes dependent coverage, children must be permitted to remain on a parent’s plan until their 26th birthday, irrespective of their marital status, student status, or place of residence. Although some state laws enacted prior to 2010 had broadened the availability of dependent coverage, they generally were less encompassing than the ACA dependent coverage provision (Cantor et al. 2012). The ACA provision applied to plans renewing on September 24, 2010, or later, but many large insurance companies agreed to expand dependent coverage under their plans in the spring of 2010 (Obama White House Archives, n.d.). Plans with no significant changes in their coverage provisions after March 23, 2010, were not initially required to cover young adults who had the option to enroll in another employer-provided plan, but that exception was eliminated as of January 2014 (Employee Benefits Security Administration, n.d.).
Young adults ages 19–25 account for a disproportionate share of the part-time workforce; in March 2010, for example, people ages 19–25 represented just 13.6 percent of all workers ages 19–63, but 28.2 percent of those who said that they usually worked fewer than 30 hours per week at their main job. Since so many part-time workers are in the eligible age range, the dependent coverage provision could have had a material effect on the overall part-time dependent coverage rate and worked to close the overall full-time/part-time coverage gap. On the other hand, even prior to the ACA, full-time students generally could remain on a parent’s policy up to age 23. Young part-time workers are much more likely to be full-time students than young full-time workers are. As of March 2010, for example, 55.9 percent of workers ages 19–25 with usual hours below 30 per week were full-time students, compared to just 10.3 percent of those with usual hours of 30 or more per week. To the extent that young part-timers were already more likely than young full-timers to be covered under a parent’s plan, the ACA’s dependent coverage mandate could have raised coverage less for young part-timers than for young full-timers. Its net effects on the full-time/part-time coverage gap are thus a priori uncertain. 3
Another important provision of the ACA was the requirement that, effective January 2014, states expand Medicaid eligibility to individuals with household incomes up to 138 percent of the federal poverty line. Prior to the ACA, Medicaid offered limited coverage for low-income adults. As of 2013, only eight states and the District of Columbia provided full Medicaid coverage to low-income adults without dependent children; and even among low-income parents, coverage often was limited to those in households with incomes far below the poverty line (Heberlein et al. 2013). The planned ACA changes in Medicaid eligibility represented a significant expansion. The Supreme Court’s decision in National Federation of Independent Business v. Sebelius (2012) made Medicaid expansion optional for states; but in 2014, 26 states and the District of Columbia chose to proceed with the expansion, and another 14 states have done so subsequently (KFF 2024). 4 As part-time workers generally have lower earnings, we would expect them to have benefited disproportionately from the Medicaid expansion, thus reducing the full-time/part-time coverage gap.
Marketplaces established under the ACA on which individuals could buy health insurance coverage, commonly referred to as exchanges, were introduced in January 2014. Under the ACA, insurers offering plans through the exchanges cannot deny coverage, impose waiting periods, or raise premiums based on preexisting conditions. By one estimate, 27 percent of American adults under age 65 have preexisting conditions that might have created a barrier to coverage using the underwriting rules previously in place (Claxton et al. 2016). Under the ACA, purchases of coverage through the exchanges are subsidized for households with incomes between 100 percent and 400 percent of the federal poverty line. 5 We would expect that, by removing barriers to access and, perhaps more important, reducing the cost of health insurance for lower-income households, the introduction of the health insurance exchanges would have increased coverage disproportionately among part-time workers and reduced the full-time/part-time coverage gap.
The ACA also included a mandate that required individuals to have health insurance coverage and specified penalties for noncompliance. These penalties were phased in over several years, starting with $285 per family, or 1 percent of income above the federal income tax filing threshold in 2014; rising to $975 per family, or 2 percent of income above the filing threshold in 2015; and then to $2,085 per family or 2.5 percent of income above the filing threshold in 2016. The penalties were waived, however, for people with family incomes below the federal income tax filing threshold, for people in non-Medicaid-expansion states with family incomes below 139 percent of the federal poverty line, and for people for whom the cost of the cheapest available Bronze plan would have been too high a percentage of their income. Moreover, the Tax Cuts and Jobs Act of 2017 eliminated the penalties for noncompliance with the individual mandate, effective January 2019 (Eibner and Nowak 2018). Given the exemptions for people in lower-income households and the eventual elimination of the penalties, it is unclear whether or how the individual mandate would have affected the full-time/part-time coverage gap.
Data and Sample
Our analysis uses data from the 2001 through 2022 Current Population Survey Annual Social and Economic Supplement (CPS ASEC) downloaded from the IPUMS-CPS database (Flood et al. 2023). Because the supplement asks about work experience and health insurance coverage during the previous calendar year, our information is for calendar years 2000 through 2021. To exclude young people who we know would have been eligible to remain on a parent’s health insurance plan even prior to the ACA and older people who are eligible for Medicare, we limit our sample to individuals who were ages 20–64 years at the time of the survey. The sample is further limited to individuals who worked during the previous calendar year. Aligning our definition with the ACA definition, we classify workers whose usual hours on their longest prior year job were less than 30 hours per week as part-time and workers whose usual hours on their longest prior year job were 30 hours or more as full-time.
Although similar in many respects, the demographic characteristics of full-time and part-time workers differ in some notable ways. To illustrate, Table 1 reports descriptive statistics for the two groups of workers for calendar year 2013. Workers who were usually part-time during the calendar year are much more likely to be young than are those who were usually full-time; a third of part-timers were in the 19–25-year-old age group versus just 13.3 percent of full-timers. Part-timers are also much more likely than full-timers to be female (68.6 percent versus 44.3 percent) and less likely to have a four-year college degree or more (27.4 percent versus 36.3 percent). In the analysis that follows, we present information on the differences in health insurance coverage between the two groups both adjusted and unadjusted for the differences in their demographic characteristics.
Descriptive Statistics, Full-Time and Part-Time Workers, 2013

SOURCE: Authors’ calculations using 2014 CPS ASEC data.
NOTE: Sample includes adults ages 20–64 at time of survey interview. Full-time and part-time status based on usual hours on longest job during prior calendar year; full-time is 30 or more hours per week.
The questions about health insurance coverage on the CPS ASEC ask whether the person had each of eight different types of coverage at any point during the prior calendar year: (1) employment-related coverage through the person’s own job, which we will sometimes refer to as own-employer coverage; 6 (2) coverage as a dependent on another household member’s employment-related plan; (3) coverage under Medicaid; (4) starting in 2014, coverage under a policy purchased on a health insurance exchange; (5) other directly purchased private coverage; (6) military or Veterans Administration coverage; (7) coverage under Medicare; or (8) Indian Health Service coverage. 7 Some people report coverage from more than one source; to produce a set of mutually exclusive coverage categories, we assign these people to the first observed source of coverage in order of priority as listed above. For example, a person who reported both own-employer coverage and coverage as a dependent on another household member’s employer plan would be assigned to the own-employer coverage group. Data on exchange coverage is first available on the standard public use CPS ASEC files for calendar year 2018; in some of our figures, we display modeled estimates produced by the Employee Benefits Security Administration (EBSA) for the years from 2014 to 2017, but these are clearly less reliable than the estimates for 2018 and later years, which are based directly on the survey data.
An implicit assumption underlying our analysis is that, when people said they had a given type of coverage at some point during the prior calendar year, their answer reflected coverage held during the time when they were working at their longest job. Unfortunately, the standard CPS ASEC data released by the Census Bureau do not include information either on current health insurance coverage from any source until 2014 or on current health insurance coverage by type until 2019. For 2019 and later years, however, the data allow us to construct estimates of current coverage by type and whether a worker’s usual hours on their current job are full-time or part-time. These estimates then can be compared to estimates for the same year based on coverage at any time during the calendar year by whether a worker’s usual hours on their longest job were full-time or part-time. It is reassuring that, in the years for which we have both types of information, the coverage patterns are very similar.
Another issue with using the CPS ASEC data to track the trends in coverage over time is that the survey instrument and processing procedures used to produce the survey estimates changed during our analysis period. First, in 2014, anticipating interest in how implementation of the ACA would affect health insurance coverage rates, the Census Bureau modified the CPS ASEC questionnaire to ensure that the most accurate possible measurements would be available. The new survey instrument was first used to collect coverage information for calendar year 2013. Rather than asking only about coverage during the prior calendar year, the new questionnaire begins by asking about current coverage. Follow-up questions then determine when that coverage started and probe the possibility of gaps in coverage (Pascale 2016; Pascale, Boudreaux, and King 2016). Second, the estimates for 2018 and later calendar years were affected by the 2019 introduction of a new processing system built to take full advantage of the richer information on coverage collected through the new survey instrument. The new processing system also incorporated improvements in the methods used to impute missing data and reconcile logically inconsistent answers (Berchick and Jackson 2022).
Any discontinuity in the survey estimates associated with the introduction of the new survey instrument in 2014 would have occurred between the estimates for calendar years 2012 and 2013. Some of the changes we see in the coverage series between those two years for different types of coverage may be a result of the survey instrument redesign, although results based on data collected as part of a content test carried out in 2013 suggest that the effects on overall coverage rates for employed individuals were modest. 8 Fortunately for the analysis, most of the ACA provisions whose effects we think are likely to have had an important effect on the full-time/part-time coverage gap were implemented in 2014 or later. The 2013 data give us a baseline set of estimates based on the same survey questionnaire as the estimates for later years. In much of what follows, we focus on changes in coverage between 2013 and 2021.
Any break in series associated with the implementation of the new processing system in 2019 would have occurred between the estimates for calendar years 2017 and 2018. Fortunately, the Census Bureau has made research data files available for the 2017 and 2018 surveys that contain data for calendar years 2016 and 2017 produced using the new processing system. Thus, for 2016 and 2017, we are able to construct two sets of estimates, one based on the old processing system and another based on the new one. To gauge the change in coverage patterns between 2013 and 2021, we use this information to adjust the 2013 estimates (produced using the old processing system) to make them more comparable to the 2021 estimates (produced using the new processing system). For each of the individual coverage types except for exchange coverage, this adjustment consists of adding the average 2016–2017 difference between the new processing system estimate and the old processing system estimate to the 2013 estimate. Because the exchanges did not yet exist in 2013, the exchange coverage rate would have been zero under the new processing system just as it was under the old one, so no adjustment to those numbers is warranted. The adjustment we apply to the overall coverage rate is the sum of the adjustments to each of the individual coverage types.
Trends in Health Insurance Coverage for Full-Time and Part-Time Workers
Our primary goal in this article is to shed light on how the various provisions of the ACA may have affected the full-time/part-time gap in health insurance coverage. We begin by examining the changes in own-employer insurance coverage, dependent coverage under another household member’s employer-provided plan, Medicaid coverage, coverage through an exchange, and other directly purchased private coverage over the 2000–2021 period, focusing especially on the changes between 2013 and 2021. We then use these data to quantify the contributions of changes in each of the different types of coverage to the overall changes in health insurance coverage for both full-time and part-time workers and to closing the gap between the two groups’ coverage rates over the post-ACA period.
Own and dependent employer-provided coverage
Figure 1a reports estimated rates of health insurance coverage under a person’s own-employer plan for both full-time workers (the solid lines) and part-time workers (the dashed lines). For each group of workers, one line shows estimates for 2000 through 2017 based on the old CPS ASEC processing system (labeled “early coding”) and a second line shows estimates for 2016 through 2021 based on the new CPS ASEC processing system (labeled “late coding”). In this and later figures, the differences in the estimates for the overlap years, 2016 and 2017, help us to gauge the effects of the processing system changes on the estimates. In part because we are less able to quantify the possible effects of the introduction of the new survey questionnaire used to produce the estimates for 2013 and later years on coverage rates by type of insurance, we show longer time series to provide context but focus mainly on the changes in health insurance coverage that have occurred since 2013.

(a) Own-Employer Health Insurance Coverage, Full-Time and Part-Time Workers, 2000–2021. (b) Full-Time/Part-Time Gap in Own-Employer Health Insurance Coverage, 2000–2021.
In every year shown in Figure 1a, full-time workers are much more likely than part-time workers to have own-employer health insurance. Coverage for both groups of workers had been drifting downward prior to the Great Recession. Own-employer coverage rates for full-time workers continued to fall through 2012. To assess the changes in later years, we look at the trends from 2013 through 2017 based on the old processing system and the trends from 2016 through 2021 based on the new processing system rather than directly comparing estimates across the break in series. Although the scale of the figure makes it difficult to see, the data suggest that own-employer coverage rates for full-time workers recovered somewhat after 2013. In contrast, after falling by a bit more than 5 percentage points from 2000 through 2012, the own-employer coverage rate for part-time workers has shown no clear trend from 2013 onwards.
Figure 1b focuses directly on the gaps in own-employer coverage between full-time and part-time workers. As in the previous figure, the early coding estimates for 2000 through 2017 are based on the old processing system and the late coding estimates for 2016 through 2021 are based on the new processing system. In this figure, the solid lines show the raw gap in coverage between the two groups of workers, and the dashed lines show estimated gaps after controlling for the effects of differences in demographic characteristics. To obtain the latter estimates, we fit the following regression:

In this regression, EHICOV
it
is a dummy variable that equals one if worker i in year t had own-employer health insurance coverage and otherwise equals zero. PT
it
is an indicator that equals one if a worker was part-time and zero if the worker was full-time; Z
it
is a vector of demographic controls for age, education, race, sex, marital status, the interaction of sex and marital status, and self-employment status;
To better quantify how the gap in own-employer coverage changed between 2013 and 2021, we add the average 2016–2017 difference in the estimated gap based on the new versus the old processing systems to the 2013 estimate to make it more comparable with the 2021 estimate. We term this the “harmonized” gap. The raw full-time/part-time gap in own-employer coverage rose from (a harmonized) 39.9 percentage points in 2013 to 41.1 percentage points in 2021. About 20 percent of the differences between the full-time and part-time own-employer coverage rates can be attributed to differences in their demographic characteristics. After controlling for demographic characteristics, again on a harmonized basis, the full-time/part-time gap increased from 32.0 percentage points in 2013 to 32.5 percentage points in 2021. 10
A substantial share of part-time workers receives dependent coverage on someone else’s employer-provided health insurance plan. Figure 2a displays estimates of the rates of dependent coverage through an employer-provided plan held by someone else in the household for both full-time and part-time workers. 11 Part-time workers have consistently higher rates of dependent coverage than full-time workers, though the share of part-time workers with dependent coverage has fallen over time. The drop in dependent coverage among part-time workers was especially steep between 2007 and 2009. This decline likely reflected job loss in the Great Recession among other workers in these individuals’ households who had previously held employer-provided family coverage (Holahan 2011). Interestingly, the dependent coverage rate for part-time workers never fully recovered to its pre-Great-Recession level and, after 2017, began to fall again.

(a) Dependent Health Insurance Coverage Under an Employer-Provided Plan, Full-Time and Part-Time Workers, 2000–2021. (b) Full-Time/Part-Time Gap in Dependent Coverage Under an Employer-Provided Plan, 2000–2021.
Raw and demographically adjusted estimates of the full- versus part-time gap in dependent coverage are shown in Figure 2b. The demographically adjusted estimates shown in Figure 2b are based on a regression like equation (1), but with the dependent variable based on whether a person had health insurance coverage as a dependent on another household member’s employer plan. Because the dependent coverage rate is larger for part-time workers than for full-time workers, these gaps are negative, but upward movements in the lines still mean that part-time workers are losing out relative to full-time workers (i.e., that the amount by which dependent coverage among part-timers exceeds that among full-timers is shrinking). After accounting for the measurement changes associated with the introduction of the new processing system by harmonizing the 2013 estimate based on the average 2016–2017 difference between the new and old processing system estimates, the raw dependent coverage advantage enjoyed by part-time workers shrank by 2.2 percentage points between 2013 and 2021, from 15.6 percentage in 2013 points to 13.3 percentage points in 2021. On a demographically adjusted basis, the decline was 1.8 percentage points, from 13.2 percentage points in 2013 to 11.4 percentage points in 2021.
Medicaid coverage
While coverage under employer-provided plans is generally lower even after the ACA than it had been in the early 2000s, coverage through Medicaid has risen for both full-time and part-time workers, especially for the latter. Figure 3a displays estimates of the Medicaid coverage rate for both groups. Between 2000 and 2012, Medicaid coverage grew 1.5 percentage points for full-time workers and 4.4 percentage points for part-time workers. Although the estimated change in Medicaid coverage between 2012 and 2013 could have been affected by the introduction of the new survey questionnaire, that change appears consistent with a continuation of the preexisting trend. Growth picked up after 2013; after harmonizing the data to account for the effects of the change in the survey processing system, we find that the Medicaid coverage rate grew 2.2 percentage points for full-time workers and 6.9 percentage points for part-time workers between 2013 and 2021, with almost half of the latter change occurring between 2013 and 2014, the year that the initial ACA Medicaid expansion took effect.

(a) Medicaid Coverage, Full-Time and Part-Time Workers, 2000–2021. (b) Full-Time/Part-Time Gap in Medicaid Coverage, 2000–2021.
Figure 3b displays the raw gaps in the Medicaid coverage rate between full-time and part-time workers along with demographically adjusted gaps obtained in the same fashion as for own-employer coverage and coverage as a dependent. As with the gap in coverage as a dependent on an employer-provided policy held by another household member, these gaps are negative, reflecting the fact that part-time workers are more likely than full-time workers to be covered by Medicaid. Here, the lines’ downward slopes mean that part-time workers were gaining coverage relative to full-time workers. In 2013, after harmonizing that year’s data for our estimate of the measurement effect that using the new processing system would have had, we find that part-time workers were 8.8 percentage points more likely than full-time workers to be covered by Medicaid. Of this gap, 1.3 percentage point can be explained by differences in demographic characteristics between the two groups of workers. The size of both gaps jumped in 2014 and continued to grow in the following years. By 2021, part-time workers were 13.5 percentage points more likely than full-time workers to have Medicaid coverage, and the demographically adjusted gap was 12.0 percentage points. Put differently, the differential growth in Medicaid coverage among part-time workers shrank the full-time/part-time coverage gap by 4.7 percentage points in the (harmonized) raw data and 4.5 percentage points in the (harmonized) demographically adjusted data between 2013 and 2021. 12
Because there is variation in whether and when states chose to expand Medicaid coverage (KFF 2024), we have more leverage for pinning down the effect of the ACA’s Medicaid expansion provision than for estimating the effects of other ACA coverage-related provisions that were implemented at the same time across the country. Our estimate of how the Medicaid expansion affected the relative probability that part-time workers received Medicaid coverage is based on the following equation:

where MED
ijt
is a dummy variable that equals one if worker i in state j in year t had Medicaid coverage and otherwise equals zero. PT
ijt
is an indicator that equals one if a worker was part-time and zero if the worker was full-time; MEXP
jt
is an indicator that equals one if state j had expanded Medicaid by year t and otherwise equals zero; the vector X
ijt
includes the same set of demographic controls as in equation (1);
The coefficient estimates from this model imply that living in a state in which Medicaid had been expanded raised the Medicaid coverage rate for full-time workers by 3.1 percentage points (δ0 = 0.031, se = 0.002). The added effect for part-time workers of being in a state where Medicaid had been expanded was 6.9 percentage points (δ1 = 0.069, se = 0.005), for a total effect on coverage among part-time workers of 10.0 percentage points (δ0 + δ1 = 0.100, se = 0.005). States that had expanded Medicaid coverage by 2021 accounted for 69 percent of the U.S. population in that year. A rough back-of-the-envelope estimate is thus that Medicaid expansion has reduced the overall full-time/part-time coverage gap by about 4.8 percentage points (0.69 times 6.9 percentage points). This aligns closely with the 4.7 percentage point decline in the raw full-time/part-time Medicaid gap in the aggregate data between 2013 and 2021 after adjusting for the effects of the change in the CPS ASEC processing system.
Health exchange and other private coverage
The option to purchase coverage through the health insurance exchanges is the other change introduced under the ACA that we hypothesized should reduce the full-time/part-time health insurance coverage gap. The establishment of the exchanges not only made it possible for individuals lacking other coverage to purchase a policy without regard to preexisting conditions but also made significant subsidies for the purchase of a policy available to members of lower-income households. Figure 4a shows the shares of full-time and part-time workers with health insurance coverage purchased on one of the new exchanges; this is zero for all years prior to 2014, and the figure shows data points only for the 2013–2021 period. In this figure, the estimates labeled “early coding” are modeled EBSA estimates; the estimates labeled “late coding” are estimates based directly on the survey data produced by the Census Bureau using the new CPS ASEC processing system. As can be seen in the figure, once the exchanges began to offer coverage, part-time workers were considerably more likely than full-time workers to take it up.

(a) Health Exchange Coverage, Full-Time and Part-Time Workers, 2013–2021. (b) Full-Time/Part-Time Gap in Health Exchange Coverage, 2013–2021.
Figure 4b shows both raw and demographically adjusted estimates of the full-time/part-time gap in exchange coverage. This gap is zero in 2013 (and earlier years), since the exchanges had not yet been established. By 2021, the raw full-time/part-time gap in exchange coverage was minus 3.6 percentage points. The gap after adjustment for differences in demographic characteristics was minus 2.8 percentage points, reflecting the greater take-up of exchange coverage among part-time workers. 14 On its own, this made a substantial contribution to closing the full-time/part-time coverage gap. 15
Clearly, part-time workers have taken disproportionate advantage of the option to purchase insurance through the health insurance exchanges. We would like to know, however, whether these policies represent a net increase in coverage or are substituting for private policies that otherwise might have been purchased through other channels. Figure 5a shows the full-time and part-time take-up rates for directly purchased private coverage other than that purchased on an exchange. Part-time workers are considerably more likely to be covered under this type of plan, but after accounting for the effects of the introduction of the new processing system on the data, their coverage under this type of plan was almost two percentage points lower in 2021 than it had been in 2013. In contrast, again after harmonizing the data, we see that the coverage rate for full-time workers was little changed. 16

(a) Other Private Coverage, Full-Time and Part-Time Workers, 2000–2021. (b) Full-Time/Part-Time Gap in Other Private Coverage, 2000–2021.
Figure 5b shows the raw and demographically adjusted full-time/part-time gaps in coverage under a directly purchased private plan not obtained through an exchange. Because, as shown in Figure 5a, the drop in this type of coverage was larger for part-time workers, the raw gap shown in Figure 5b has become less negative. This means that, on its own, the change in non-exchange, directly purchased private coverage would have widened the full-time/part-time coverage gap. The same pattern holds for the corresponding demographically adjusted gap.
To assess the combined effects of changes in exchange coverage and changes in other private coverage, Figure 6a shows coverage rates for the two types of coverage together. As already noted, as part-time workers became relatively more likely to purchase coverage through the exchanges starting in 2014, they became less likely to purchase other private insurance. Taking both into account, however, we see that part-time workers’ coverage under any directly purchased private policy rose substantially between 2013 and 2021. Combined coverage under directly purchased private policies also rose for full-time workers, but that increase was much smaller than for part-time workers.

(a) Health Exchange plus Other Private Coverage, Full-Time and Part-Time Workers, 2000–2021. (b) Full-Time/Part-Time Gap in Health Exchange plus Other Private Coverage, 2000–2021.
The effect on the coverage gap associated with private nonemployer policies can be seen in Figure 6b. Because part-time workers are more likely than full-time workers to have directly purchased private health insurance coverage, the coverage gap is negative. The fact that the numbers are more negative in later years indicates that coverage under these types of policies has increased more for part-time workers than for full-time workers. To compare the 2021 estimates with the 2013 estimates, we add the 2016–2017 difference between the late coding and early coding estimates for non-exchange, directly purchased private coverage to the 2013 estimates for directly purchased private coverage. Since the health insurance exchanges did not exist in 2013, we do not make any adjustment for the 2016–2017 difference between the late-coding and the early-coding (i.e., EBSA) exchange coverage estimates. After harmonization, our raw estimates show that part-time workers gained 2.0 percentage points relative to full-time workers with respect to directly purchased private coverage, including both exchange and other policies. The demographically adjusted numbers imply a relative gain of 1.4 percentage points for part-time workers.
While our focus here is on expansions in coverage through the exchanges, many of the people who have purchased exchange policies to replace other coverage may be better off as a result. The policies offered on the health insurance exchanges must meet minimum requirements that were not imposed on private policies prior to the ACA. In addition, because of the subsidies available to members of lower-income households, the exchange-purchased policies are likely to be more affordable for many people than similar policies purchased elsewhere.
Trends in overall coverage rates for full-time and part-time workers
Figures 1 through 6 have documented, respectively, the 2000–2021 trends for full-time and part-time workers in own-employer coverage, dependent coverage on another household member’s employer plan, Medicaid coverage, coverage purchased on a health exchange, other directly purchased private coverage, and combined health exchange plus other private coverage. Figure 7a reports estimated rates of health-insurance coverage from any source for full-time and part-time workers, including the types of coverage just listed plus the small amount of coverage in our sample obtained through military and veterans’ plans, Medicare, or the Indian Health Service.

(a) Health Insurance Coverage from Any Source, Full-Time and Part-Time Workers, 2000–2021. (b) Full-Time/Part-Time Gap in Health Insurance Coverage from Any Source, 2000–2021.
The ACA was passed into law following a period when the share of the population lacking health insurance had been rising. Between 2000 and 2007, overall coverage rates as estimated based on the pre-2013 survey questionnaire and old processing system fell 1.5 percentage points for full-time workers and 2.9 percentage points for part-time workers. This drop was followed by a sharp decline in the coverage rate for part-time workers over the next two years as the economy fell into the Great Recession. Coverage among full-time workers fell much less, and the overall full-time/part-time coverage gap widened by 4.8 percentage points between 2007 and 2009 to 10.7 percentage points in 2009. Coverage rates for both full-time and part-time workers had rebounded somewhat by 2012 and, as of 2013, were similar to—or even (for full-time workers) a bit higher than—rates in 2007, though, as discussed earlier, some of the difference between the 2012 and 2013 estimates may have been a result of the introduction of the new survey questionnaire (Pascale, Boudreaux, and King 2016). Coverage rates among both full-time and part-time workers jumped up between 2013 and 2014, the year when the Medicaid expansion began and the health insurance exchanges opened. The gains among part-time workers were much larger than those among full-time workers. Part-time workers continued to gain on full-time workers in 2015 and 2016, with the difference between the two groups leveling off after that. By the end of the period, coverage rates for both groups were notably higher than in the early 2000s, with larger gains relative to their previous coverage rates for part-time workers.
Figure 7b traces the estimates of the raw and demographically adjusted full-time/part-time coverage gap. Similar to what we have done with the estimates for the specific types of coverage, we assess the change in the coverage gap between 2013 and 2021 by harmonizing the 2013 estimate with that for 2021 to account for the effects of the introduction of the new processing system. Here, the adjustment is the sum of the 2016–2017 differences between the new coding and old coding estimates for all of the eight individual coverage types except for exchange coverage. The harmonized data imply a decline in the raw full-time/part-time overall health insurance coverage gap of 3.5 percentage points between 2013 and 2021, from 6.5 percentage points in 2013 to 3.1 percentage points in 2021. The harmonized demographically adjusted coverage gap fell by 3.8 percentage points between 2013 and 2021, from 5.1 percentage points in 2013 to 1.2 percentage points in 2021. 17
Summarizing the changes in coverage and coverage gaps
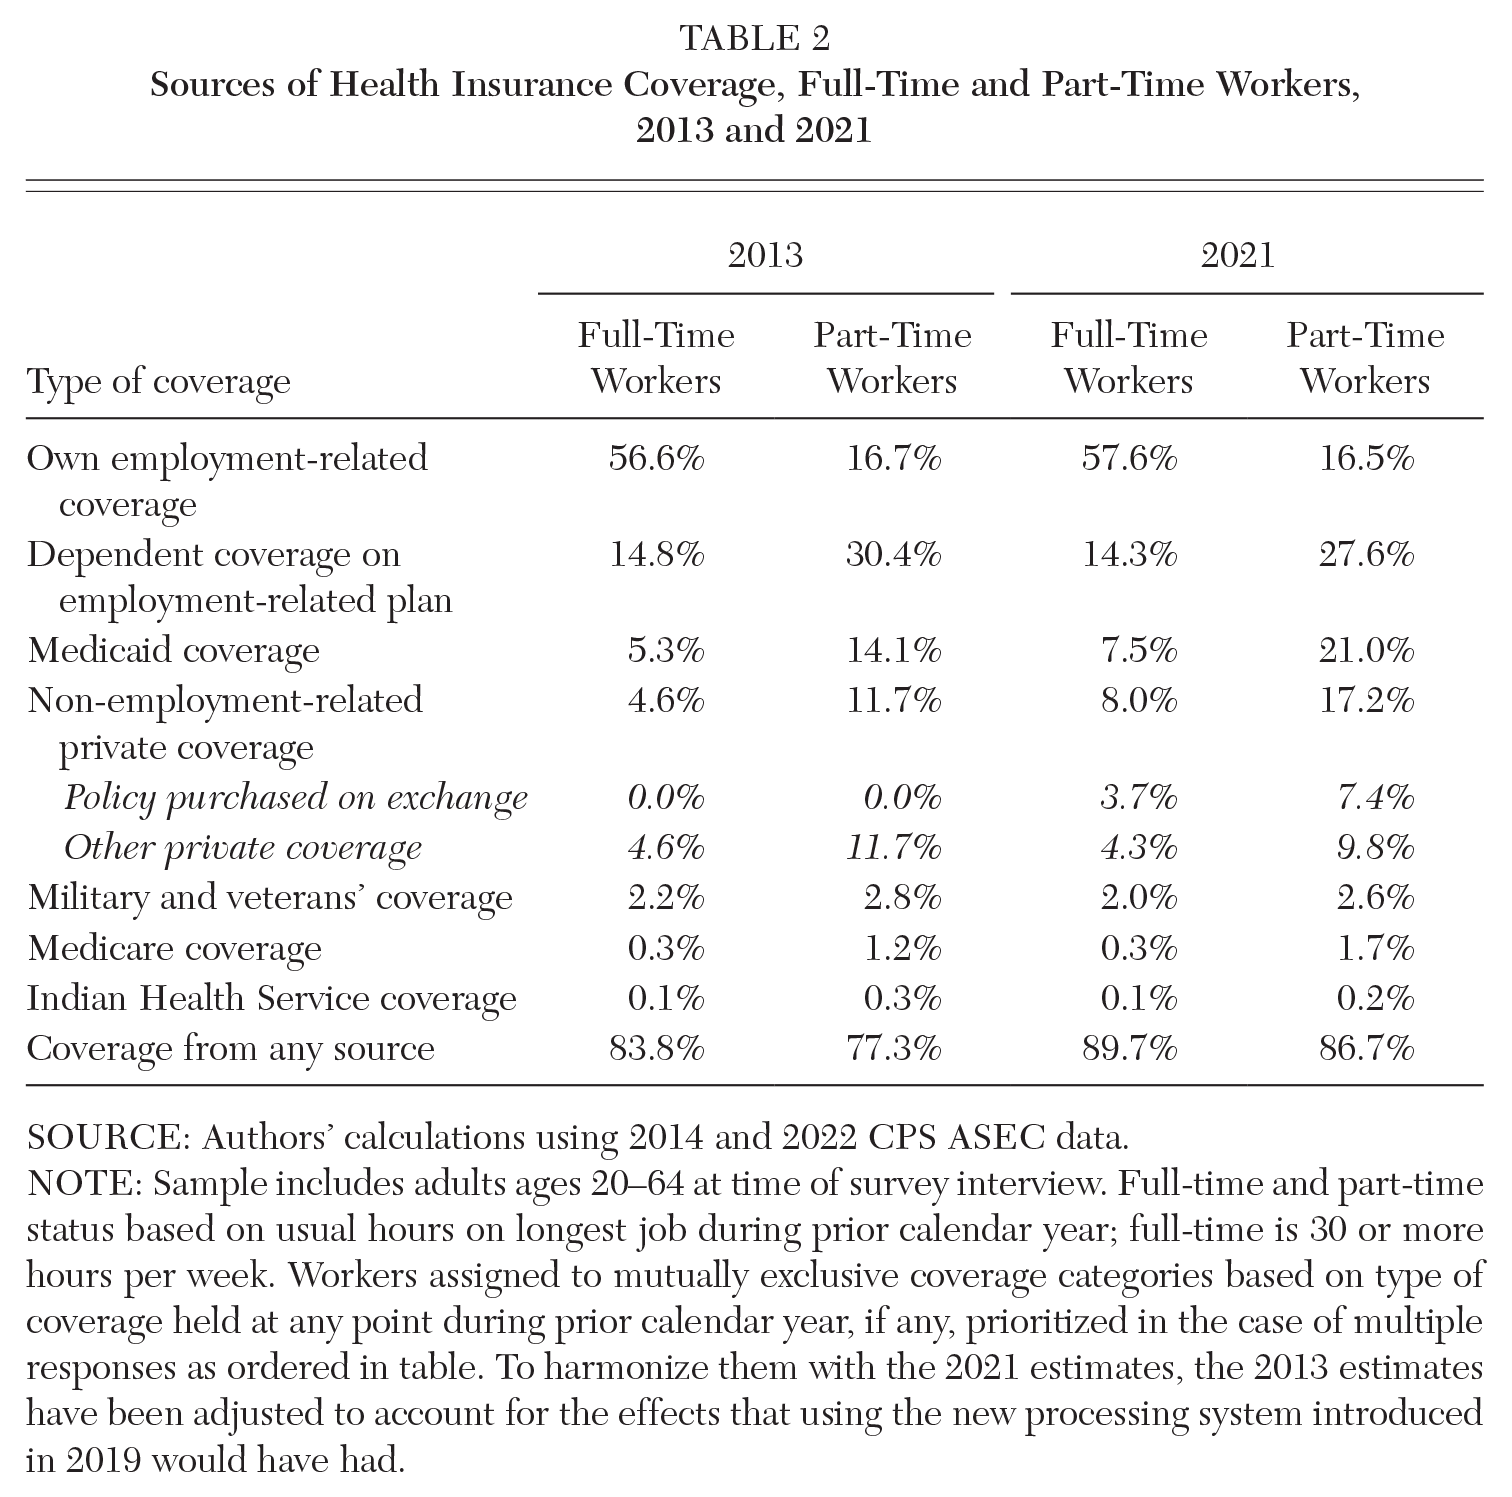
To help with summarizing our key findings, Table 2 reports the sources of health insurance coverage for full-time and part-time workers as of 2013, the year before most of the ACA coverage provisions took effect, and as of 2021, the most recent year in our data set. For these tabulations, as in the figures shown above, workers are assigned to mutually exclusive coverage categories. Workers who report more than one type of coverage are assigned to the first of the coverage types listed in the table that they report having had during the prior calendar year. For the estimates reported in the table, we have harmonized the 2013 estimates with the 2021 estimates to account for the effects of adopting the new processing system on the estimates.
Sources of Health Insurance Coverage, Full-Time and Part-Time Workers, 2013 and 2021
SOURCE: Authors’ calculations using 2014 and 2022 CPS ASEC data.
NOTE: Sample includes adults ages 20–64 at time of survey interview. Full-time and part-time status based on usual hours on longest job during prior calendar year; full-time is 30 or more hours per week. Workers assigned to mutually exclusive coverage categories based on type of coverage held at any point during prior calendar year, if any, prioritized in the case of multiple responses as ordered in table. To harmonize them with the 2021 estimates, the 2013 estimates have been adjusted to account for the effects that using the new processing system introduced in 2019 would have had.
As the previous figures have made clear, the sources of health insurance coverage for full-time workers and part-time workers are very different. Full-time workers are much more likely than part-time workers to have coverage through their own employment-related plan. Part-time workers are much more likely to have coverage as a dependent on another household member’s employment-related plan or through Medicaid. They also are more likely to have coverage under a directly purchased private plan, which by 2021 includes coverage under a policy purchased on a health insurance exchange. In both 2013 and 2021, coverage from any source is higher for full-time workers than for part-time workers, but the gap is considerably smaller in 2021.
The estimated gaps in the raw coverage rates for full-time workers and part-time workers based on the Table 2 estimates for 2013 and 2021 are shown in the first two columns at the top of Table 3. Again, the 2013 estimates have been harmonized with the 2021 estimates to approximate what they would have been had the new CPS ASEC processing system been in place. The third column in Table 3 shows the change in these harmonized raw coverage gaps from 2013 to 2021. The bottom panel reports similar information but for estimates that are adjusted for the demographic differences between full-time and part-time workers.
Changes in Full-Time/Part-Time Health Insurance Coverage Gaps, 2013 to 2021 (percentage points)

SOURCE: Authors’ calculations using 2014 and 2022 CPS ASEC data.
NOTE: Sample includes adults ages 20–64 at time of survey interview. Full-time and part-time status based on usual hours on longest job during prior calendar year; full-time is 30 or more hours per week. Workers assigned to mutually exclusive coverage categories based on type of coverage held at any point during prior calendar year, if any, prioritized in the case of multiple responses as ordered in table. To harmonize them with the 2021 estimates, the 2013 estimates have been adjusted to account for the effects that using the processing system introduced in 2019 would have had.
As can be seen in the top panel of Table 3, the most important contributor to shrinking the raw full-time/part-time gap in health insurance coverage has been the expansion of Medicaid, which on its own was associated with a 4.7 percentage point decline in the raw coverage gap. The availability of health insurance through the ACA exchanges also has contributed to shrinking the full-time/part-time coverage gap, though the relative gains in coverage for part-time workers associated with exchange coverage have been partially offset by relatively larger reductions in their coverage under other types of directly purchased private policies. The net change in the gap in other types of public coverage, here combined into one category, also contributed a small amount to shrinking the full-time/part-time coverage gap. Working in the other direction have been the expansion in own-employer coverage that benefited full-time workers but not part-time workers and the relatively larger declines in dependent coverage among part-time workers.
Demographically adjusted estimates are shown in the bottom panel of Table 3. The estimates in each row of the table are derived from regressions as specified in equation (1) above, with a dummy variable for the indicated type of coverage as the dependent variable. The gaps in coverage all are smaller after adjusting for differences in the demographics of full-time and part-time workers. By 2021, there is only a 1.2 percentage point gap in the demographically adjusted health insurance coverage rates of full-time and part-time workers. The decline in the size of the demographically adjusted full-time/part-time coverage gap is similar in magnitude to that in the raw data.
Discussion and Conclusion
Following the implementation of key coverage provisions of the ACA beginning in 2014, health insurance coverage rates grew for both full-time and part-time workers. These increases were notably larger for part-time workers, and the full-time/part-time gap in health insurance coverage fell significantly between 2013 and 2021. In this article, we have described the changes in the different types of health insurance coverage that underlie this overall change. The expansion of Medicaid following the passage of the ACA has played an especially important role in raising health insurance coverage rates for working Americans, particularly for part-timers. The larger increase in Medicaid coverage for part-time workers has contributed substantially to shrinking the overall full-time/part-time coverage gap. Coverage obtained on the health insurance exchanges has likewise contributed to raising the coverage rates of working people and reducing the gap in coverage between full-time and part-time workers.
At the same time, part-time workers continue to be less likely than full-time workers to have health insurance coverage through their jobs. Indeed, the gap between full-time and part-time workers’ own-employer coverage rates widened between 2013 and 2021. In addition, although part-time workers also continue to be more likely than full-time workers to be covered as a dependent on another household member’s employer plan, their relative advantage in that regard has shrunk. Yet, even as changes in other types of coverage have partially offset part-time workers’ relative gains in Medicaid coverage and subsidized coverage purchased through the health exchanges, they have not undone those effects.
While there is good reason to be concerned about the continued gap in coverage between full-time and part-time workers, the size of that gap has shrunk significantly, thanks to changes in coverage attributable to key provisions of the ACA.
Footnotes
NOTE: This article was prepared for the Authors’ Conference in Memory and Honor of Rebecca M. Blank held at the Federal Reserve Bank of Chicago, February 22–23, 2024. The authors are grateful for research assistance from Francisca Afantchao Biakou, for helpful comments on an earlier draft from David Johnson and Helen Levy, and for the suggestions made by participants at the conference.
Notes
Katharine G. Abraham is Distinguished University Professor of Economics at the University of Maryland. She has served as commissioner of the Bureau of Labor Statistics and as a member of the President’s Council of Economic Advisers. She is a distinguished fellow of the American Economic Association.
Henry S. Farber is Hughes-Rogers Professor of Economics Emeritus at Princeton University. Farber has served as president of the Society of Labor Economists and received the Jacob Mincer Award for Lifetime Contributions to the Field of Labor Economics. He was Rebecca Blank’s dissertation advisor at the Massachusetts Institute of Technology.