
Abstract
Measuring poverty is a complex undertaking. It requires extensive research, expert judgment of how to define resources and needs, and a data infrastructure that enables accurate measurement. In this article, we briefly summarize the evolution of poverty measurement in the U.S. and discuss the recommended changes to the Supplemental Poverty Measure that were recently proposed by an expert panel of the National Academies of Sciences, Engineering, and Medicine (NASEM). We emphasize how the costs of medical care, child care, and housing can be better accounted for in the measurement of poverty, and the need to incorporate administrative data records with survey data.
At the dawn of the War on Poverty 60 years ago, among the first tasks facing policymakers were defining poverty and measuring its scale and composition. The task of counting the number of poor people fell to the Social Security Administration and, in particular, to a statistician named Mollie Orshansky, who proposed a measure of poverty that compared a family’s before-tax cash income to a poverty line or basic-needs budget. In particular, her proposal defined the poverty line as three times the minimally necessary food budget (Orshansky 1963). By the end of the decade, a variant of the Orshansky measure was adopted as the nation’s Official Poverty Measure (OPM) and subsequently has been used extensively by social scientists and policymakers to monitor the well-being of the poor and to evaluate the effectiveness of programs in alleviating poverty. Today, this same OPM, updated only for inflation, is used not only to track the economic status of low-income families over time but also to determine, in whole or in part, funding amounts and/or eligibility for scores of transfer programs costing hundreds of billions of dollars annually.
The composition of the social safety net has substantially changed since the 1960s, and the inflation-adjusted safety net spending on families has grown dramatically. So, the importance of accurate poverty measurement has, if anything, increased since the invention of the OPM. The OPM considers only cash, so it misses the explosion of spending on in-kind transfers, such as health insurance from Medicaid and Medicare and food assistance from the Supplemental Nutrition Assistance Program (SNAP). Since it is calculated before taxes, it also misses the emergence of social assistance administered through the tax code via refundable credits, such as the Earned Income Tax Credit (EITC) and Child Tax Credit (CTC). In addition, while the poverty line is adjusted annually for changes in the cost of living, the basis of the scale factor of three to inflate food budgets hinges on a 70-year-old survey that was conducted at a time when Americans spent much more of their budget on food.
It was with these considerations in mind that, in 2011, the U.S. Census Bureau began to produce and disseminate an alternative measure of poverty known as the Supplemental Poverty Measure (SPM). The SPM differs from the OPM in how both resources and basic needs are measured. These changes grew out of a report from a 1995 National Research Council (NRC) panel (NRC 1995) that recommended expanding the definition of needs to include clothing, shelter, and utilities in addition to food, as well as adopting a new method for calculating the threshold as a function of the actual spending patterns in the past year. 1 On the resource side, the panel recommended using a post–tax-and-transfer measure of resources, as well as subtracting from resources certain out-of-pocket expenditures that were deemed nondiscretionary, including spending on medical care and child care. As depicted in Figure 1, in most years, the poverty rate under the SPM has exceeded the OPM rate, with the notable exception of 2020 and 2021, when extraordinary outlays were made in response to the COVID-19 pandemic. These outlays, many of which flowed through the U.S. Treasury via the tax system, were captured by the SPM but not the OPM. Not only does the rate change, but the composition of who is living in poverty changes as well (see Bahk, Moffitt, and Smeeding, this volume). This divergence underscores the importance of measurement for a proper understanding of the impact of government policy.
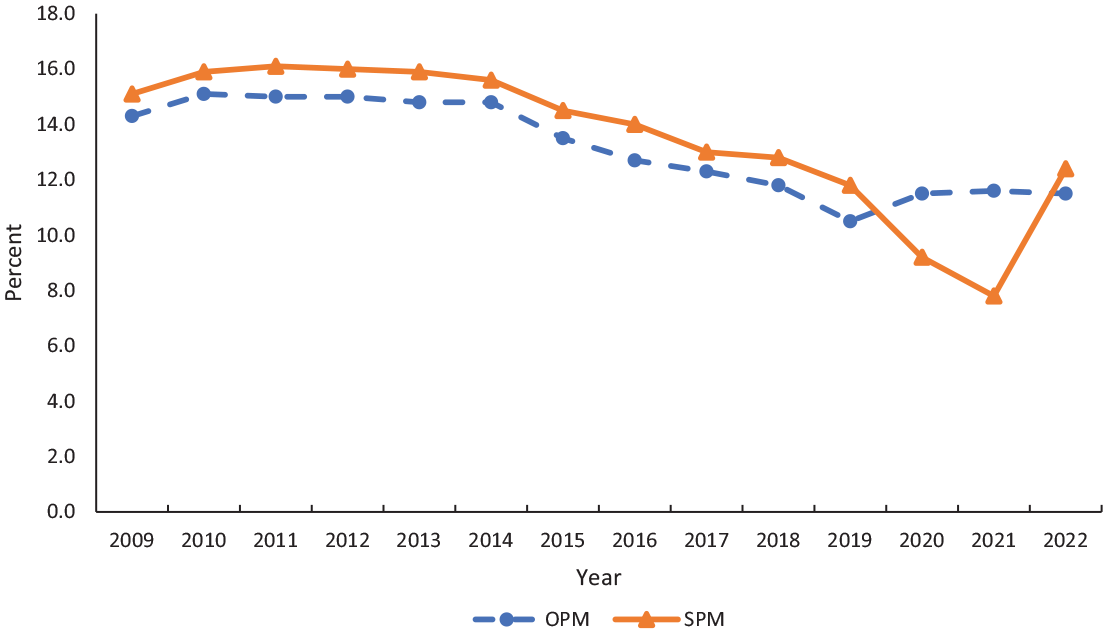
Percentage of People in Poverty under the OPM and SPM: 2009–2022
In 2020, the Census Bureau, in collaboration with the Bureau of Labor Statistics (BLS), commissioned a new National Academies panel (National Academies of Sciences, Engineering, and Medicine [NASEM] 2023) to assess whether the current SPM could be improved to better monitor the economic need of lower-income people and to increase its value to policymaking. The panel, of which we were members, focused its efforts on three major components of the SPM that are particularly challenging in terms of accurate conceptualization and measurement: medical care, child care, and housing. The panel also paid a great deal of attention to the survey and administrative data infrastructures that are used to measure poverty. The panel offered a number of recommendations across those key domains and also on ways to make the measure more informative to policymakers. The report included a recommendation to elevate the revised SPM as the nation’s headline statistical measure of poverty and to rebrand it as the Principal Poverty Measure (PPM).
The aim of this article is to summarize the key recommendations of the panel’s report (NASEM 2023) and the important role that Rebecca “Becky” Blank played in the evolution of poverty measurement. Becky was a member of the earlier 1995 NRC panel and was under secretary of commerce when the SPM was launched. She also contributed extensively to research and evaluation of the safety net. Indeed, we dedicated the 2023 NASEM report to the memory of our friend and inspiration, Rebecca Blank.
First, we provide a brief overview of poverty measurement in the U.S. as defined by the OPM and discuss the development of the SPM and the intellectual contributions of Becky Blank to its genesis. We then summarize key recommendations underlying the proposed PPM in the 2023 panel report and follow with discussion of reactions to some of the panel’s recommendations. We conclude with reflections on potential future modifications to the PPM.
OPM and the Development of the SPM
The definitive account of the development of the OPM is found in Fisher (1992, 1997), and we begin by summarizing some of the key features of that measure prior to discussing the SPM. Orshansky (1963) adopted an absolute threshold to define the basic-needs budget of households in the OPM in lieu of a relative threshold; an absolute threshold defines needs in terms of a fixed minimum standard of living, whereas a relative scale treats needs as a function of current patterns of income or consumption. Using data from the Household Food Consumption Survey conducted by the U.S. Department of Agriculture (USDA) in 1955, Orshansky estimated that the average family of three or more persons spent about one-third of their after-tax cash income on food. She therefore multiplied the cost of the USDA’s economy and low-income food plans for families of different types by three in order to define the minimum income required to meet basic needs: that is, a set of poverty thresholds. Each year since 1969, the thresholds based on the more conservative economy food-plan budgets have been updated for changes in inflation as measured by the Consumer Price Index for All Urban Consumers (specifically, the CPI-U since 1980). Applied uniformly across the entire country, the thresholds make no distinction for the wide geographic variation in the cost of living.
Economic resources in the OPM are defined as before-tax money income. This includes earnings, payments from benefit programs, and income from other sources such as investments. 2 This information is collected on an annual basis as part of the Annual Social and Economic Supplement (ASEC) to the monthly Current Population Survey (CPS). The universe for the OPM consists of families and unrelated individuals, where family means two or more persons residing together and related by marriage, birth, or adoption. The income of all family members is summed to yield total family income for the year, and related subfamilies are assigned the income of the primary family unit, meaning all members share the same poverty status.
In 1969, the Bureau of the Budget (1969), now known as the Office of Management and Budget (OMB), issued a budget circular (the precursor to Statistical Policy Directive 14) launching the measure developed by Orshansky as the OPM (Fisher 1992). 3 When it was issued, that directive was explicit in stating that the thresholds were to be used for statistical purposes only and that they “were not developed for administrative use in any specific program and nothing in this Directive should be construed as requiring that they should be applied for such a purpose” (NASEM 2023, 27). However, many programs adopted a simplified version of the thresholds known as the poverty guidelines to determine eligibility (U.S. Department of Health and Human Services, n.d.). This includes programs such as Medicaid, Head Start, Medicare Part D prescription drug subsidies, SNAP, Low-Income Home Energy Assistance Program (LIHEAP), Job Corps, and income-driven repayment plans for federal student loans, among many others.
Criticisms of the OPM
Although the OPM is widely used and recognized, it suffers from numerous shortcomings that make it a problematic metric of well-being (Blank 1997; Blank and Greenberg 2008; NASEM 2023; NRC 1995; Ruggles 1990). As noted above, the definition of income used in constructing the U.S. poverty rate excludes many income sources—both cash and in-kind—including the dollar value of SNAP and other food assistance, subsidized and public housing, Medicaid, Medicare, capital gains and losses, the imputed rental value of owner-occupied housing, and refundable tax credits. 4 To be sure, the relative importance of these sources of income has grown over time. Among the explanations for their exclusion include the fact that some programs did not exist (i.e., the EITC); some were in their infancy when the modern poverty rate was established in the 1960s (i.e., Medicaid, Medicare, food stamps, public housing); other income sources were not collected in the CPS until a later date (e.g., capital gains and losses) or not at all (e.g., imputed rental income); and deductions from spendable income, such as tax payments and work-related expenses, were omitted. Another cause for concern is the question of whose income is counted in determining poverty status. The OPM counts only resources of family members and thus omits resources contributed by cohabiting (unmarried) partners and other unrelated individuals residing in the household.
Moreover, the OPM approach to defining poverty thresholds has also been subject to criticism (NRC 1995; Ruggles 1990). For one thing, the OPM threshold is based on an absolute scale, which means that the standard of living for the poor in the U.S. in 2024 is assumed to be the same, in inflation-adjusted terms, as it was 60 years ago. But a typical family today spends about one-eighth of their income on food, compared with one-third when the OPM threshold was developed. 5 Additional critiques of the OPM threshold include the fact that it does not vary by location, despite ample evidence of geographic variation in prices, and that the method used for adjusting for the size and composition of a family (so-called equivalence scales) sometimes yields unintuitive results. For example, the threshold for a two-parent, two-child family is lower than that of a one-parent, three-child family.
The 1995 NRC panel
Responding to the growing concerns over the efficacy of the OPM in the 1970s and 1980s, the U.S. Census Bureau contracted with the NRC in 1992 to convene an expert panel to review the OPM and to recommend possible alternative approaches (NRC 1995). The work of the NRC panel came on the heels of a comprehensive assessment of the OPM by Ruggles (1990), and many of the NRC recommendations affecting both resources and thresholds adhered closely to those she suggested. 6 The NRC recommended that a new poverty threshold be calculated based on a market basket defined by expenditures on food, clothing, shelter, and utilities, plus an adjustment factor to account for needed spending on personal care, nonwork transportation, and household supplies. In the benchmark year of 1992, the panel proposed that the threshold should start with some fraction of median spending on the market basket for the representative four-person family and then apply a markup of 1.15 to 1.25. 7 This range would make the threshold between 14 and 33 percent higher than the 1992 official threshold. 8
The panel recommended that this threshold be updated annually to reflect changing consumption patterns and thus move away from an absolute poverty measure, like the OPM, to a relative measure. Further, to smooth out statistical noise, the panel suggested using a moving average of the three most recent years of inflation-adjusted consumption spending. Similar to Ruggles (1990), the NRC also recommended that the threshold be adjusted for geographic differences in the cost of living, but only with respect to the housing component; other consumption components were not included because of lack of reliable granular data. 9
On the resource side, the NRC panel recommended that the income measure must be consistent with the thresholds and include the resources necessary to purchase the market-basket bundle of food, clothing, shelter, and utilities. Hence, the resource measure includes the current sources of income found in the OPM plus near-cash transfers, such as SNAP and housing assistance, less tax payments net of refundable credits; as a consequence, resources would be higher for those tax units with refundable credits exceeding federal and state tax payments. In addition, the panel recommended that out-of-pocket medical expenses, medical insurance premiums, child care costs, child support payments, and work expenses be deducted. The rationale for subtracting out-of-pocket medical spending, rather than adding a need for health insurance and/or medical care to the basic-needs budget, was the complexity of defining that need, given the wide variation in health status across the population. As discussed below, the 2023 NASEM panel differs in its recommendation to add medical-care need to the threshold.
Becky Blank and the emergence of the SPM
After the publication of the 1995 panel’s report, the Census Bureau began publishing a series of experimental poverty estimates based on many of the ideas spelled out in the NRC recommendations. 10 However, more than a decade would pass before an alternative measure took on increased prominence and importance. This development was due in part to the research and influence of Becky Blank. In her 2007 presidential address to the Association of Public Policy and Management, Blank (2008) made a forceful case in favor of a new poverty measure, which she called the “Revised Poverty Measure.” In her address, she argued that Congress or the executive branch should assign a statistical agency the authority to develop an alternative measure of income poverty that produces both a credible and coherent poverty threshold and a consistent and appropriate resource measure. Furthermore, Blank argued that this revised measure should be used for statistical purposes only, and thus public programs could continue to use the OMB-defined poverty rate or multiples of the poverty guidelines as an eligibility cutoff. 11
A year after the address, Blank and Greenberg (2008) took an important step forward by proposing a specific NRC-type measure that included measuring needs from expenditure data with geographic adjustments and accounting for medical and child care in resources. They also argued that “the Census Bureau report the new poverty measure as its primary measure of poverty in its annual income and poverty report” (Blank and Greenberg 2008, 26). Using data for the 2006 calendar year, they reported the NRC-type poverty rate of 13.6 percent compared to the 12.3 percent OPM rate, which is consistent with the typical experience comparing the SPM and OPM as in Figure 1.
Following the election of President Barack Obama in 2008, Becky was confirmed by the U.S. Senate as under secretary of economic affairs in the Department of Commerce in May 2009. In this capacity, she directed the creation of an interagency technical working group, which provided a set of observations (and convinced the OMB to include funding in the federal budget) for the Census Bureau and Bureau of Labor Statistics to develop what came to be known as the SPM; its first publication then came in 2011 (Interagency Technical Working Group on Developing a Supplemental Poverty Measure 2010; Short 2011).
As noted previously, the SPM defines the threshold based on the sum of spending on food, clothing, shelter, and utilities (FCSU), plus extra for personal-care necessities. While the details of the calculation of resources, thresholds, and sharing unit have changed over the years, the basic structure has remained the same. Specifically, as of the 2021 SPM report, the threshold is set at 83 percent of the averages of the 47th to 53rd percentile range of spending on food, clothing, shelter, utilities, telephone, and internet (FCSUti) among households with children, plus a 20 percent markup. 12 The SPM poverty thresholds vary based on whether a family rents their home, owns it with a mortgage, or owns it without a mortgage; in addition, the thresholds account for differences in housing costs based on residence in one of 342 metropolitan or nonmetropolitan areas. This results in more than 46,000 unique thresholds, which are estimated using 60 quarters of data from the Consumer Expenditure Survey and converted to real terms using the CPI-U for the categories of spending in FCSUti.
SPM resources include those found in the OPM, namely, cash income and transfers. In addition, the SPM includes near-cash transfer payments from food assistance (SNAP, school meals, Special Supplemental Nutrition Assistance Program for Women, Infants, and Children), subsidized housing, and home energy assistance. Nondiscretionary payments for taxes and child support are subtracted from resources, as are work-related expenses such as child care. Notably, tax payments may be negative due to refundable credits from the EITC and CTC and thus may result in net additions to resources. Following the recommendations in NRC (1995), the SPM subtracts out-of-pocket spending on medical care and health insurance from resources because these payments limit the ability of households to meet FCSUti needs. The SPM resource-sharing unit expands upon the OPM family unit to include cohabiting partners and their children as well as foster children. These changes represent a major improvement, but the SPM still falls short of counting all resources available in the household.
Recommendations of the 2023 NASEM Panel
The SPM is a marked improvement over the OPM in accurately tracking the well-being of low-income households and the effects of government policies on their well-being. The 2023 NASEM panel was tasked with assessing whether the SPM could be made even more effective as a metric of well-being and as a guide to a better understanding of the impact of economic programs. It focused its efforts on the areas deemed most conceptually challenging in the current measure: namely, the treatment of medical care, child care, and housing, as well as the data infrastructure. In its deliberations, the panel was guided by four core principles—accuracy, consistency, transparency, and feasibility—as well as attributes of those principles, such as timeliness, completeness, and accessibility. And there is tension, in some ways, among these principles. For example, revisions that improve accuracy in capturing resources, such as imputed rent from owner-occupied housing, may be less transparent to the general populace or less feasible to implement in practice. In weighing changes to the SPM, the panel ensured that any changes made to the threshold were balanced by corresponding changes to the resources side of the ledger. These are summarized in Table 1, which highlights important differences between the PPM and SPM.
Comparison of OPM, SPM, and PPM Measures of Income Poverty

NOTE: OPM = Official Poverty Measure; SPM = Supplemental Poverty Measure; PPM = Principal Poverty Measure; MOOP = medical out-of-pocket spending.
A new headline Statistical Poverty Measure
Echoing the 1995 NRC panel, as well as recommendations from Blank (2008) and Blank and Greenberg (2008), the 2023 panel believed that the OPM has long outlived its usefulness as the primary measure of poverty and thus recommended elevating its proposed revision of the SPM to the nation’s headline poverty statistic, renaming it the PPM. Harkening back to Statistical Policy Directive 14 of 1978, the panel recommended that the PPM be used for statistical purposes only, under the presumption that it and other measures, such as the OPM, are not suitable for the purposes of determining program appropriations or eligibility levels. Despite this recommendation, in the likelihood that Congress and federal agencies will still find poverty guidelines and rates useful for program administration, the panel encouraged the Census Bureau to continue to produce the OPM on an annual basis but rebrand it as the Basic Poverty Measure.
Medical care
The panel determined that the current SPM fell short conceptually of characterizing the basic needs of households by not including the insurance necessary to cover medical care. Medical-care spending accounts for more than one-fifth of national income, and although it is not possible to insure fully against unexpected health shocks, it is possible to insure against unexpected health spending. The panel argued that medical care is a fundamental need of all persons to attain self-sufficiency and participate fully in society. Currently medical need is captured in the SPM through the deduction of out-of-pocket medical expenses from resources, but the cost of medical insurance is not included. Thus, the panel recommended inclusion of health insurance premiums in the threshold. Specifically, following the extensive research by Korenman and Remler (2016) and Korenman, Remler, and Hyson (2019) to develop health-inclusive poverty measures (HIPM), health insurance need is proxied by assigning to each nondisabled person under age 65 the price of an age-specific Silver Plan under the Affordable Care Act (ACA). For those aged 65 and older, or the disabled under age 65, the price of the full-cost Medicare Advantage Plan that includes prescription drug coverage is recommended. Balancing this change to the need standard, the panel recommended adding to resources the value of employer-sponsored or government-subsidized or provided health insurance. Annual spending on Medicare and Medicaid is approaching $1.5 trillion, and employer-paid premiums are nearing $1 trillion, but these subsidies are not currently captured in the SPM. Because health insurance transfers are nonfungible, this subsidy should be capped at the need value. In other words, once an individual has an insurance plan that meets the need value, a more generous insurance plan above and beyond that value would not be counted as adding more resources to the household. Finally, because individuals still pay substantial uninsured costs of medical care, out-of-pocket spending on medical care should be deducted from resources, though unlike current practice, these deductions are to be capped at the out-of-pocket maximums for ACA Marketplace Plans.
Census has already investigated how to incorporate these changes into the treatment of health insurance into the SPM. Figure 2, which reproduces the same figure found in Creamer (2023), shows how the 2022 household poverty status would change if the HIPM were used instead of the SPM. The vast majority of the population—97 percent—have the same poverty status under SPM and HIPM; those without health insurance make up 60 percent of those who are newly measured as poor under HIPM. Intuitively, this is because the need for health insurance is added to the needs standard, but since these households do not have insurance, no addition can be made to the resources side of the ledger.
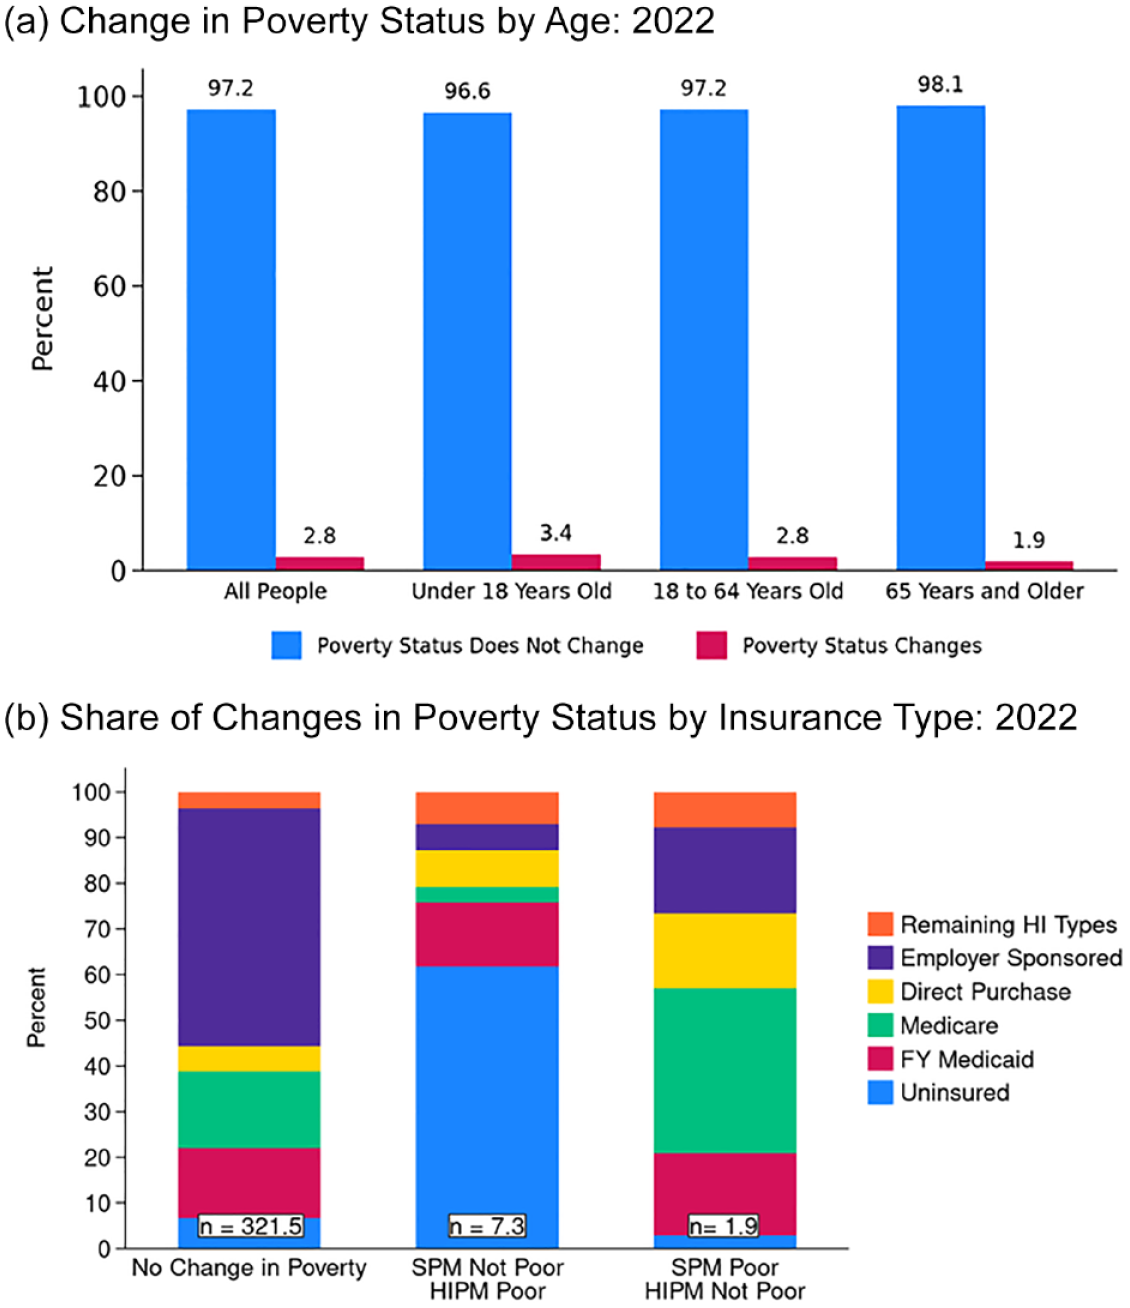
Change in SPM Poverty Status with Inclusion of Health Insurance
Child care
The majority of families with children incur child care costs, which can be very high. For households with young children who use child care, one-sixth of household budgets go to child care (U.S. Council of Economic Advisers 2023). Moreover, households receive nearly $20 billion in annual subsidies to defray the cost of child care. However, in the current SPM, child care is treated as a cost of working and, although subtracted out of resources, is not included in the threshold. In addition, subsidies are not directly quantified but only indirectly captured to the extent that they reduce the amount of out-of-pocket spending reported to the CPS and then subtracted from resources. Thus, the panel recommended that the Census Bureau and BLS begin a new research agenda on how to incorporate child care as a basic need and how to value the subsidies received.
When considering child care, the panel was more circumspect in its recommendations than it had been on the question of medical care. This caution arose from the fact that there is a paucity of research on how to best incorporate child care needs into the threshold (something that would almost certainly require additional data collection in the CPS ASEC and the American Community Survey [ACS]). One suggestion for immediate change to the SPM, however, was to allow a deduction for child care costs from resources for parents enrolled in education or training programs, thereby treating parents in education/training akin to those parents who are employed. Another short-run change would add the need for child care to the threshold for households using paid care. Valuing the cost of child care is difficult, because costs for paid care vary substantially by age, number of children, types of care, and location, among others. One approach to valuing need is to use state and federal policies that direct reimbursement rates for subsidized care, such as those established for Child Care and Development Fund (CCDF) programs. Balancing this addition to the threshold would entail including in resources the value of child care subsidies and child care tax credits received by households (the latter are already counted in the SPM), with those subsidies capped at the value of need. While all children need care, many parents choose to stay home with their children or rely on extended families and friends to provide care, and the panel encouraged research on how to value that care. Following those in paid care, one approach is to assign all families a CCDF-type subsidy as a proxy for need in the threshold, whether they use paid or unpaid care, and then add that same subsidy to the resources side of the ledger for those using unpaid care. There is a rich literature on the valuation of nonmarket home production (e.g., NRC 2005, ch. 3; Suh and Folbre 2016), but more research as applied to poverty measurement is needed.
Housing
The SPM currently includes a comprehensive treatment of housing in the threshold. However, it was the judgment of the panel that the treatment of housing could be improved in both conceptual clarity and transparency. Two concerns with the current approach were raised: first, the fact that different thresholds are used depending on whether the householder rents or owns their home, even though all have the same basic need for shelter and housing ownership is endogenous; and second, the fact that all nonmetropolitan areas of a state are lumped into a single housing category, despite the fact that there is substantial variation in housing costs across rural areas within a state. The panel recommended replacing the current approach with Fair Market Rents (FMRs) as the threshold shelter need. FMRs are established by the U.S. Department of Housing and Urban Development (HUD) for the housing-choice voucher program and are designed as a proxy for the rent of a moderately priced, standard-quality dwelling in the local housing market. As such, they vary across the more than 2,700 housing authorities in the nation, offering substantial geographic variation in the threshold relative to the current approach.
On the resource side, the SPM currently includes housing subsidies, and the panel recommended continuing that practice, with the value of the subsidy capped at the FMR. Recognizing that there is implicit income associated with homeownership, the panel also recommended adding as a resource the value of the rental income that could be derived from owner-occupied housing if it were on the rental market, less any user costs such as homeowners’ insurance and interest on a mortgage. This would align the PPM with current practice in other agencies of the federal government, including the Bureau of Economic Analysis in its annual estimates of national income, as well as with the methodology of calculating poverty statistics in some other countries.
Data infrastructure
The resources for the current OPM are wholly measured using annual survey responses to the CPS ASEC, while those used in the SPM come primarily come from the CPS ASEC with several items imputed (simulated), such as housing assistance and tax payments and credits. The CPS ASEC faces two pressing challenges: first, the increase in survey nonresponse both to the survey overall and to specific questions like earnings (Bollinger et al. 2019); and second, substantial underreporting of transfer program participation and dollar amounts (Meyer, Mok, and Sullivan 2015). Yet a third challenge is the ASEC’s limited sample size to conduct subnational poverty tracking and program evaluation. No less important is that the proposed PPM contains new resource and threshold elements that would require new survey data.
Recognizing these challenges, the panel made several recommendations on improving the data infrastructure. The most significant of these is to extensively link administrative data records with the surveys, especially from transfer programs. The Census Bureau has embarked on this effort over the past several years (and much longer for earnings) but faces a substantial barrier in this effort, given that the states control the data for most transfer programs and, for reasons of confidentiality, are reluctant to share data. A methodological challenge is that, ex ante, it is not always obvious whether to treat the survey or the administrative records as the “truth,” because both sources of data may contain errors or differences in what is covered by the measurement. In the case of social transfers, the administrative records are almost surely preferred because they represent an accounting of actual benefits paid out to recipients. For labor market earnings, however, survey responses may be preferred because they may include wages from jobs not subject to taxation (and thus not in the administrative universe) or from jobs that are not reported to tax authorities. Clearly, there is a need for further research on integrating administrative records, as is currently underway with the Census NEWS project (see Bee et al. 2023).
Criticisms of Report Recommendations
Measuring poverty is complex, requiring extensive research and expert judgments on how to define resources and needs, as well as the data infrastructure necessary to operationalize measurement. This makes the process inherently controversial because well-informed observers may disagree on what should and should not be considered a need or a resource—or even on who should have ultimate say on such matters. There have been criticisms of the SPM, with new ones emerging since the release of the 2023 NASEM report.
Burkhauser et al. (2021) criticized the SPM for its failure to include the value of government health benefits or the service flow value of homeownership in resources; for its reliance on survey data that underestimate some elements of income; for the complexity of the threshold calculation, particularly in regard to housing; and for its use of geographic adjustments to thresholds.
Addressing many of these concerns (Dolan 2024), the PPM includes the removal of the multiple thresholds based on housing ownership status and the treatment of housing income recommended by Burkhauser et al. (2021). Geographic adjustments in the PPM are now built into the thresholds and rely on the programmatic uses of the FMR and not the adjustments included in the SPM. The PPM also includes the value of Medicaid and Medicare in the resources and recommends using administrative data to improve the income measure in surveys. 13
One of the recent criticisms of the PPM is that poverty should be defined by Congress and not by an unelected panel. Winship (2023), and even Rubio (2023), argue that decisions on poverty are inherently moral, and not scientific, and such decisions should be left to the elected representatives in Congress. But while the ultimate decisions on which suggestions to adopt will be made by policymakers, those decisions should be informed by research and careful analysis. Indeed, the National Academies (which sponsored the panel and report) were established by President Lincoln in 1863 for the sole purpose of providing scientific evidence and advice to help policymakers make informed decisions. This panel adhered to its charge of providing expert advice to the Census Bureau on potential conceptual and methodological improvements to the SPM. One enduring legacy of Blank (2008, 25) was her strong recommendation to “assign a statistical agency the authority to develop an alternative measure of income poverty. . . . We must remove control over poverty measurement from within the Executive Office of the President [and Congress, added by the authors] if we want to produce a regularly updated and improved poverty measure. Poverty measurement should be treated like all other statistics.”
The other recent criticism, raised by Corinth (2024), is that because the proposed PPM thresholds will be higher than, and increase more often than, the OPM thresholds, it would expand access to the safety net to more households if it were used for program eligibility. As noted above, the OPM rate and thresholds (or guidelines) are used by the federal government to determine the allocation of federal resources across states for a number of programs, and the guidelines are used to determine eligibility for scores of transfer programs. However, since the PPM measure consistently includes some components in both resources and thresholds (e.g., housing, health care, and child care), it is not clear how these measures could be used for program eligibility.
Moreover, to the extent that programs use the poverty rate and not the threshold to determine allocation of resources, there is even less certainty about what direction the poverty rate will move given that the PPM adds a number of currently unaccounted-for subsidies for health insurance and child care as well as imputed rental income. If agencies continued to use thresholds or guidelines for program eligibility, they would be at liberty to continue to use the OPM, and if using the PPM, they could always adjust the percentage of the threshold for qualification. For example, SNAP uses 130 percent of the OPM guideline for gross income eligibility for nonseniors and nondisabled households. If the PPM guideline is 30 percent higher than OPM, then Congress would have the option to set eligibility at 100 percent of the PPM guideline to make the change revenue neutral.
A final criticism is that it would be preferable to scrap an income-based measure of poverty and rely instead on a consumption measure of well-being and poverty. Some argue that consumption is less subject to measurement error, serves as a better proxy for well-being because it reflects longer-term economic factors facing the household, and is less affected by idiosyncratic changes in annual incomes (Meyer and Sullivan 2012). 14 In considering the construction of a consumption-based measure, the panel recognized several challenges affecting surveys across federal agencies, both in the U.S. and across the developed world. Indeed, as the main data source for consumption conducted by the BLS—the Consumer Expenditure Survey—has experienced a substantial decline in response rates, the burden on constructing survey weights that maintain population representativeness has intensified. The panel’s report also discusses the importance of considering assets and debt in assessing poverty. As a general matter, however, the panel did not reject consumption as a valuable metric of well-being but instead adhered to its charge from the Census Bureau and BLS to recommend improvements to the SPM and thus restricted its efforts to measuring income poverty. Although not a specific recommendation, the report recognized the importance, stressed by Blank (2008) and Blank and Greenberg (2008), that multiple measures of well-being, including material hardship and consumption, play in evaluating poverty.
Conclusion
The 2023 NASEM panel made several recommendations for changes to poverty measurement that were aimed at making our metrics a more realistic reflection of the actual well-being of households and a more accurate tool for use in policymaking. Notable was the attention that the panel paid to effects of medical care, child care, and housing on household resources and needs, and the ways in which the U.S. data infrastructure could be improved. Recognizing that some areas remained unaddressed, the panel also recommended that expert panels be assembled on a regular (e.g., five-year) basis to advise the Census Bureau and BLS of future possible revisions to how we measure poverty.
Three areas stand out as areas for future consideration—transportation, food assistance, and assets and debt. While the 2023 panel held discussions on these topics, they put forth no firm recommendations. In a typical year, transportation costs comprise the second- or third-largest category in household budgets. The current SPM accounts for work-related expenses by deducting a simulated value from resources, but much like with health insurance and child care, a case could be made that transportation belongs as part of a basic-needs budget and thus should be included in the threshold. Research on valuing transportation for the purposes of poverty measurement is needed to help guide decisions on whether and how to include it in a basic-needs bundle. Nor did the panel recommend changes in the method for incorporating food into the threshold. While food need is currently based on measured spending patterns, a case could be made to replace it with a need-based metric along the lines proposed for medical care, child care, and housing. For example, the Thrifty Food Plan, which is one of four food plans produced by the USDA and underlies the SNAP benefit, could be used to gauge food need. However, the USDA food plans account only for food produced and consumed at home, and thus, a poverty measure that also accounted for food produced and/or eaten away from home would require additional adjustments. Research is needed on how to make such adjustments and how to gauge potential implications for measuring need. Finally, many households carry debt with required mandatory payments (e.g., student loans) that limit their ability to meet basic needs, but whether these payments (like housing tenure) are endogenous and thus conflate income flows from asset stocks is subject to debate. In coming years, these topics, and perhaps several more, are likely to form the basis of rich research and policymaking on measuring the well-being of low-income households in the U.S.
Becky Blank’s research highlighted the importance of both theoretical concepts and practical measurement issues in measuring poverty. In recent decades, there has been much careful research done that has improved our ability to assess poverty. Yet there remain many thorny problems to address, and more research is needed. The field will continue to build on Becky’s legacy to refine and improve our measurement of poverty.
Footnotes
Notes
David S. Johnson is a senior program officer at the Committee on National Statistics in the National Academies of Sciences, Engineering, and Medicine (NASEM) and an adjunct faculty at Georgetown University’s McCourt School of Public Policy.
Helen Levy is a research professor at the University of Michigan’s Ford School of Public Policy, School of Public Health, and Institute for Social Research.
Jordan Matsudaira is a professor at the School of Public Affairs at American University.
Barbara L. Wolfe is Richard A. Easterlin Emerita Professor of Economics and Public Affairs at the University of Wisconsin–Madison, where she is a former director of the Institute for Research on Poverty and of the La Follette School of Public Affairs. She is a member of the National Academy of Medicine.
James P. Ziliak is Gatton Endowed Chair of Microeconomics in the department of economics at the University of Kentucky, where he is also founding director of the Center for Poverty Research.