
Abstract
Using a measure designed to capture intolerance on both sides of the political spectrum, I find that opinions favoring the abridgement of free speech rights are overwhelmingly targeted at right-leaning groups, and racist groups in particular. Consistent with recent studies, Democrats are found to be less tolerant than Republicans of speech they dislike. However, contrary to existing findings, the same patterns of intolerance are present for both racist and nonracist target groups. Treating racist groups as an exception to the principle of free expression may have resulted in a spillover to intolerance of other disliked groups.
For many Americans, freedom of expression is a cherished democratic norm. Indeed, “free speech” is probably the most widely known of all democratic norms in the U.S. That said, public understanding of the principle of free expression does not run particularly deep. Research has long demonstrated that the very same people who enthusiastically support free expression in principle often fail to do so when that expression involves views they find personally objectionable. The study of political tolerance has for many decades tracked Americans’ willingness to allow disagreeable views to be openly expressed.
Democratic norms dictate that citizens support the rights of others to express opinions with which they personally disagree, even those they may find abhorrent. While norms such as “one person, one vote” seem natural in the context of a democracy worldwide, the same cannot be said about freedom of expression, a right that is protected more broadly in the U.S. than anywhere else (Boch 2020). Favoring the right of others to express what one perceives to be repugnant political views is not easy. As a result, freedom of speech has always been more of an aspirational goal in the U.S. rather than something consensually upheld in actual practice.
Nonetheless, early research on mass support for political tolerance suggested that the majority of political leaders and the well-educated helped to enforce this norm. Democracy was argued to survive by virtue of the “carriers of the creed,” that is, the leadership of better-educated individuals who would continually reinforce and uphold democratic norms (McClosky 1964).
Today, free expression is widely thought to be under attack in multiple ways. From the left, there is intolerance for what might be considered “hate speech,” that is, speech offensive to identity groups in particular (Armstrong and Wronski 2019). Whether words constitute “harm” is now widely debated, especially when those words are directed against historically marginalized groups (Boch 2022; Chong and Levy 2018). From the right, there have been efforts to weaken protections from libel suits, to ban books that describe alternative lifestyles, and to dictate which ideas can and cannot be taught in public schools and universities. And despite their supposed status as carriers of the creed, prominent political leaders of both major parties have engaged in highly publicized efforts to censor the expression of views seen as inconsistent with their own political agendas.
Measurement of Political Tolerance
In the late 1970s, the General Social Surveys (GSS) began asking questions about the speech rights and civil liberties of racists and militarists (on the right) and communists, atheists, and homosexuals (on the left). Respondents’ answers to these fixed questions have been used by public opinion scholars to assess levels of political tolerance. The GSS measures have suggested tremendous increases over time in support for open expression by homosexuals, atheists, communists, and militarists.
By the 1980s, some scholars had begun to question the optimistic conclusions based on the GSS studies. In particular, Sullivan, Piereson, and Marcus (1979) argued that the groups tracked by the GSS were no longer challenging targets due to a declining sense of threat from communists, atheists, and so forth. Tolerance is known to be affected by one’s sense of threat from the specific groups one is being asked to tolerate as well as by one’s support for the general principle of tolerance. The threat that a group poses at any given point in history will negatively affect the extent to which people are willing to support the expression of its views (Gibson 1992). By the 2000s, because communism was no longer as salient a threat to Americans as it once was, it was an “easier” target for purposes of assessing people’s levels of tolerance.
Perhaps what appeared to be increased support for the democratic norm of free expression was, in reality, the fading of perceived threats from these specific groups on the left, that is, communists, atheists, and homosexuals. In other words, maybe scholars were unintentionally confounding less hostile attitudes toward a few specific groups with generalized support for the principle of free expression, that is, supporting the speech rights of those whose views one dislikes.
Political leanings have always influenced GSS-style tolerance measures. When the GSS asked about atheists, communists, and socialists, liberals consistently voiced higher levels of tolerance than did conservatives (Davis 1975; Nunn, Crockett, and Williams 1978). Likewise, conservatives were more tolerant than were liberals of groups on the right. These cross-sectional differences—along with the fact that some GSS groups were tolerated more than they had been previously, while others were tolerated less—made it difficult to argue that this evidence constituted support for the content-neutral principle of free expression.
In response to this problem, Sullivan, Piereson, and Marcus (1979, 1982) proposed a new measurement technique, one designed to avoid conflating the target group’s political leanings with the political leanings of respondents. What became known as the “least-liked group,” or “content-neutral,” measure of tolerance consisted of first asking individuals to select a group whose views they especially disliked from a list. The lists always included controversial left-leaning and right-leaning groups. Then GSS-style questions about tolerance for freedom of expression were asked in the context of whichever group the individual selected as least liked. This assured that people were advocating speech rights for a group with which they personally disagreed.
This new measure had the advantage of requiring fewer survey questions than did the GSS technique as well as posing less risk of becoming outdated, provided scholars made sure to include relevant threats from the left and right as they waxed and waned over time (Sullivan, Piereson, and Marcus 1979). The conceptual logic of this approach is that “tolerance” for free expression requires first and foremost that people actively disagree with the views being expressed. By definition, one cannot “tolerate” speech that one agrees with. Even when a high-quality survey such as the GSS asks about the very same groups over time, they are assessing support for the speech of a disliked group only for some specific, but unknown, subgroup of the sample. If the group in question is liked by a respondent, or not seen as at all threatening, then the positive responses cannot be argued to demonstrate support for tolerance of free expression.
What Sullivan, Piereson, and Marcus (1979) argued was that the GSS measures documented a trend toward higher levels of support for the expression of views on the left, but not necessarily toward greater tolerance of all views. More controversially, they argued that, based on their new measures, “pluralistic intolerance”—that is, intolerance directed toward a multitude of groups, rather than just a few—was safer for society than intolerance focused on a few targets whose views might be silenced by majorities. Some scholars later pointed out that it is unlikely that people tolerant of the extreme left would come to the defense of groups on the extreme right (Sniderman et al. 1991). This observation was not a criticism of the measurement technique as much as the substantive conclusions drawn from them.
Other objections to the least-liked group measure resulted from the groups that researchers chose to include on their lists. For example, the right to free speech of domestic terrorist groups, or those encouraging violence, would not be honored under the First Amendment if the speech qualified as a “true threat.” Nonetheless, at a time when both had recently engaged in violence, the Black Panthers and Symbionese Liberation Army were included in one study using the least-liked method. Those who commit or incite violence should be excluded from such lists since supporting their speech rights could be interpreted as condoning acts of violence, which is generally not protected speech (Petersen et al. 2011).
Variations on the least-liked measurement technique have been used periodically over the years by many scholars. One comparison from the 1980s suggested that the fixed-group GSS technique and least-liked methods produced many of the same findings (e.g., Gibson 1992). At a time when the GSS groups tapped into Americans’ main political anxieties, this was probably true. But unlike the GSS, the least-liked technique has never been adopted by any ongoing survey platform, so we do not know what the trends using this technique would look like over time or whether the two approaches would show similar demographic patterns. Instead, what we know is based strictly on the target groups chosen when the GSS began asking tolerance questions.
If the choice of measurement technique makes no difference, then the GSS measures are likely to serve social scientists well for purposes of tracking change in tolerance over time, as well as for cross-sectional analyses of which demographics are more/less tolerant. However, two observations suggest that these past conclusions are worth reexamining. First, in light of the many highly visible threats to free expression in contemporary American politics, the GSS-based conclusion that Americans are now more supportive of free speech than ever before, with the sole exception of racist speech, seems suspect at best. Second, the GSS conclusion rests on the assumption that atheists and communists are just as representative of threatening groups on the left as they were in the 1970s—another doubtful assumption.
Based on recent analyses, racist speech has been found to be an exception to the general pattern of increasing tolerance. Tolerance of racist speech no longer follows the patterns of other GSS groups, leading Chong, Citrin, and Levy (2022, 3) to conclude that there has been a “realignment” in political tolerance. Newly gathered data cannot go back in time to assess change as the GSS did. However, it can establish whether the realignments noted for the GSS measures as of 2018—changes in which party, age group, and educational levels are most tolerant—are also reflected in least-liked tolerance measures. If these departures from previous patterns are ongoing, as Chong, Citrin, and Levy (2022) suggest, then they should be even more in evidence by 2022.
A Realignment in Support for Free Expression?
Three well-known demographic patterns in the GSS tolerance measures have been relatively consistent until recently. First, holding a four-year college degree has long been a significant positive predictor of upholding rights of free expression. Scholars dubbed education the “great engine” of political tolerance, with the institution familiarizing an increasingly well-educated American population with official democratic norms (Stouffer 1955). Second, tolerance has traditionally been higher among younger generations than among older Americans. Third, liberals have customarily been more tolerant than conservatives.
Based on GSS findings, Chong, Citrin, and Levy (2022) note several “realignments” in who is more tolerant. For example, they suggest that a college education no longer promotes tolerance as it once did because universities currently emphasize speech restrictions and political correctness over freedom of expression. With respect to ideology, they suggest that liberals have replaced conservatives as the less-tolerant ideological group, mainly due to prominent liberal arguments for censoring hate speech. Older Americans are also more tolerant than younger people now, a shift Chong, Citrin, and Levy attribute to changes in the socialization of young people.
Their analyses compared the GSS measures in 1976 to those in 2018 and found that these traditional demographic alignments had either weakened or changed direction for racist speech in particular (Chong, Citrin, and Levy 2022). For example, while support for the speech rights of all groups still follows the usual pattern in which the well-educated are most tolerant, the magnitude of the difference between college graduates and nongraduates has declined the most for racist speech, although it also has declined for militarists and leftists (see Table 1, p. 11 in Chong, Citrin, and Levy 2022). The authors hypothesize that the college-educated have been socialized to see this form of free speech as outside of democratic norms and as in conflict with egalitarian principles. 1
Reliability of Least-Liked Tolerance Measures
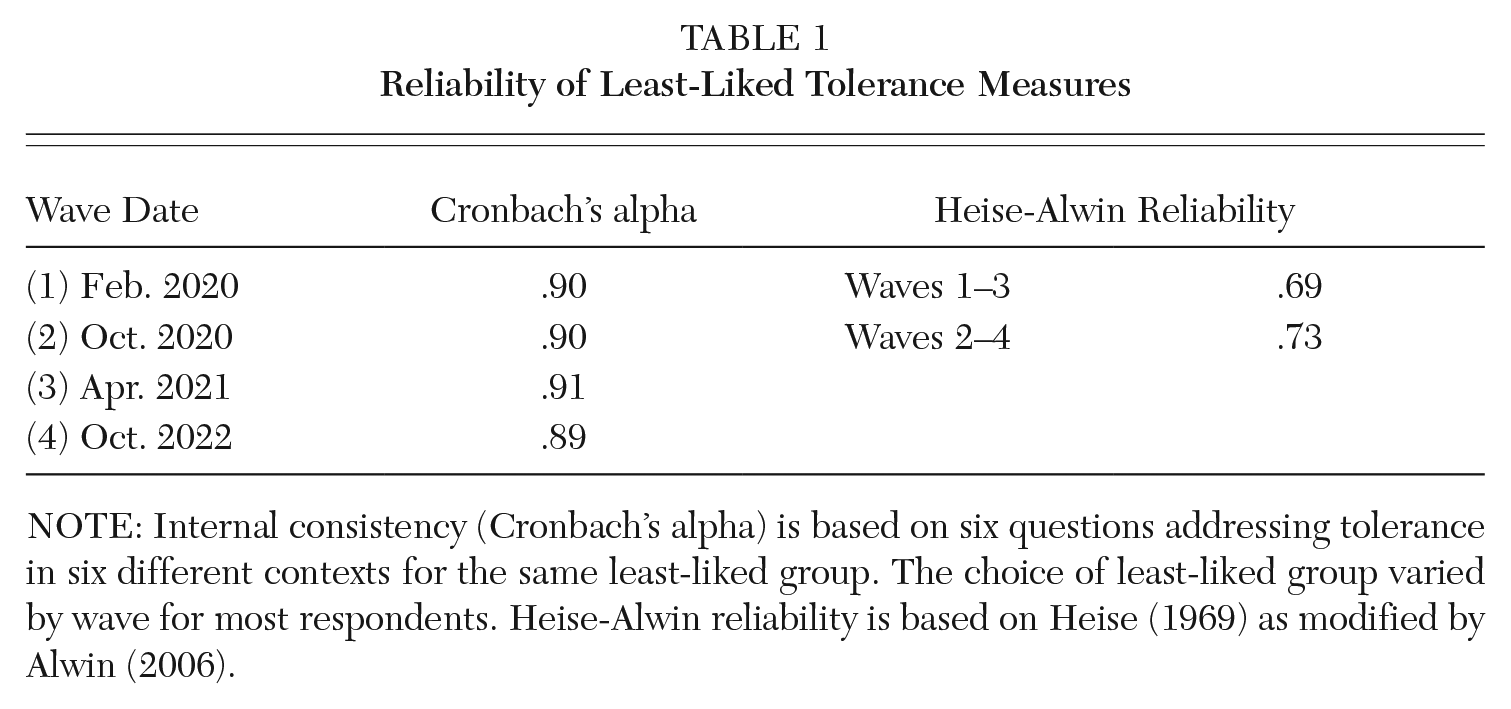
NOTE: Internal consistency (Cronbach’s alpha) is based on six questions addressing tolerance in six different contexts for the same least-liked group. The choice of least-liked group varied by wave for most respondents. Heise-Alwin reliability is based on Heise (1969) as modified by Alwin (2006).
The largest change they document occurred across age groups, with a complete reversal in who is now more tolerant of racist speech. Younger people were more tolerant in 1976 but, by 2018, they were less tolerant than those over 40. The original pattern optimistically portended an increasingly tolerant population as generations moved forward. Although younger people are still more tolerant of nonracist GSS target groups, racist speech is an exception. The fact that, as with education, the differences between tolerance in these two age groups also declined by more than 70 percent for tolerance of militarists and leftists makes it less clear just how distinctive racist speech is.
The usual ideological pattern, in which liberal leaning predicts greater tolerance, was muted by 2018, when there was no longer a significant difference between liberals and conservatives. However, this same diminished difference applies not only to tolerance of racist speech, but also to speech rights for militarist and leftist groups. The difference between liberals and conservatives had lessened for tolerance of racist groups by 2018, but it was comparably reduced for militarists as well (see Chong, Citrin, and Levy 2022, Table 1 ).
Limitations of Evidence for Realignment
Based on bivariate comparisons, tolerance of racist speech is argued to have “realigned” from the demographic patterns present in tolerance of other groups. This argument makes intuitive sense, but there remain some reasons for doubt about whether Americans making tolerance judgments distinguish between racist speech and all other types of offensive speech. First, the comparisons in the GSS analyses are all bivariate; they do not take into account the changing relationships between these three demographics. For example, those over 45 are also consistently more conservative than younger people (Kuta 2020), thus confounding age and ideology. In addition, Republicans were the better-educated political party in the 1970s, whereas Democrats are now better-educated than Republicans (Sances 2019). Given education’s important influence on tolerance, these demographic shifts by party may have implications for the unique influence of age, education, and ideology in multivariate analyses.
The only right-leaning target groups available in the GSS other than racist groups are militarist groups. 2 Racists remain a highly salient concern in the U.S., with Americans holding increasingly negative views of them. 3 Militarists, on the other hand, are difficult for many, if not most, Americans to fathom. I confess I had to look up the term “militarist” to make sure I understood what it meant. The GSS defines militarists for respondents within the survey as “those who support military rule.” On the other hand, the current Oxford Dictionary defines militarist as a “derogatory term” for “a person who believes that a country should maintain a strong military capability.”
For purposes of long-term survey trends, it is unfortunate that this term’s meaning has changed considerably over time. Perhaps more important, militarists are a group with which contemporary Americans have little familiarity, unlike citizens of countries that have experienced military coups. The January 6th insurrection is probably the closest Americans have come in recent memory, although in that case it was not the U.S. military attempting to interfere with democratic processes. Because of changes in this term’s meaning and the lack of current concern surrounding rule by the military, the GSS evidence is not as convincing as it might be that the observed realignments pertain strictly to racist speech and not to other right-wing groups that people might find difficult to tolerate. Finally, as detailed above, although Chong, Citrin, and Levy (2022) highlight the decline from 1976 to 2018 in tolerance of racist speech, this shift toward smaller differences by demographics is also present for tolerance of militarists and leftists, if to a lesser degree (see Chong, Citrin, and Levy 2022).
Atheists, communists, militarists, and racists no longer cover the spectrum of highly visible groups that are strongly disliked by Americans on the left and right. Few people find atheists threatening now that organized religion is on the wane in the U.S. Religious “nones,” that is, those who do not identify with any religion, are in the ascendance (Campbell, Layman, and Green 2021), so it should not be surprising that atheists are now less disliked. Their speech might be more widely “tolerated,” according to GSS measures, but since the U.S. is now a far less religious country than it was in the 1970s, support for free speech by atheists is not, for most Americans, a good example of tolerance of views they dislike. By the end of the Cold War, the communist threat had receded as well, thus making it unsurprising that infiltration of the U.S. by domestic communists was no longer a grave concern. To the extent that people dislike the original GSS target groups less now than they did formerly, conclusions based on GSS measures of tolerance may be misleading.
At present, the GSS measures are the only source of information about long-term change in levels of support for free expression. If other groups were substituted for these groups, would conclusions be the same? In this study, I reexamine the relationships between levels of tolerance and education, age, and ideology to evaluate whether a measure of tolerance based on people’s least-liked groups suggests a similar realignment in support for racist speech when people are able to select disliked groups. If anything, one would expect the events of 2020 involving George Floyd’s murder and the highly visible Black Lives Matter protests to intensify intolerance of racist speech and to produce even starker evidence of realignment.
Consistent with the hypothesis of realignment based on GSS data, Hypothesis 1a predicts that as of the 2020s, having a college education will negatively predict tolerance of racist groups but positively predict tolerance of nonracist groups. Hypothesis 1b predicts that younger age will negatively predict tolerance of racist groups but positively predict tolerance of nonracist groups. Hypothesis 1c suggests that liberals/Democrats will persist in being more tolerant than conservatives/Republicans of speech by nonracist groups, but liberals/Democrats will be less tolerant than Republicans of free expression from racist groups.
A second set of hypotheses addresses predictors of tolerance of left-leaning groups, right-leaning groups, and right-leaning groups that exclude racists. Hypothesis 2a predicts that Democrats will be less tolerant of right-leaning groups than Independents, and that, relative to Independents, Republicans will be less tolerant of left-leaning groups—even though respondents of both parties will choose their most-disliked group. In other words, while we ideally want to measure support for a general principle, support for freedom of expression will be biased by partisanship. Hypothesis 2b tests the argument that tolerance of right-leaning groups and right-leaning groups that exclude racists will be fundamentally different, with Democratic party identification more positively predicting tolerance of non-racist, right-leaning groups than right-leaning groups that include racists. Hypothesis 2c predicts that Democratic partisanship will more positively predict tolerance of nonracist, right-leaning groups than Republican partisanship will predict support for left-leaning groups. These hypotheses follow from the argument that racist groups are treated fundamentally differently by the left when it comes to support for free expression. With respect to education, the realignment hypothesis suggests that a college education should predict tolerance, but only if the target groups are not racist, since racist speech was suggested to be an exception to the greater tolerance expected of the well-educated (Hypothesis 2d).
Research Design
To evaluate the least-liked tolerance measures, I draw on panel data collected by the National Opinion Research Center at the University of Chicago through their Amerispeak panel. As part of a larger omnibus panel survey, questions using the least-liked tolerance measure were asked at four points in time over a period of 2.5+ years from February 2020 to October 2022. Respondents were recruited using address-based sampling. To avoid attrition, additional cases were added at each panel wave to ensure greater representativeness. The number of respondents answering tolerance questions at each of the four waves was 2,891, 2,601, 2,952 and 4,124, respectively. A total of 2,233 panel respondents were present in all four survey waves. Respondents were interviewed either online or by telephone and in either English or Spanish, based upon the respondent’s preference.
To construct least-liked tolerance measures, respondents were asked, “There are always some people whose ideas are considered bad or dangerous by other people. Next, we have a list of groups involved in politics today. Which of these groups do you like the least?” An equal number of right-leaning and left-leaning groups was shown, nine of each for a total of 18 possible groups (see online Appendix A). Once a group was selected, each respondent was asked a series of six questions about that specific disliked group’s rights to free expression.
Four of these questions mimicked previously asked GSS questions, and two additional items addressed open expression in newer contexts, such as whether government should be allowed to monitor the email and social media accounts of the group and whether government should require social media companies to censor content posted by that group. Agree-Disagree responses to these six items were averaged and rescaled to range from 0 to 1. Survey question wording can be found in online Appendix A.
To compare these findings with those of Chong, Citrin, and Levy (2022), I followed their approach and dichotomized the three demographic variables, education, age, and partisanship. I divided the sample into those without (0) or with (1) a four-year college degree or higher. For age, I dichotomized into those 44 and younger (0) and those 45 and older (1). 4
The one departure I make from Chong, Citrin, and Levy (2022) is that, when examining tolerance by political predispositions, I use Democratic and Republican party identification rather than self-identification as a liberal or conservative. I do so for both practical and substantive reasons. On the practical side, ideological self-placement has always been a difficult concept for many Americans to grasp. From the beginning of the American National Election Studies (ANES), when people were asked to place themselves on a seven-point ideology scale, between 18 and 36 percent of people said either “don’t know” or that they were not familiar enough with these terms to answer. In short, a large percentage of Americans do not see themselves in liberal-conservative terms. This same inability to answer the ideology question does not occur with party identification. Relying on partisanship thus avoids skewing a representative national sample.
On the substantive side, ideology does not track real-world politics the way that partisanship does. For example, more Americans have self-identified as “conservative” than “liberal” ever since the ANES studies began. Conservative self-identifications have always exceeded liberal ideological self-identifications, even at times of Democratic presidential landslides (Ellis and Stimson 2012). And despite extensive evidence of “sorting,” in which Democrats have come to identify more consistently as liberal and Republicans as conservative (Levendusky 2009), it is not clear how ideological labels map onto the contemporary political environment. Party and ideology are strongly correlated, but not interchangeable. It is also more difficult for citizens to map ideology onto political elites who are most frequently identified by party labels. Since people may take cues from elites about democratic norms, party is more likely to be connected to elite rhetoric on free speech than is ideology. Terminological confusion is especially likely given that freedom of speech is often referred to as a “liberal” ideal using an entirely different meaning of this term. Thus, to model the impact of politics on tolerance, I used dummy variables for Republican and Democratic party identification, with Independents as the reference group.
Before testing hypotheses, I first examined the measurement properties of least-liked tolerance measures. Drawing on the advantage of panel data, I used a latent-variable approach capable of separating stability from reliability, a calculation made possible by three or more panel waves. Second, I examine the disliked groups that were selected. When people have a choice of groups, how predictable are their choices over time? Third, I test the hypotheses proposed by the GSS findings. These analyses shed light on the extent to which previous findings generalize beyond the GSS measures. The Chong, Citrin, and Levy (2022) analyses end with the 2018 GSS data, but I use my own October 2022 wave of panel data to explore differences by demographic categories. These data were collected four years after the 2018 GSS and, thus, should provide even stronger evidence of a realignment.
Results
Is least-liked tolerance a reliable measure?
Three or more waves of panel data make it possible to use an especially powerful method of assessing the reliability of measurement, one that separates instability over time from underlying changes in the true score (Alwin 2006; Heise 1969). The Heise-Alwin method has been used to assess the reliability of core items from the GSS (see Hout and Hastings 2014, 2016), thus making it ideal for purposes of comparing least-liked and GSS reliabilities. I also use Cronbach’s alpha as a measure of interitem consistency for the six questions asked within each panel wave.
Table 1 displays the Cronbach’s alpha for each panel wave separately. The items are clearly tapping the same underlying concept, with alphas from .89 to .91. In the second column of Table 1, I use three sequential panel waves to calculate Heise reliabilities. 5 The goal of this procedure is to isolate measurement error as the single cause of lowered reliability by eliminating temporal instability from the calculation of reliability. The result is a reliability coefficient ranging from 0 to 1, with high values indicating higher reliability, that is, less measurement error.
Based on a three-wave panel from 2006–2008–2010, the GSS items had an average reliability of .72 across all groups asked about. Only tolerance of racists exhibited substantially lower reliability (Hout and Hastings 2014). For the least-liked tolerance measures, the reliability for the first three panel waves was .69, and the second set of three waves produced a reliability of .73. Based on this assessment, the GSS and least-liked tolerance measures appear to be roughly equally reliable.
The latent reliability of the least-liked measure was surprisingly high given that the questions asked over time are not necessarily asking about the same target group at each panel wave. In contrast, the GSS measures ask about the same groups each time and require a much larger number of repeated questions. Does it matter to the usefulness of the least-liked measures that panelists could select a different least-liked group from one wave to the next? Among respondents present across all four waves, only 44 percent of them selected the same least-liked group each time, assuming one treats various racist groups as interchangeable (i.e., racists, white supremacists, and the KKK). Fifty-six percent switched the group they selected one or more times over the four waves. Does this mean that the measures are not tapping the same construct each time?
On one hand, such high latent reliabilities suggest that the measures are, indeed, tapping the same underlying construct, wave after wave, even though respondents could change what group they selected as least liked with each new survey wave. It is thus useful to know whether respondents are at least sticking within the same categories of either left- or right-leaning disliked groups across panel waves (see online Appendix B for categories). In the sample as a whole, among those who were present in all waves, the overwhelming majority of respondents (71 percent) were consistent about which side of the political spectrum their disliked group came from; the remaining 29 percent sometimes named disliked groups on the left and sometimes named groups on the right. So, while a majority of people do not stick with the exact same least-liked group, most remain consistent in selecting a right-leaning versus a left-leaning group.
Figure 1 displays the percentage of Democrats, Republicans, and Independents who chose each type of group. To avoid repetition, I show only the most recent survey wave, from October 2022. What is most striking in Figure 1 is that racist groups were the most commonly chosen least-liked group among all three partisan categories. As expected, Republicans were less likely to choose racist groups relative to Independents, and Democrats were more likely to choose racist groups relative to Independents. Nonetheless, the consensus is somewhat surprising.
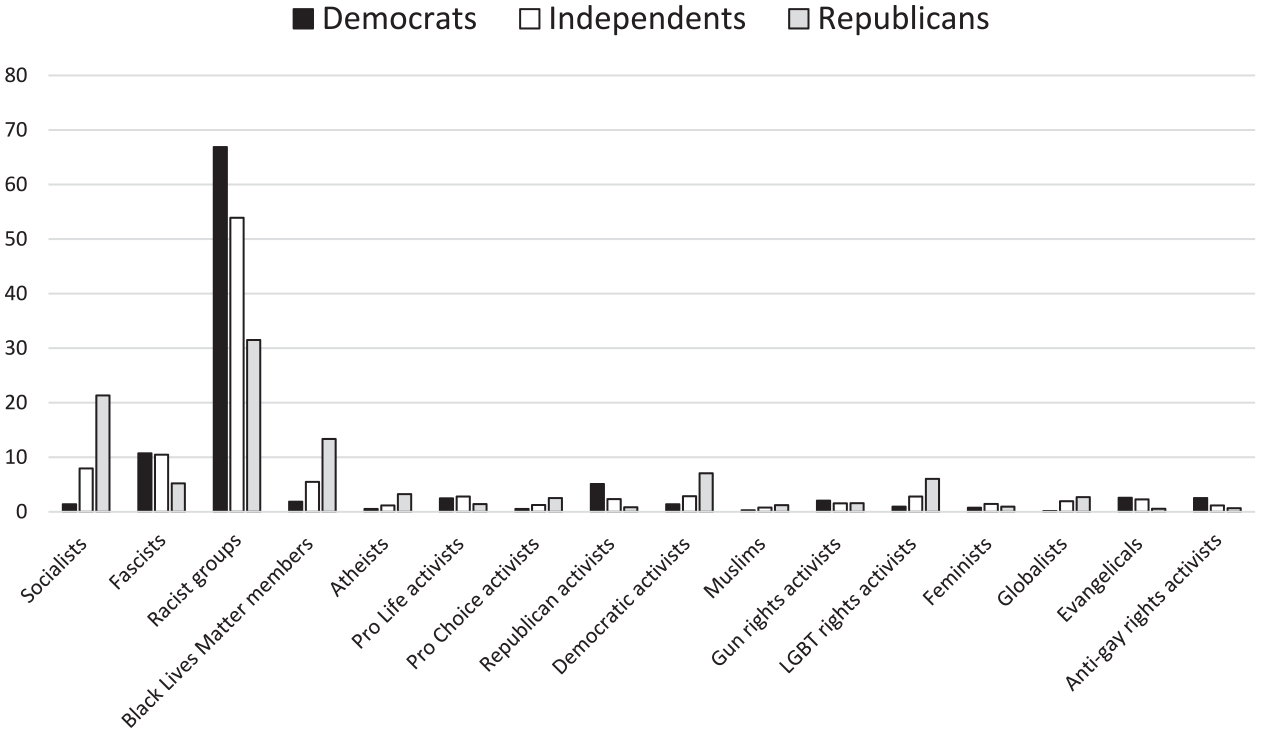
Choice of Least-Liked Groups by Party Identification, October 2022
The percentage of respondents choosing a racist group as their least-liked group varies by wave from a high of 57 percent of the sample in 2021, to a low of 50 percent of the sample in 2022. In October 2022, among Democrats, 65 percent chose a racist group as most disliked. Among Republicans, that same percentage was only 30 percent. Still, that means that only 35 percent of Democrats selected a nonracist disliked group, while 70 percent of Republicans selected a nonracist group for purposes of tolerance measurement. Independents were roughly 50/50 in selecting racist and nonracist groups. The high reliability of the least-liked measure is even more impressive given that the GSS suggests that tolerance measures are generally less reliable when asking about racist groups, and many chose racists of one kind or another. If one looks separately at the latent reliability of tolerance measures for those who did or did not choose racist groups as their least-liked, there was no apparent difference. Reliability for racist groups ranged from .70 to .73. For nonracist groups, latent reliabilities were .69 and .76.
Even though respondents were offered equal numbers of groups on the left and right, the distribution of right-leaning and left-leaning groups chosen was dramatically skewed, with the percentage of the entire sample choosing least-liked groups on the right barely budging from 70 percent in October 2020 to 72 percent in October 2022. And again, latent reliabilities were high regardless of whether right- or left-leaning groups were chosen by respondents.
Unlike the era in which the GSS surveys began—when intolerance was focused on groups on the left, such as communists and atheists—intolerance today is focused on right-wing groups—and especially on racist groups—to a much greater extent than on left-wing groups. This means that responses to the GSS items about racist groups are most representative of tolerance levels in the contemporary U.S. But notably, that is also the battery demonstrating declining tolerance in the GSS. It is unclear how much of the earlier “tolerance” of racists was simply because people did not have especially negative views of racists, as opposed to having an understanding of free speech principles. For the same reason, people’s support for the speech rights of militarists, atheists, and communists is unlikely to represent true tolerance of views they dislike today, since these groups do not concern many contemporary Americans. Herein lies the problem of using any specific controversial groups as a means of tracking change over time in tolerance.
The lack of relevant target groups on the right (other than racists), as well as the lack of currently threatening groups on the left, are both problematic aspects of the GSS approach. The overall increases in tolerance for left-leaning GSS groups could obscure decreases in tolerance for groups on the right. This trend is almost certainly the case for racist speech, but it may also be true for other right-leaning groups.
The least-liked measures are highly reliable because most people know where they stand in the left-right sense of the political world. Most Americans consistently choose a disliked group on the right or the left. Democrats are overwhelming focused on racist groups as least-liked. In short, contemporary Americans at least know whom they dislike.
These asymmetries suggest that change in levels of traditional tolerance measures may be conflated with base rate shifts in Americans’ most-disliked groups. There is currently a much higher base rate for selecting groups on the right, as illustrated in Table 2. Thus, even if we were to compare the average level of Republican GSS respondents’ tolerance of groups on the left with that of Democratic GSS respondents’ tolerance of groups on the right, we would not level the playing field because, at this point in history, more people have animosity toward the right than toward the left. Just as most Americans, regardless of partisanship, were anticommunist in the early studies of political tolerance, today Americans perceive greater threats from right-wing extremist groups than from left-wing groups.
Least-Liked Groups as a Percentage of Respondent Partisanship, October 2022
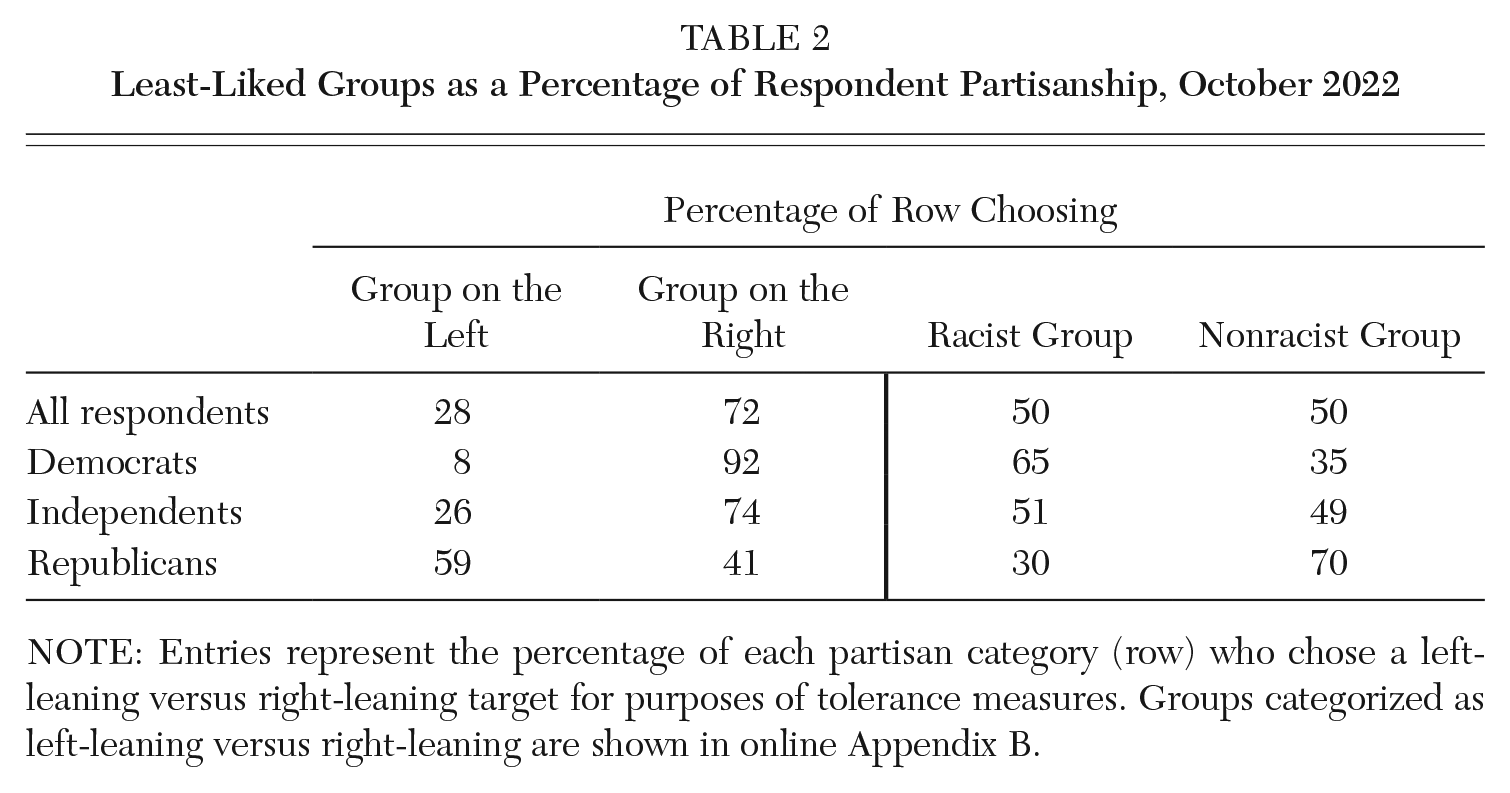
NOTE: Entries represent the percentage of each partisan category (row) who chose a left-leaning versus right-leaning target for purposes of tolerance measures. Groups categorized as left-leaning versus right-leaning are shown in online Appendix B.
Given the surprising nature of these findings, I wondered if the relatively large proportion (32 percent) of Republicans citing some racist group as their least-liked could have occurred because some Republicans meant to suggest reverse racism, that is, that Blacks are now favored at the expense of whites. To investigate the possibility that I was misinterpreting their group selections, I used other items in these same surveys to determine whether respondents perceived discrimination against whites to be greater than perceived discrimination against Blacks (see Appendix A).
Results of this analysis suggest that claims of reverse racism were unlikely to be what was driving Republicans’ selection of racist groups as least-liked. In the most recent panel wave, for example, only 8 percent of the roughly 10 percent of Republicans who selected “racists” as their least-liked group (I exclude those who selected white supremacists or the KKK since anti-Black prejudice is already clear in those groups) also thought that whites were more discriminated against than Blacks. Among those few Republicans who chose “racists” as their least-liked group and perceived greater discrimination against whites than Blacks, most were only one scale point higher in perceived discrimination against whites on a nine-point scale. These small differences were within the range of measurement error. As a percentage of the combined “Racist groups” category, including those who selected racists, the KKK, or white supremacists as least-liked, those with any potential for meaning reverse racism comprised fewer than 1 percent of Republicans—a finding that led me to set aside this concern.
In Figure 2, the mean levels of tolerance are shown by education, party identification, and age, the same as they were analyzed in the Chong, Citrin, and Levy (2022) study. As shown in Figure 2, even as of 2022, the college-educated are consistently higher in tolerance than their less educated counterparts, and this is true in every wave of the panel. However, the partisan comparison suggests that Democrats were less supportive of their disliked groups’ rights to free expression than were Republicans. This large significant difference was present across all panel waves. It is not entirely consistent with the GSS because it suggests that the impact of partisanship on tolerance has flipped such that Republicans are more tolerant than Democrats across the board. Age made the least difference to average tolerance levels, but older Americans were more likely to uphold the rights of their disliked groups than were younger people (see Appendix C), consistent with the 2018 GSS findings on tolerance of racist groups.
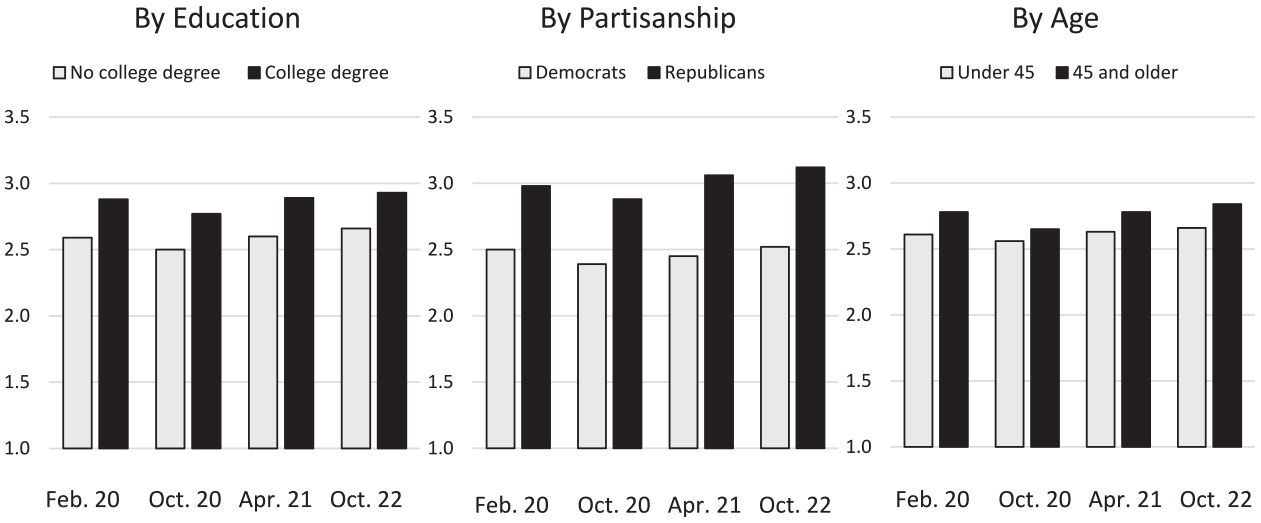
Tolerance by Characteristics of Realignment, 2020 to 2022
As noted, the bivariate comparisons may be influenced by the interrelationships among these three demographic characteristics. To disentangle these relationships, I analyzed a series of regression models restricted to just these three demographic realignment variables. My goal was to examine whether the singularity of tolerance of racist speech noted by Chong, Citrin, and Levy (2022) also stands out using the least-liked group technique. Since the inclusion of still more independent variables could muddy the waters by producing model-specification effects, I restrict the multivariate analyses to just those three predictors.
Tolerance of racist versus nonracist target groups
Hypothesis 1a predicts that having a college education will negatively predict tolerance of racist groups but positively predict tolerance of non-racist groups. Surprisingly, as shown in Figure 3, a college education is a significant positive predictor of tolerance of both nonracist least-liked groups and of racist groups. Further, the magnitude of the college coefficient is roughly the same for those who chose disliked racist and nonracist groups. This evidence contradicts Hypothesis 1a; education remains a positive predictor of tolerance across all kinds of groups.
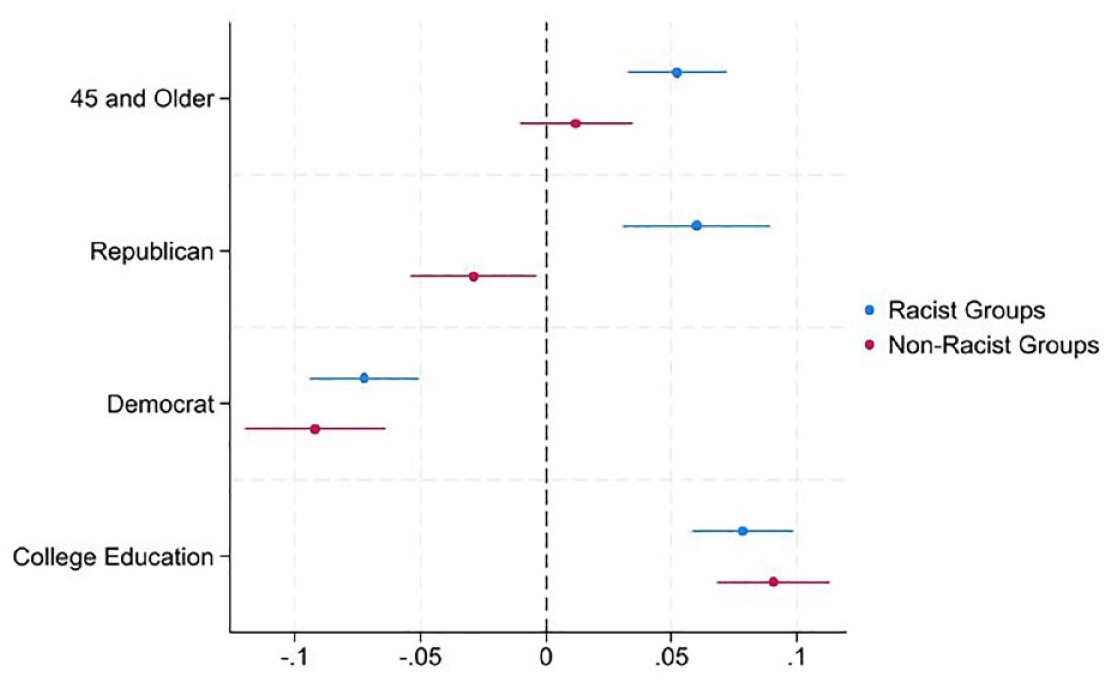
Age, Education, and Partisanship as Predictors of Tolerance, by Racist and Nonracist Target Groups
Hypothesis 1b predicts that older people will be more tolerant of racist speech than will younger people, even though these are older people who chose racists as their least-liked group. This hypothesis is confirmed in Figure 3. However, among those who chose nonracist groups, age had no effects on tolerance in either direction, thus rejecting the idea that younger generations are more tolerant of nonracist groups. These findings are consistent with the idea that socialization is leading younger Americans to be unwilling to extend free speech rights to racists. But they do not confirm that younger people have greater tolerance of nonracist groups, thus offering mixed support for Hypothesis 1b. Instead, the reluctance to allow disfavored speech may be seeping into tolerance of all groups.
As also shown in Figure 3, results are roughly consistent with the realignment idea in that Democrats are consistently less tolerant of racist groups, as suggested by Hypothesis 1c. But surprisingly, Democrats are also significantly less tolerant of nonracist target groups than are Independents. This pattern suggests that intolerance on the left goes beyond finding racist speech unacceptable. Whether a respondent chose a racist or nonracist least-liked group, the coefficients for identifying as a Democrat are similarly negative and statistically significant, countering the expectation. Republican partisanship predicts greater tolerance of racist speech relative to Independents, but Republicans are significantly less tolerant than are Independents of the speech of nonracist disliked groups. This evidence suggests a potential “spillover” effect; once exceptions are made for one group, it becomes easier to make exceptions for others. Thus, Hypotheses 1c is only partly confirmed. Results are inconsistent with the thesis that tolerance of racist groups is fundamentally different from that of nonracist groups, because we see the same pattern for Democrats in tolerance of racist and nonracist groups. But the negative impact of partisanship is generally smaller for Republicans than for Democrats.
Overall, partisanship appears to lower tolerance. Identifying with either party results in less support for nonracist free expression relative to being an Independent. Only political Independents seem immune from wanting to censor others’ views, consistent with what one sees playing out in the partisan political arena. Independents are essentially Switzerland, refusing to take sides. The problem this situation poses is quite serious because the U.S. lacks any elite party leadership encouraging greater tolerance. Since American politics consists almost entirely of Republican and Democratic leaders who are covered heavily by the press, there is no group championing the principle of free speech, no one serving as carriers of the creed. Nor is there evidence that intolerance of racist groups is an isolated exception to tolerance more generally.
Tolerance of left-leaning versus right-leaning target groups
To test the remaining hypotheses, I conducted similar analyses evaluating differences in how these three demographics predict tolerance for left-leaning and right-leaning target groups, as well as right-leaning target groups excluding racist groups. Figure 4 only partially confirms Hypothesis 2a. Democrats are indeed less tolerant of right-leaning groups than are Independents, but Republicans are not less tolerant of left-leaning groups than Independents are. In fact, the size of the two coefficients for Republicans and Democrats is more or less identical for left-leaning groups.
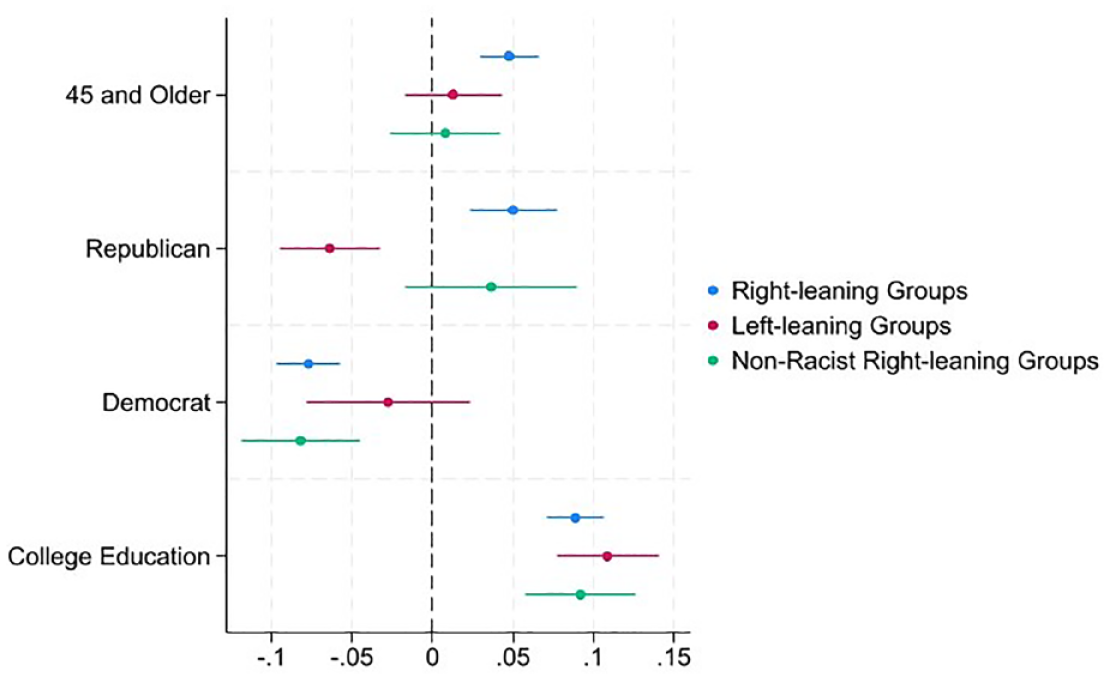
Age, Education, and Partisanship as Predictors of Tolerance, by Left-Leaning, Right-Leaning, and Right-Leaning Nonracist Target Groups
Hypothesis 2b, that partisan patterns of tolerance for right-leaning groups will look quite different if one excludes racist groups from other right-wing groups, is also tested in Figure 4. Contrary to this prediction, the two partisan-identification variables predict tolerance for right-leaning groups and for right-leaning groups excluding racists to the same extent. Democratic identification predicts negatively in both cases, but Republican identification predicts greater tolerance for right-leaning groups overall. There is again, no evidence that racist groups are being singled out for differential treatment. Likewise, the test of Hypothesis 2c, that if we set aside racist groups, being a Democrat will predict greater tolerance of nonracist, right-leaning groups to a stronger extent than being a Republican predicts tolerance of left-leaning groups is not borne out in Figure 4. The coefficients for right-leaning groups and nonracist, right-leaning groups are both negative and significant, and they are statistically indistinguishable.
Finally, as shown in Figure 4, a college education positively predicts tolerance regardless of the type of target group chosen, right or left, racist or nonracist. This contradicts Hypothesis 2d, which suggests that a college education should positively predict tolerance strictly for nonracist speech. As shown in Figures 3 and 4, education is the most consistently positive influence on tolerance levels, regardless of the type of speech people dislike.
Discussion
To summarize, intolerance is now driven primarily by partisans, younger people, and those without college degrees. Importantly, support for censorship of disliked views has emerged from both sides of the political spectrum, thus making it especially difficult to protect through political leadership. To the extent that leaders of the two parties are now actively promoting censorship of oppositional views, their rank-and-file partisans appear to be following suit.
It may be unrealistic to expect the general public to embrace abstract norms based on the Holmesian ideal of a “marketplace of ideas.” 6 But even if low tolerance for the expression of disliked views persists, it remains worthwhile to know which groups are the greatest potential targets of intolerance at any given point in time, as well as which segments of the population are least cognizant of this democratic norm. Left-leaning groups were once the major target of efforts to constrain Americans’ rights to free speech. But they are not the major targets of intolerance now. Today, right-leaning groups, and racist groups in particular, are the most popular targets.
This observation is somewhat ironic because freedom of expression has long been recognized as a useful means of improving minority groups’ status. In a famous speech in Boston, Frederick Douglass called free speech “the great moral renovator of society and government.” He viewed freedom of expression as a tool to update and improve society rather than one that would suppress minority voices. Such rhetoric makes freedom of expression sound entirely consistent with increased racial equality. When drawing on a wide range of groups on both the left and right using least-liked tolerance measures, racist speech does not appear to be an isolated case. Republicans tend to be more tolerant of racist speech and less tolerant of speech from leftist groups, as one might expect. But Democrats today tend to be less tolerant of all kinds of speech they dislike, whether racist or not. This finding suggests a broader basis for opposition to free speech rights than previously supposed.
Conclusions
Implications for measurement
It is doubtful that survey questions asking about the speech of any specific controversial groups could adequately represent the concept of “tolerance” as support for the right to express views that one personally dislikes. Especially if the goal is to track levels of (in)tolerance over time, the measurement technique would need to be flexible enough to accommodate the waxing and waning of threats posed by various groups, some of which have yet to be conceived.
The analyses presented here suggest that the least-liked group technique, perhaps combined with filtering for violent groups, holds some promise toward this end for several reasons. First, it is surprisingly reliable using the most stringent assessment technique possible. Reliabilities are equal to or better than the much longer and more time-intensive GSS question batteries. Second, in terms of face validity, it allows the groups that are selected by respondents to change, without diminishing the reliability of the latent construct. It is difficult to argue that support for the speech rights of those who advocate military rule in the U.S. is a relevant indicator of tolerance today. But when individuals select the group they dislike most, the measure acquires greater face validity as an indicator of tolerance for the expression of views that the respondent truly disapproves of.
In addition, the specific questions asked with respect to each disliked group do not appear to make much difference. As indicated by the Cronbach’s alphas in this study, there is a great deal of internal consistency across questions, regardless of whether one asks about restricting a group’s right to hold a public rally or the rights of government to monitor the group’s social media accounts. New forms of political intolerance correlate well with the traditional ones.
For future study, political scientists should make it a priority to develop a reliable way of tracking political tolerance over time, one that does not depend on the exact same groups. While the GSS measures are useful for their long-term, repeated use, they do not allow for variation over time in targets of intolerance; nor do they easily distinguish support based on political agreement versus support based on a defense of the speech rights of those with whom one personally disagrees.
The least-liked approach has several advantages. For one, it requires only six to seven questions and thus requires far less survey time than do the 15 to 20 items included in the GSS battery. As a result, it may be a more practical way to track important attitudes toward this important democratic norm on repeated surveys such as the ANES.
Nonetheless, two further refinements are advisable. First, it would be important to ensure that respondents are separating speech from violence or incitement to violence. As a democratic norm, tolerance does not imply the right to incite or engage in violent acts. Respondents should be asked about speech rights that make it clear the person is not condoning or committing violence. Second, to ensure they are currently relevant, it would be important to identify a systematic means of selecting the list of 18 to 20 target groups that are offered. This could be accomplished in the ANES pilot studies using open-ended questions, by pilot-testing potentially relevant disliked groups, or by selecting them based on existing feeling thermometer ratings that ask about controversial groups. In these surveys gathered from 2020 through 2022, I suspect that George Floyd’s murder, Black Lives Matter, and the January 6, 2021, insurrection and its association with violent racist groups are all important reasons that so many respondents chose racists as their least-liked group during this period of time.
Implications for upholding democratic norms
The least-liked group measures do not tell the same story as the GSS measures. They confirm some previous observations regarding realignment—for example, older Americans are, indeed, now more supportive of free speech rights for racist and right-leaning groups than are younger people. However, the narrowing gap that Chong, Citrin, and Levy (2022) observed between liberals and conservatives was not much in evidence as of 2022, at least not when identifying partisan groups. Republican and Democratic partisans espoused radically different patterns of tolerance, with each side more intolerant of groups on the other side, and Independents as the most tolerant (non)partisan group. Democrats were especially intolerant of groups on the right and Republicans especially intolerant of groups on the left. Each Republican coefficient in Figures 3 and 4 differs significantly from the corresponding Democratic coefficient. When partisanship significantly predicts tolerance, it does so in a negative direction, with the sole exception being the extent to which Republicans tolerate right-leaning and racist groups.
This pattern of results is especially ominous when one considers the “carriers of the creed.” If neither Republican nor Democratic politicians are willing to uphold democratic norms, then there will be few prominent elites visible to model this ideal for the American public. Rather than providing a safe environment for democratic norms, pluralistic intolerance—in the form of Democrats being intolerant of the right and Republicans intolerant of the left—is precisely the problem. Pluralistic intolerance leaves no visible or credible spokespeople for supporting this democratic norm.
In our current political climate, the speech of racist groups is especially poorly tolerated, just as the GSS results demonstrate. However, intolerance of racist groups is less salient in its alignment with age, partisanship, and education than previous work suggests. A college education still strongly predicts greater tolerance, regardless of whether a person’s most-disliked group is left- or right-leaning, racist or nonracist, and even after controlling for the effects of age.
Whether racist speech should or should not constitute a legitimate exception is itself controversial and beyond the scope of this article. But embedded in this idea is the assumption that if negative speech about a group were, in fact, restrained, that group would achieve greater equality in American society. In other words, it implies that by eliminating public speech that demeans certain groups, society can change people’s views of those groups, thus creating a more egalitarian country.
But it is important to consider an alternative consequence. Eliminating racist speech could make environments appear safer for minorities without actually changing anyone’s opinions. I am unaware of empirical evidence bearing on this question, but some of the theories underlying why free expression is a democratic norm predict this opposite outcome. For example, some argue that free speech operates as a safety valve allowing opposing groups to let off steam, whereas censorship will cause disagreement to fester in ways that foment violence and revolution (Emerson 1970). Still others suggest that restraining speech to protect vulnerable groups infantilizes minorities in the eyes of others, thus doing them more harm than good (e.g., McWhorter 2021).
Whether one believes that racist groups are an appropriate exception to speech norms or not, for those who value racial equality a great deal, this goal may seem more important than allowing racist speech as a matter of principle. At times Chong, Citrin, and Levy (2022) suggest that the tolerance realignment is about identity groups more generally, and not just about racists, although they lack data to address this possibility (Chong, Citrin, and Levy 2022; Chong and Levy 2018). Another problem with this distinction is that one could make the same identity group argument for sexist speech, antisemitic speech, anti-Muslim speech, and so forth. The contemporary U.S. is riven with identity politics, making it difficult to determine what does not qualify as an “identity group.” For example, some argue that issue-based groups are identity groups (e.g., Lacombe 2019; Lacombe, Howat, and Rothschild 2019). Partisanship is now considered to be an important social identity as well (Huddy and Bankert 2017). A distinction could instead be based on whether a group has been historically marginalized. But even then, it would be difficult to decide which groups should qualify and whether doing so would, in the end, encourage greater equality.
A second major point is also worth noting. The least-liked group method of measuring tolerance produces empirical evidence inconsistent with the idea that intolerance of racist groups is distinct from intolerance in general. When respondents are allowed to select other right-leaning groups they dislike, racist groups and right-leaning groups that are not racist show virtually indistinguishable patterns with respect to age and education. With respect to partisanship, findings differ strictly for Republicans, who are more likely to tolerate disliked racist than nonracist speech.
The most positive news in this evidence is that higher education remains a very robust positive predictor of tolerance, regardless of whether respondents dislike racists, nonracist groups, or left- or right-leaning groups. This is reassuring in the wake of fears that higher education encourages exceptions to free speech of many kinds. 7 But younger people who are more recently college-educated, and Democrats who make exceptions to support for free expression, may be subject to “spillover effects,” where their exceptions go beyond constraining racist speech alone.
Supplemental Material
sj-docx-1-ann-10.1177_00027162241231129 – Supplemental material for Freedom of Speech in the Post-Floyd Era: Public Support for Political Tolerance
Supplemental material, sj-docx-1-ann-10.1177_00027162241231129 for Freedom of Speech in the Post-Floyd Era: Public Support for Political Tolerance by Diana C. Mutz in The ANNALS of the American Academy of Political and Social Science
Footnotes
Supplemental Material
Supplemental material for this article is available online.
Note:
The author is grateful to Matthew Hall, Robin Pemantle, and Mabel Berezin for their suggestions for improving this study.
Notes
Diana C. Mutz holds the Samuel A. Stouffer Chair in Political Science and Communication at the University of Pennsylvania, where she also serves as director of the Institute for the Study of Citizens and Politics. She has been honored with a Guggenheim Fellowship and a Carnegie Foundation Fellowship and was elected to the National Academy of Sciences.
References
Supplementary Material
Please find the following supplemental material available below.
For Open Access articles published under a Creative Commons License, all supplemental material carries the same license as the article it is associated with.
For non-Open Access articles published, all supplemental material carries a non-exclusive license, and permission requests for re-use of supplemental material or any part of supplemental material shall be sent directly to the copyright owner as specified in the copyright notice associated with the article.