
Abstract
What does it mean to be working class in a society of extreme racial wealth inequality? Using data from the Survey of Consumer Finances, we investigate the wealth holdings of Black, Latinx, and white working-class households during the post–Great Recession (pre–COVID-19) period that spanned 2010 to 2019. We then explore the relationship between working-class and middle-class attainment using a wealth-based metric. We find that, in terms of their net worth, fewer Black working-class households benefitted from the economic recovery than white working-class households. Among white households, the working class saw the greatest increase in wealth in both absolute and relative terms. Working-class households were less likely to be middle class as defined by their wealth holdings, and Black and Latinx households were also less likely to be middle class. For Black households, racial identity is a stronger predictor of wealth attainment than occupational sector.
Racial wealth inequality in the United States is massive, persistent, and well documented. In the immediate years postrecession, Black-white wealth disparities widened; and five years later, Black households held one-tenth the net worth of white households (Dettling et al. 2017). As the labor and housing markets recovered after experiencing record rates of unemployment and foreclosures, returns from the rising economy were not shared equally across U.S. households (McKernan et al. 2014; Compton, Giedeman, and Muller 2018). Building upon these studies that showed disparate wealth holdings by race and ethnicity but focused on the lag of the recession, we use data from the Survey of Consumer Finances (SCF) to investigate the financial status of households headed by Black, white, and Latinx adults tied to the labor market in the period of post–Great Recession economic growth between 2010 and 2019, capturing the entire recovery period. We categorize the working-class population based on their attachment to the labor market and in relation to the means of production. We bridge literatures on class and status attainment through the lens of stratification economics (Darity 2005; Darity et al. 2017), a newer subfield in economics that focuses on the relationship between intergroup inequality, group identity, and relative group position. We are able to highlight the persistence of fundamental economic inequality during the longest period of economic growth in modern America. Wealth and wealth inequality measures have become increasingly important for understanding the economic lives of Americans and, in particular, economic disparities across racial groups. The increasing role of consumer and education debt in American households, with a diminished role for the social safety net, has meant greater reliance on and increased importance of private charitable contributions.
Recently, Darity, Addo, and Smith (2020) made the case for a wealth-based definition of middle-class status to capture, more accurately, the subaltern status of Black Americans, a comparatively privileged subgroup within a larger marginalized one. This is important because wealth in the United States can be transformative. It serves both as a means of social mobility and solidification of social, political, and economic status. In contrast, Black households’ cumulative, intergenerational inability to acquire wealth continues to contribute to their sedimentation at the bottom of the socioeconomic distribution (Oliver and Shapiro 2006). While a different set of historical processes led to their current status, the statistics on wealth disparities between Latinx and (non-Latinx) white households are remarkably similar to those between (non-Latinx) Black and white households.
We are also interested in unpacking how the relationship between working-class status and net worth changed during this recovery period. We document wealth holdings of households classified as working class within Black, white, and Latinx populations after the Great Recession, including an assessment of their asset and debt profiles. In addition to providing an overall accounting of changes in working-class households’ financial balance sheet in the years postrecession, we are also interested in the degree of financial precarity that these households experienced. We accomplish this by exploring the relationship between a wealth-based threshold of “middle-class” attainment and working-class status over the same period. In the final section, we examine the potential for overlap among the two groups, and whether the patterns differ by race and ethnicity.
The Great Recession, Race, and Wealth Inequality
In the years immediately following the Great Recession, a proliferation of studies examined changes in wealth holdings before and after the downturn and examined the impact of the downturn on the degree of racial and ethnic wealth inequality. Black and Latinx households lost a greater percentage of their wealth, 48 and 44 percent respectively, than white households, who lost 26 percent (McKernan et al. 2014). Uneven recoveries from the recession translated into median and average wealth disparities that continued to widen postrecession.
By 2016, the Black-white wealth differentials were larger than pre–Great Recession estimates (Weller and Hanks 2018). White households displayed an ability to recover more quickly (Compton, Giedeman, and Muller 2018). The intersection of labor force attachment and wealth is especially important when analyzing racialized trends in recovery rates during postrecessionary periods (Compton, Giedeman, and Muller 2018). Pfeffer, Danziger, and Schoeni (2013) found that households that experienced unemployment had the largest proportionate losses in wealth. During the recession, the Black unemployment rate peaked at 21.2 percent, the Latinx rate reached 15 percent, and the white rate peaked at 10.6 percent (Kochhar 2020 ).
Separating the differential contributions of specific assets and debts is also necessary for understanding the postrecession recovery. Racial wealth inequality is driven more strongly by Black-white differences in assets rather than liabilities. For example, lower levels of liquid savings and income mean tapping into long-term savings vehicles when experiencing negative economic shocks. This helps to explain the larger decline in retirement assets among Black households during the Great Recession (McKernan et al. 2013).
Prior to the recession, homeownership rates for Blacks were 48 percent, up from 43 percent a decade earlier (Taylor et al. 2011), while Latino rates surpassed 45 percent (U.S. Department of Housing and Urban Development [HUD] 2000), the highest levels on record. Among households who own their homes, homeownership constitutes a larger share of their wealth portfolio for Black households. Generally, homeownership accounts for a greater share of the racial wealth gap as we move toward the lower end of the wealth distribution (Maroto 2016).
Discriminatory practices that created barriers to home buying translate into Black households having shorter tenures in homeownership. Persistent residential segregation has lowered growth in home equity for Black households. From the late 1990s to the peak of the housing boom in the mid-2000s, research indicates that Black and Latino households were more likely to lose their homes, involuntarily, due to foreclosure (Sharp and Hall 2014).
In addition, they were more likely to receive subprime loans, even if they qualified for loans with lower interest rates and better terms. Evidence exists that lenders were less likely to offer Black applicants lower-priced loans even if they qualified (Bocian, Ernst, and Li 2008; Faber 2013).
As the recession receded, the net worth of white households rose to thirteen times the level of the median wealth of Black households, up from eight times before the downturn (Leigh and Huff 2007). A significant portion of this trend was a direct result of rapid declines in home equity; indeed, Black households experienced greater declines in home equity postrecession (Burd-Sharps and Rasch 2015).
Metropolitan statistical areas (MSAs) with larger concentrations of Black and Hispanic households experienced higher rates of foreclosure (Rugh and Massey 2010). Black and Latinx homeownership rates dropped disproportionately in comparison with the decline in white rates. Moreover, Black homeowners continued to experience wealth losses in the years postrecession, 2009 to 2011 (Burd-Sharps and Rasch 2015; Tippett et al. 2014).
The composition of debt portfolios also differs by race and class status. Credit market discrimination and related barriers to borrowing historically contributed to Black households having lower levels of outstanding debt than white households (Ards and Myers 2001; Ards et al. 2015). These adverse conditions have also meant that white households with wealth are more likely to hold “good” debt—liabilities tied to creating more wealth, including mortgages or small business loans.
Low-wealth populations and members of marginalized communities are more likely to hold “bad debts”—liabilities often tied to exploitative and extractive lending systems, including penal fines and fees and payday loans. Recently, Seamster (2019) outlined the racialized nature of debt holdings given differential treatment of debtors in the United States by race.
One striking trend during this period was the rise of student debt. As more people enrolled in higher education, aggregate student debt, which surpassed $1.7 trillion by the end of 2019 and rose continuously through the Great Recession and the years afterward, composed a larger share of Black financial portfolios and increased disproportionately for Black households (Seamster and Charron-Chénier 2017). The growth of student debt and growing Black-white disparities in magnitude and repayment rates (Addo, Houle, and Simon 2016; Houle and Addo 2019; Scott-Clayton 2018), during this period, shed light on the perpetuation of wealth inequality on both sides of the household balance sheet.
At the intersections of race, working-class status, and wealth inequality
After the official end of the Great Recession in July 2009, the United States experienced its longest economic expansion on record (Center on Budget and Policy Priorities 2020). But who benefitted from the recovery? While much of the literature on economic inequality focused on growing racial wealth disparities, increasing concentration of wealth (e.g., the 1 percent), and the condition of the “middle class,” there was little systematic discussion of the condition of the working class. This is not new.
Social welfare policies and safety net programs have focused on the poorest households. Yet many households may not qualify for such support and remain economically fragile. These circumstances combined with labor market stagnation of the working class have been cited for driving political resentment during the 2016 election (Williams 2016) and, among white Americans, their belief that they were falling before Black people (Jardina 2019).
Horton et al. (2000) identified a need for more sociological work on race and class to examine the working-class population, given the predominance of studies on middle-class attainment and poverty. Conventionally, sociologists have drawn upon a definition of social class that combines both occupation and income to classify individuals and use this definition to delineate three distinct class categories: bottom, working, and middle (and upper). This approach is best captured by attempts to identify the Black middle class, most notably, via Frazier’s (1957) and Wilson’s (1978) occupational status–centered criteria.
More recently, Oliver and Shapiro’s (2006) definition of black middle-class status, inclusive of educational attainment, income, and asset ownership, raised awareness of the low-wealth position of Black households. We believe the incorporation of wealth is important and necessary for capturing the extent of inequality within U.S. society and for understanding why it persists. This article builds on research that centers wealth as a defining feature of racial inequality in the United States.
We use an occupation-based definition to delineate the working class. The working class, in our study, consists of “productive labor,” in the Marxist sense (Darity 2019), persons who are neither business owners nor hired managers. Productive laborers are persons whose hired employment directly contributes to the generation of profit.
In contrast, we identify the professional managerial class as “unproductive labor,” again in the Marxist sense. Here we list business owners and hired managers as well as the general run of persons whose employment does not directly contribute to the generation of profits. This includes university faculty and administrators, civil servants, and artists and entertainers. Unproductive does not mean unnecessary, but it does mean that these individuals are not actively engaged in generating the social surplus. In fact, they are maintained out of the social surplus.
Our definition of class position relies solely on one’s relationship to work and the labor market, in contrast to more common empirical treatments of class status that tend to join occupation and income (see Frazier 1957). We hypothesize that not only will the working class have lower wealth than professional managerial class households, but also the source of their wealth is more strictly dependent on savings out of personal income, rather than intergenerational transmission of resources. We speculate that due to cross-generational wealth inequality, persons in professional-class occupations may have significantly greater access to parental and grandparental wealth. In turn, racialized differences in social mobility and parental and grandparental wealth will lead to disparities within social class strata based upon race and ethnicity.
Data and Measures
We draw data from the 2010, 2013, 2016, and 2019 SCF, the four surveys available since the official end of the recession in June 2009. These surveys all were conducted prior to the onset of the novel coronavirus crisis. Sponsored by the Federal Reserve Board, the SCF is designed to gather information on the financial characteristics of U.S. households.
The SCF uses a dual sample framework that includes a standard multistage area probability sampling and a supplementary sample of high-net-worth families selected from tax return data. Therefore, the SCF is more representative of the wealth distribution in the United States compared with other surveys, like the Panel Study of Income Dynamics (PSID), which use standard probability sampling methods.
Another advantage of the SCF is the handling of missing values. The SCF employs multiple imputation methods on five separate versions of the dataset (Wright 1979). Survey analysis weights provided by the SCF account for the dual sample frame. We draw all financial variables from a merged file of the full public data and the summary extract file.
Our analytic sample consists of survey respondents between the ages of 25 and 64, who were not retired, disabled, or out of the labor force. These are prime years for wealth building and wealth accumulation. The earliest phase of these years, young adulthood, is also the period when a relatively compressed pattern of wealth begins to diverge by race and ethnicity (Zumbrun 2015). Financial values for the 2010, 2013, and 2016 waves have been adjusted for inflation and are reported in 2019 dollars using the Consumer Price Index CPI-R-US. We conducted all analyses in Stata using the svy commands.
Net worth, measured at the household level, is the difference between total assets and total debts. Total assets are the summation of financial and nonfinancial assets and total debts include both secured and unsecured. For the SCF, we use the created wealth variable provided as part of the summary extract files. The SCF does not collect information on future Social Security benefits and employer-sponsored defined pension plans (Bricker et al. 2017).
We use the SCF created macro variables for classifying work status and the occupational classification of the household head. Two criteria must be met. The respondent must have indicated that, first, they were employed by someone else; and second, they did not hold a managerial or professional occupation. The non–professional occupational category is quite large. Two primary occupational groups are designated by the SCF: first, technical/sales/services; and second, production/craft/repair workers, operators, laborers, farmers, foresters, fishers, and more.
For the purposes of the current analysis, we choose not to change these groupings. Non-working-class-headed households consist of persons who specified that they work for someone else and held a managerial or professional occupation or that they work for themselves in a managerial/professional position. Self-employed individuals who did not hold a managerial/professional position were grouped with the working-class group. Our chosen definition for operationalizing the working class is intentional insofar as we are interested in distinguishing one’s attachment to the labor market and social position based on one’s occupational category.
The three main racial and ethnic categories include non-Latinx Black, non-Latinx white, and Latinx. There is a multiple race or other race category included in the publicly available dataset, which we do not include in the descriptive tables, given ambiguity about who is represented. However, we include all respondents in the regression analyses.
If total household net worth is less than three months of the income poverty threshold (50 percent of median income), a household is characterized as wealth poor.
Results
Composition of working-class population by race and ethnicity: Between 2010 and 2019
As the economy recovered, labor force participation of Black workers improved but lagged behind white and Latinx households. As reported in Table 1, the labor force participation of Black workers increased, up 7 percentage points from 2010 and reaching a peak of 80.5 percent by 2019. The gains for white and Latinx workers were more modest, 2.5 and 0.93 percent, respectively. Although working-class households compose the majority of households, the shares differ within race.
Among white households, the overall percentages of working-class households were lower, ranging from 52 to 53 percent; higher for Black workers (59–68 percent); and highest among Latinx households (78–79 percent). For all three racial and ethnic groups, the share of working-class households declined between 2010 and 2019, with the largest drop among Black households (4.8 percent) and less than a 1 percent change within the Latinx and white populations (see Table 1).
Share of Working-Class, Professional-Class Populations, by Race and Ethnicity, 2010–2019
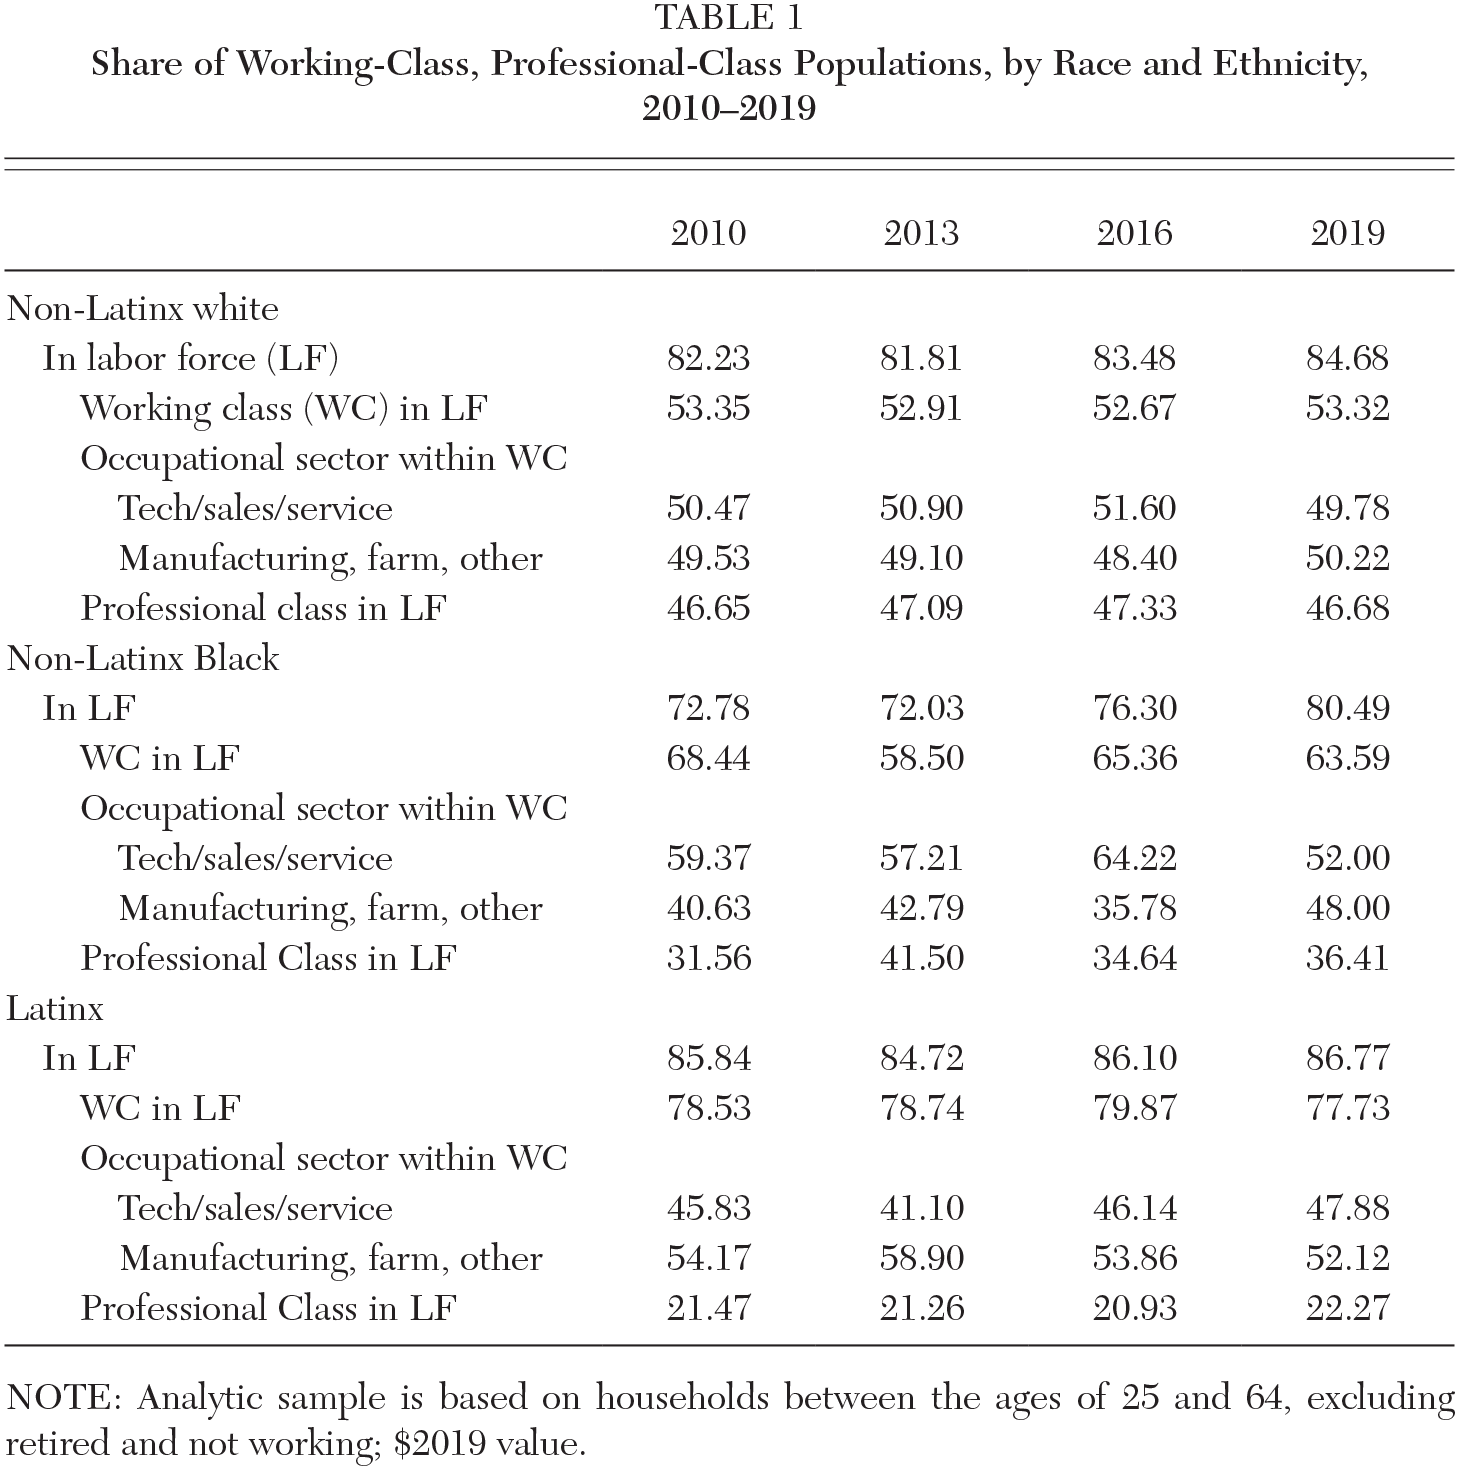
NOTE: Analytic sample is based on households between the ages of 25 and 64, excluding retired and not working; $2019 value.
Both the composition and shift in worker employment by occupational sector vary by race and ethnicity, reflecting the racialized nature of occupational sorting within the labor force. Within the working class, white workers are divided evenly between the technical/sales/service positions and the other categories; Latinx workers are more heavily concentrated in the other category, while Black workers report that they are more likely to hold technical/sales/service jobs.
By 2019, declines in the proportion of working-class households among the Black population are reflected in fewer workers holding technical/sales/service positions. This contrasts with Latinx workers whose absolute numbers employed in technical/sales/service jobs increased, although the share of the working-class population increased with a falling share of the Latinx professional/managerial class.
Net worth and the distribution of assets and debts of working-class and professional-class households, by race and ethnicity
As the economy rebounded, both working- and non-working-class households increased their median net worth, as reported in Table 2. The median net worth of all working-class households increased $20,243, or 40.68 percent, over the 10-year period postrecession. The median net worth of professional-class households increased 16.2 percent, an absolute gain of $31,000. However, disaggregation by race and ethnicity exposes persistent disparities. The median net worth of white households, working and non-working class, consistently was higher than the median net worth of Black and Latinx households. It was also the case that white working-class household wealth was higher than Black and Latinx non-working-class household wealth in every survey year. White working-class households also displayed the largest absolute change in net worth, an increase of $37,154.
By 2019, white working-class households had almost three times the median wealth of Black non-working-class households and close to six times the wealth of Black working-class households (see Table 2). However, relative differences in Latinx and white wealth were slightly lower, since the wealth of Latinx working-class and professional-class households steadily improved over the period, both groups experienced the largest proportionate growth.
Net Worth and Nonhousing Net Worth by Working Class Status, 2010–2019
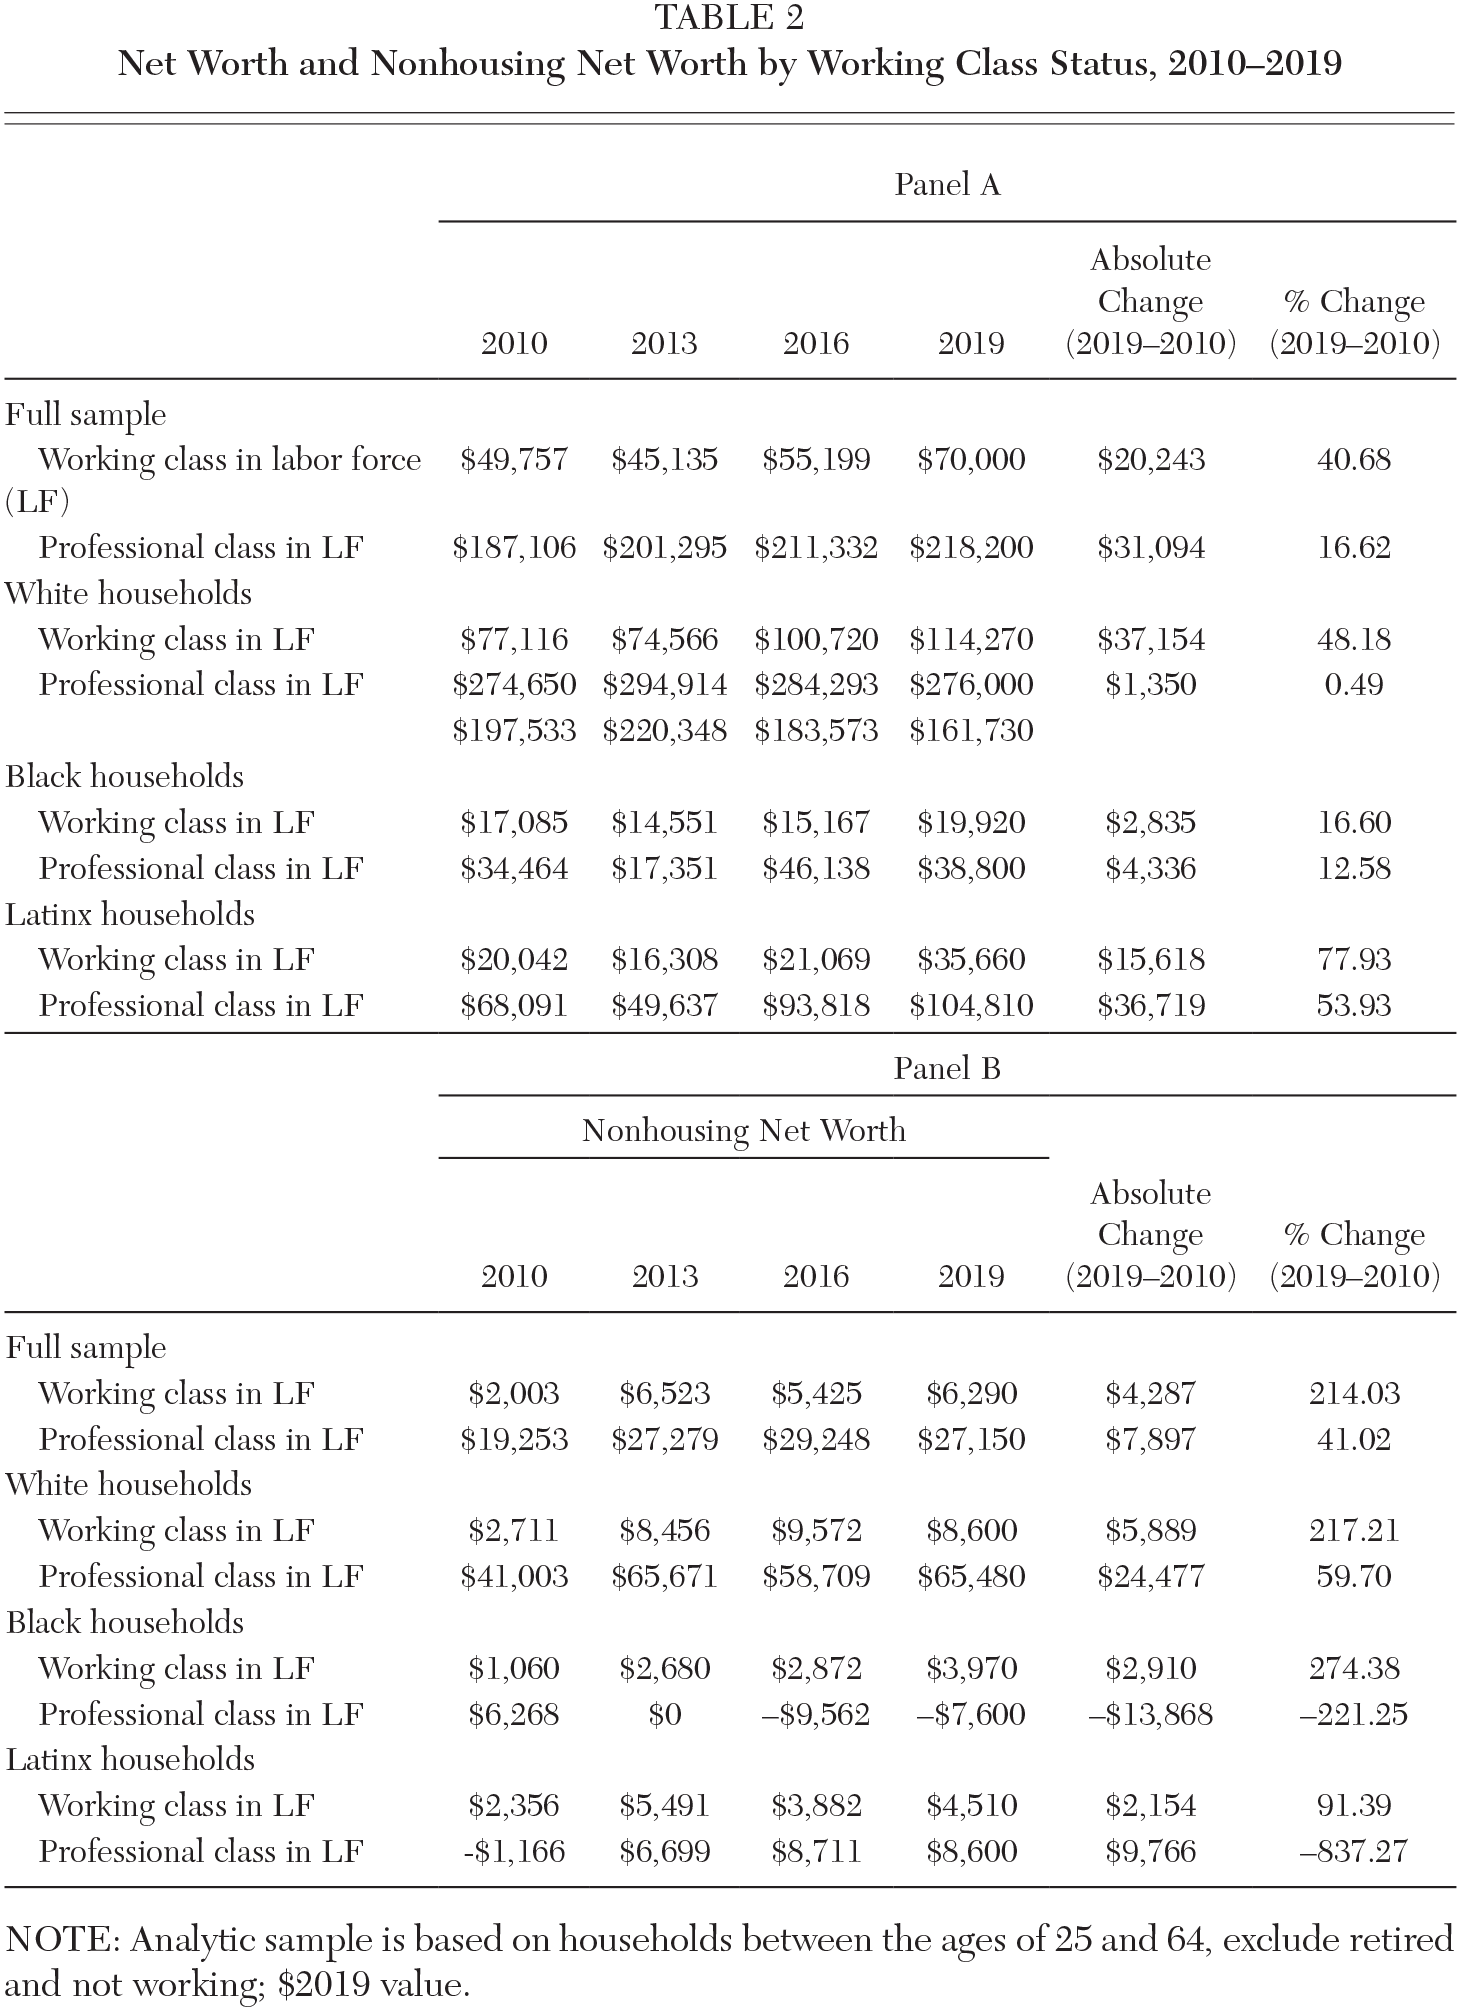
NOTE: Analytic sample is based on households between the ages of 25 and 64, exclude retired and not working; $2019 value.
White professional-class households have 2.5 to 3 times the median net worth of their working-class counterparts. The wealth gap declined as working-class wealth grew to more than $100,000 by 2019, an increase of 48.2 percent since 2010. For Black and Latinx households, working-class net worth also increased proportionately more than among their non-working-class counterparts, 16.6 percent versus 12.6 percent, and 78 percent versus 54 percent, respectively. By 2019, Latinx professional-class households had an average median net worth of $104,800, the only non-white group, working class or professional, to surpass $100,000.
Next, we discuss characteristics of the wealth portfolios (see Table 3). Overall, much more volatility of asset and debt holdings occurred than changes in their value across the period. The most commonly held assets have the lowest median values, including liquid assets and car ownership; meanwhile, housing properties and debts related to housing and residential properties maintained the highest median values, with housing value peaking in 2019. Table 3 lists the changes in the wealth portfolios of white, Black, and Latinx households by class status between 2010 and 2019. Table 3 contains both the percentage change in proportion of an asset or debt category held and the percentage change in median value of that asset or debt conditional on being greater than zero. We highlight two striking results related to homeownership and education debt.
Shifts in the Composition of the Wealth Portfolios between 2010 and 2019
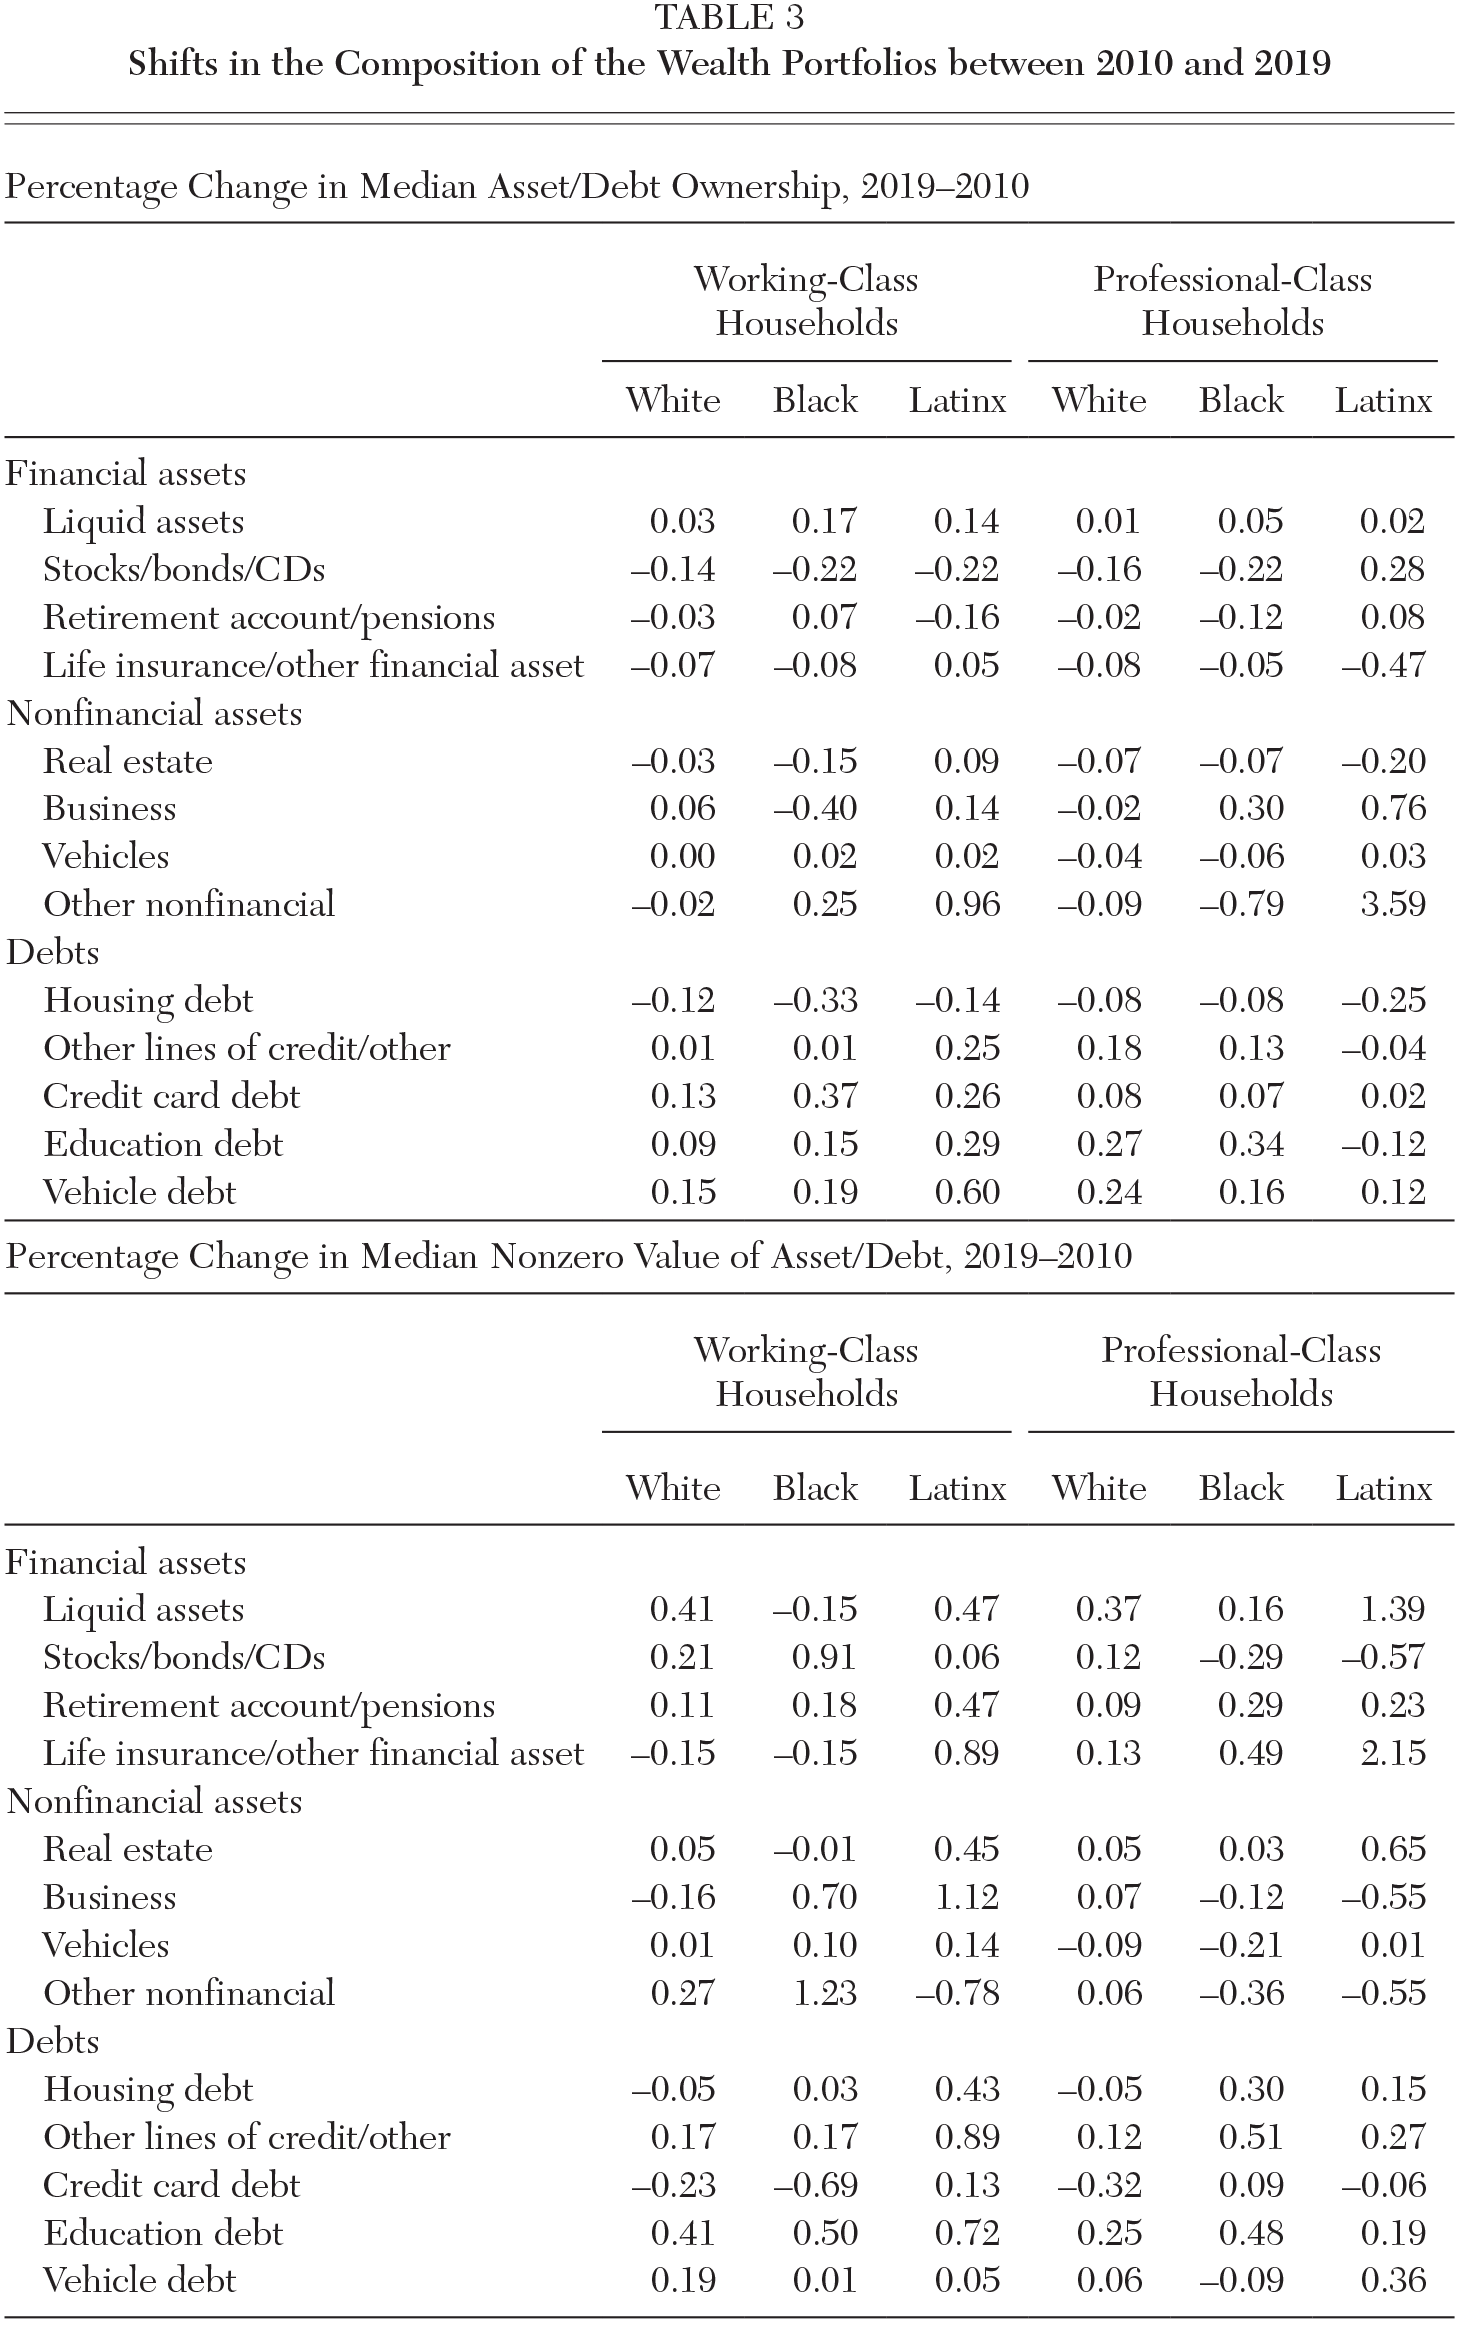
First, Latinx working-class households were the only group whose homeownership rate was higher in 2019 (53 percent) than it was in 2010 (48.5 percent), up 9 percentage points. The growth in their median nonzero value of real estate was also the largest, up 45 percent. Professional Latinx households also experienced the largest increase in the value of their housing value despite the largest decline in their real estate holdings. Second, with the exception of housing debt, credit card, education, and vehicle debt holdings increased across the board for all working-class households. Relatedly, nonzero debt amounts grew in most debt categories, with the largest increases in education debt. Education debt in Black and Latinx working-class households increased more than 50 percent. In addition, within race, the percent increase in education debt among working-class households was larger than professional-class households, whose median amounts also grew.
Because housing and homeownership composed the larger share and highest values for all households, we also replicated the top panel of Table 2 for nonhousing net worth (see Panel B in Table 2). Removing the net value of one’s home significantly reduces median household net worth (see Figure 1). Similar to total net worth, the nonhousing wealth of working-class households improved more than professional class households in percentage terms. In absolute terms, professional class households’ total nonhousehold net worth improved more. However, this was not the case with Black non-working-class households whose median nonhousing net worth has declined since 2010, and they ended the period as net debtors in this column.
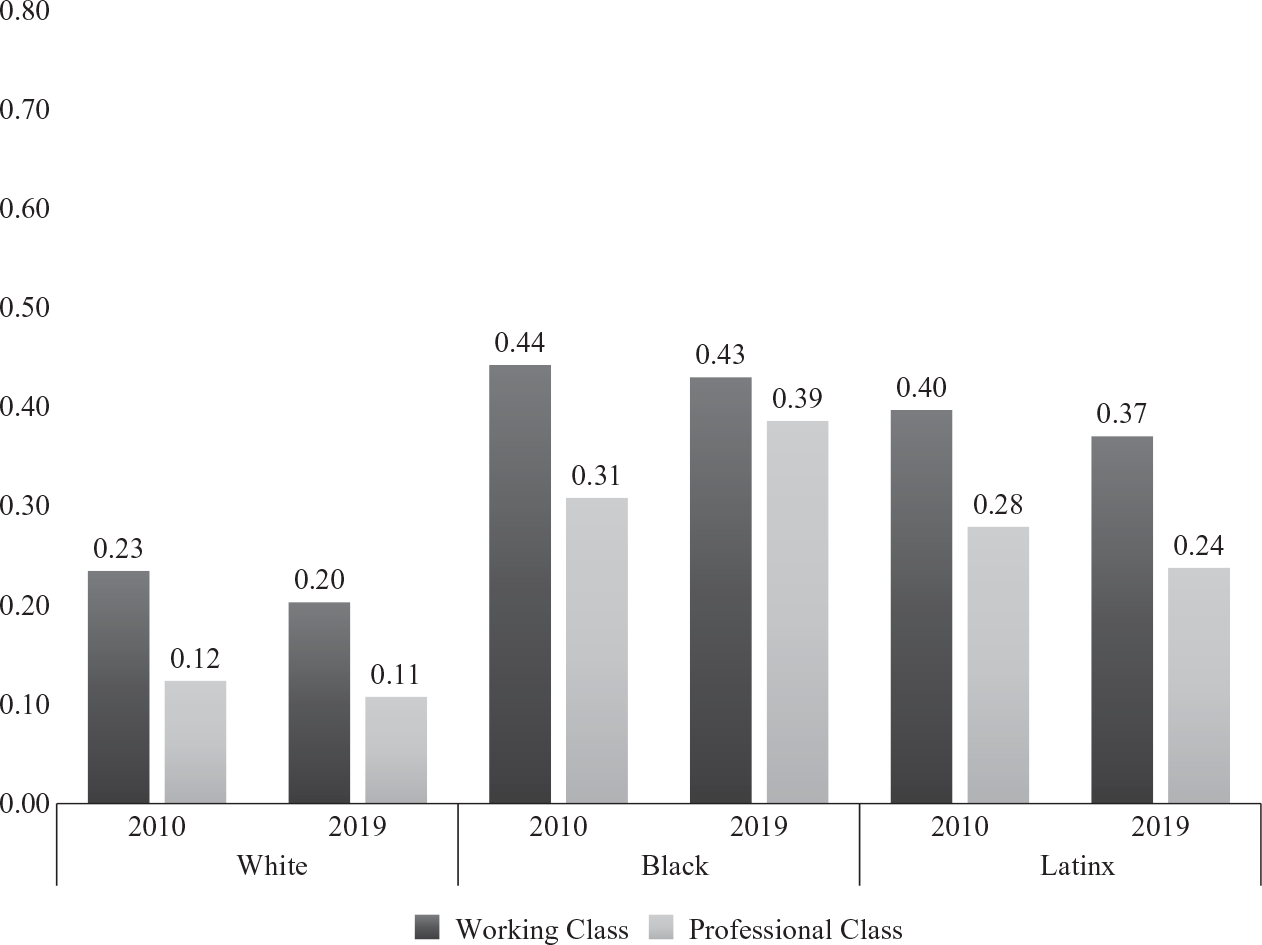
Wealth Poverty among Working-Class and Professional-Class Households: Total Net Worth
Would these households be considered wealth poor, insofar as their total wealth was less than three months of the monthly income poverty threshold? Figure 2 displays the proportion of households that are asset poor by total net worth and total nonhousing net worth. We note two important findings from this figure.
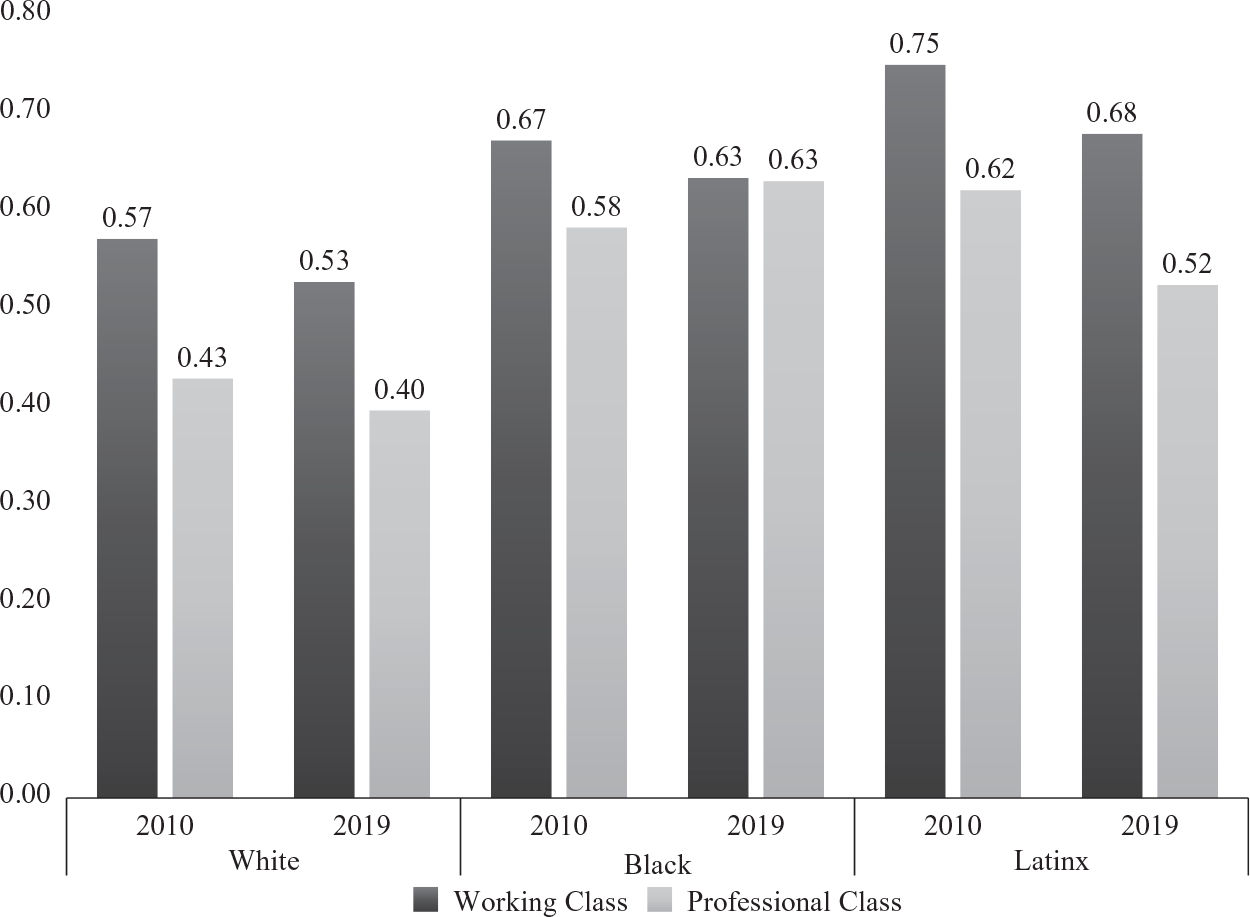
Wealth Poverty among Working-Class and Professional-Class Households: Nonhousing Net Worth
By 2019, little evidence exists of differences in the share of Black working- and professional-class households that are wealth poor. This change is due to increases in wealth poverty among the Black professional class over the recovery. This was not the case among white and Latinx households, whose working-class households were two times more likely to be wealth poor. Furthermore, the majority of Black and Latinx households, working class and professional, were wealth poor if assessed only on the basis of their nonhousing wealth. Alternatively stated, the nonhousing wealth holdings of these households would classify them as asset poor, and for Black households the proportion hovers around two-thirds of adult households.
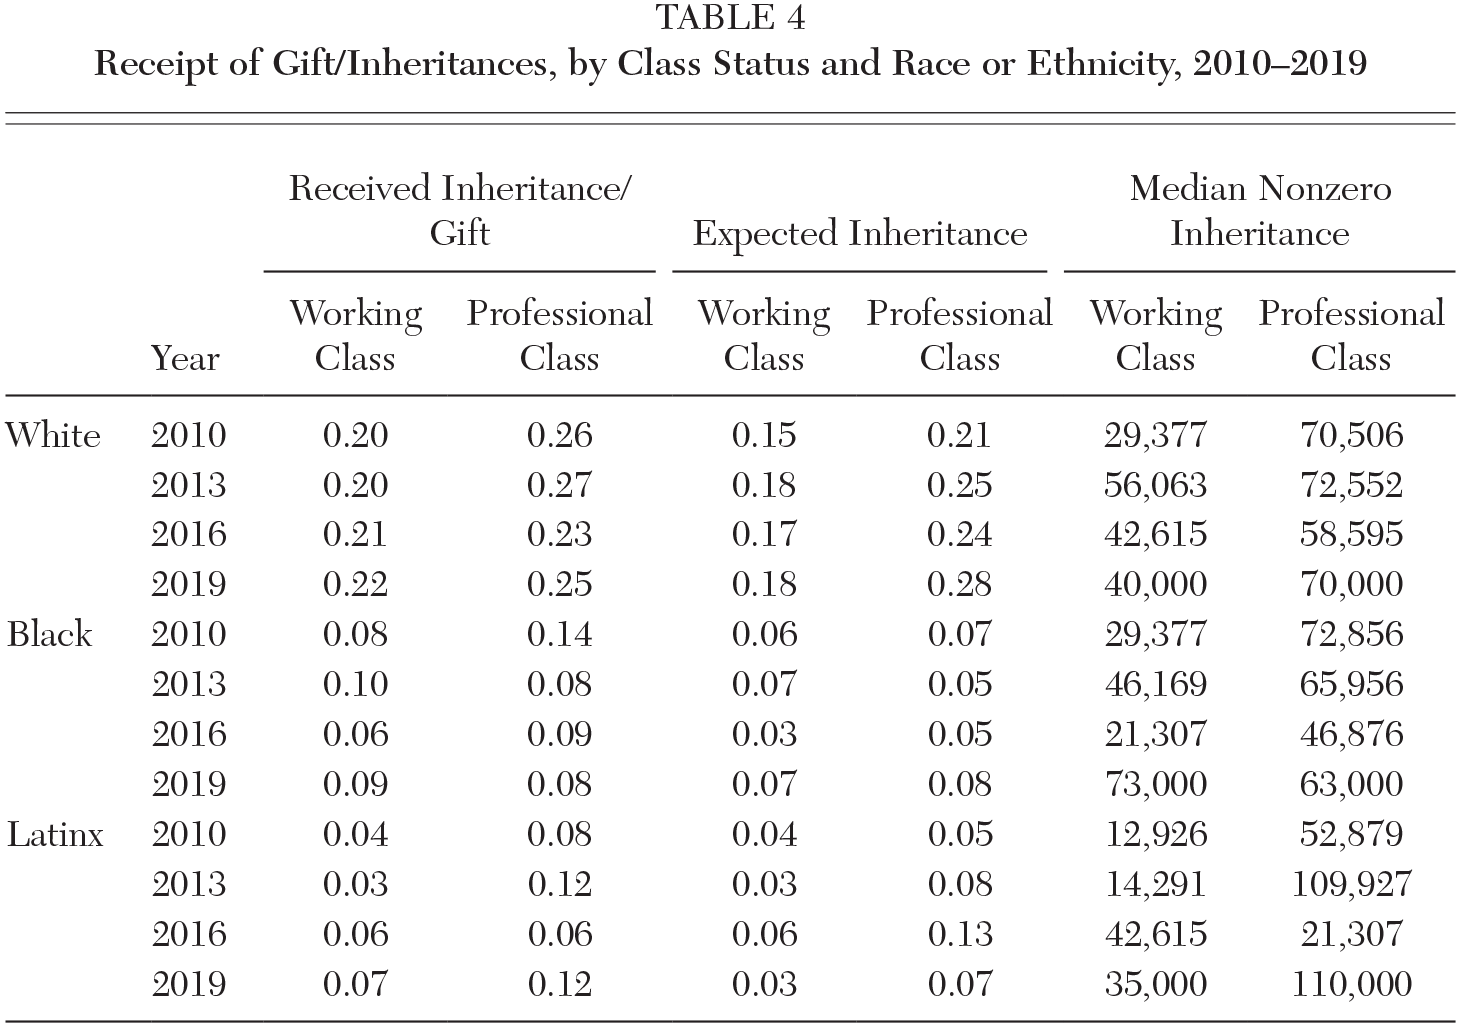
Table 4 examines the comparative receipt of gifts and inheritances by race and class. White working- and professional-class households are more likely to receive and expect gifts and inheritances (Table 4). With the exception of 2019 for Black households and 2016 for Latinx households, the median amount received by professional-class households was more than working-class households, suggesting that familial wealth transfers among professional households are larger and may contribute to their larger wealth standing compared to working-class households.
Receipt of Gift/Inheritances, by Class Status and Race or Ethnicity, 2010–2019
Working-class status and middle-class attainment
The final part of the analyses examines the association between working-class households and achieving a relative threshold of financial security. We created a binary variable equal to one if the respondent’s net worth status falls within the top three wealth quintiles. This definition draws upon a wealth-based definition to define middle-class status as the middle three quintiles of the overall wealth distribution (Wolff 2017, Darity, Addo, and Smith 2020). Instead of trying to augment a definition of working class that incorporates wealth, we instead use this opportunity to augment discussions related to class, wealth, and work, and create a bridge between (working) class and (middle-class attainment) status via wealth.
Table 5 indicates that the median wealth to meet the third quintile threshold rose 34 percent between 2010 and 2019. Across the entire distribution, median wealth levels improved among households headed by someone in the labor force. Panel B of Table 5 presents the percent of working-class households within each quintile by race and ethnicity.
Distribution of Net Worth by Quintiles, 2010–2019
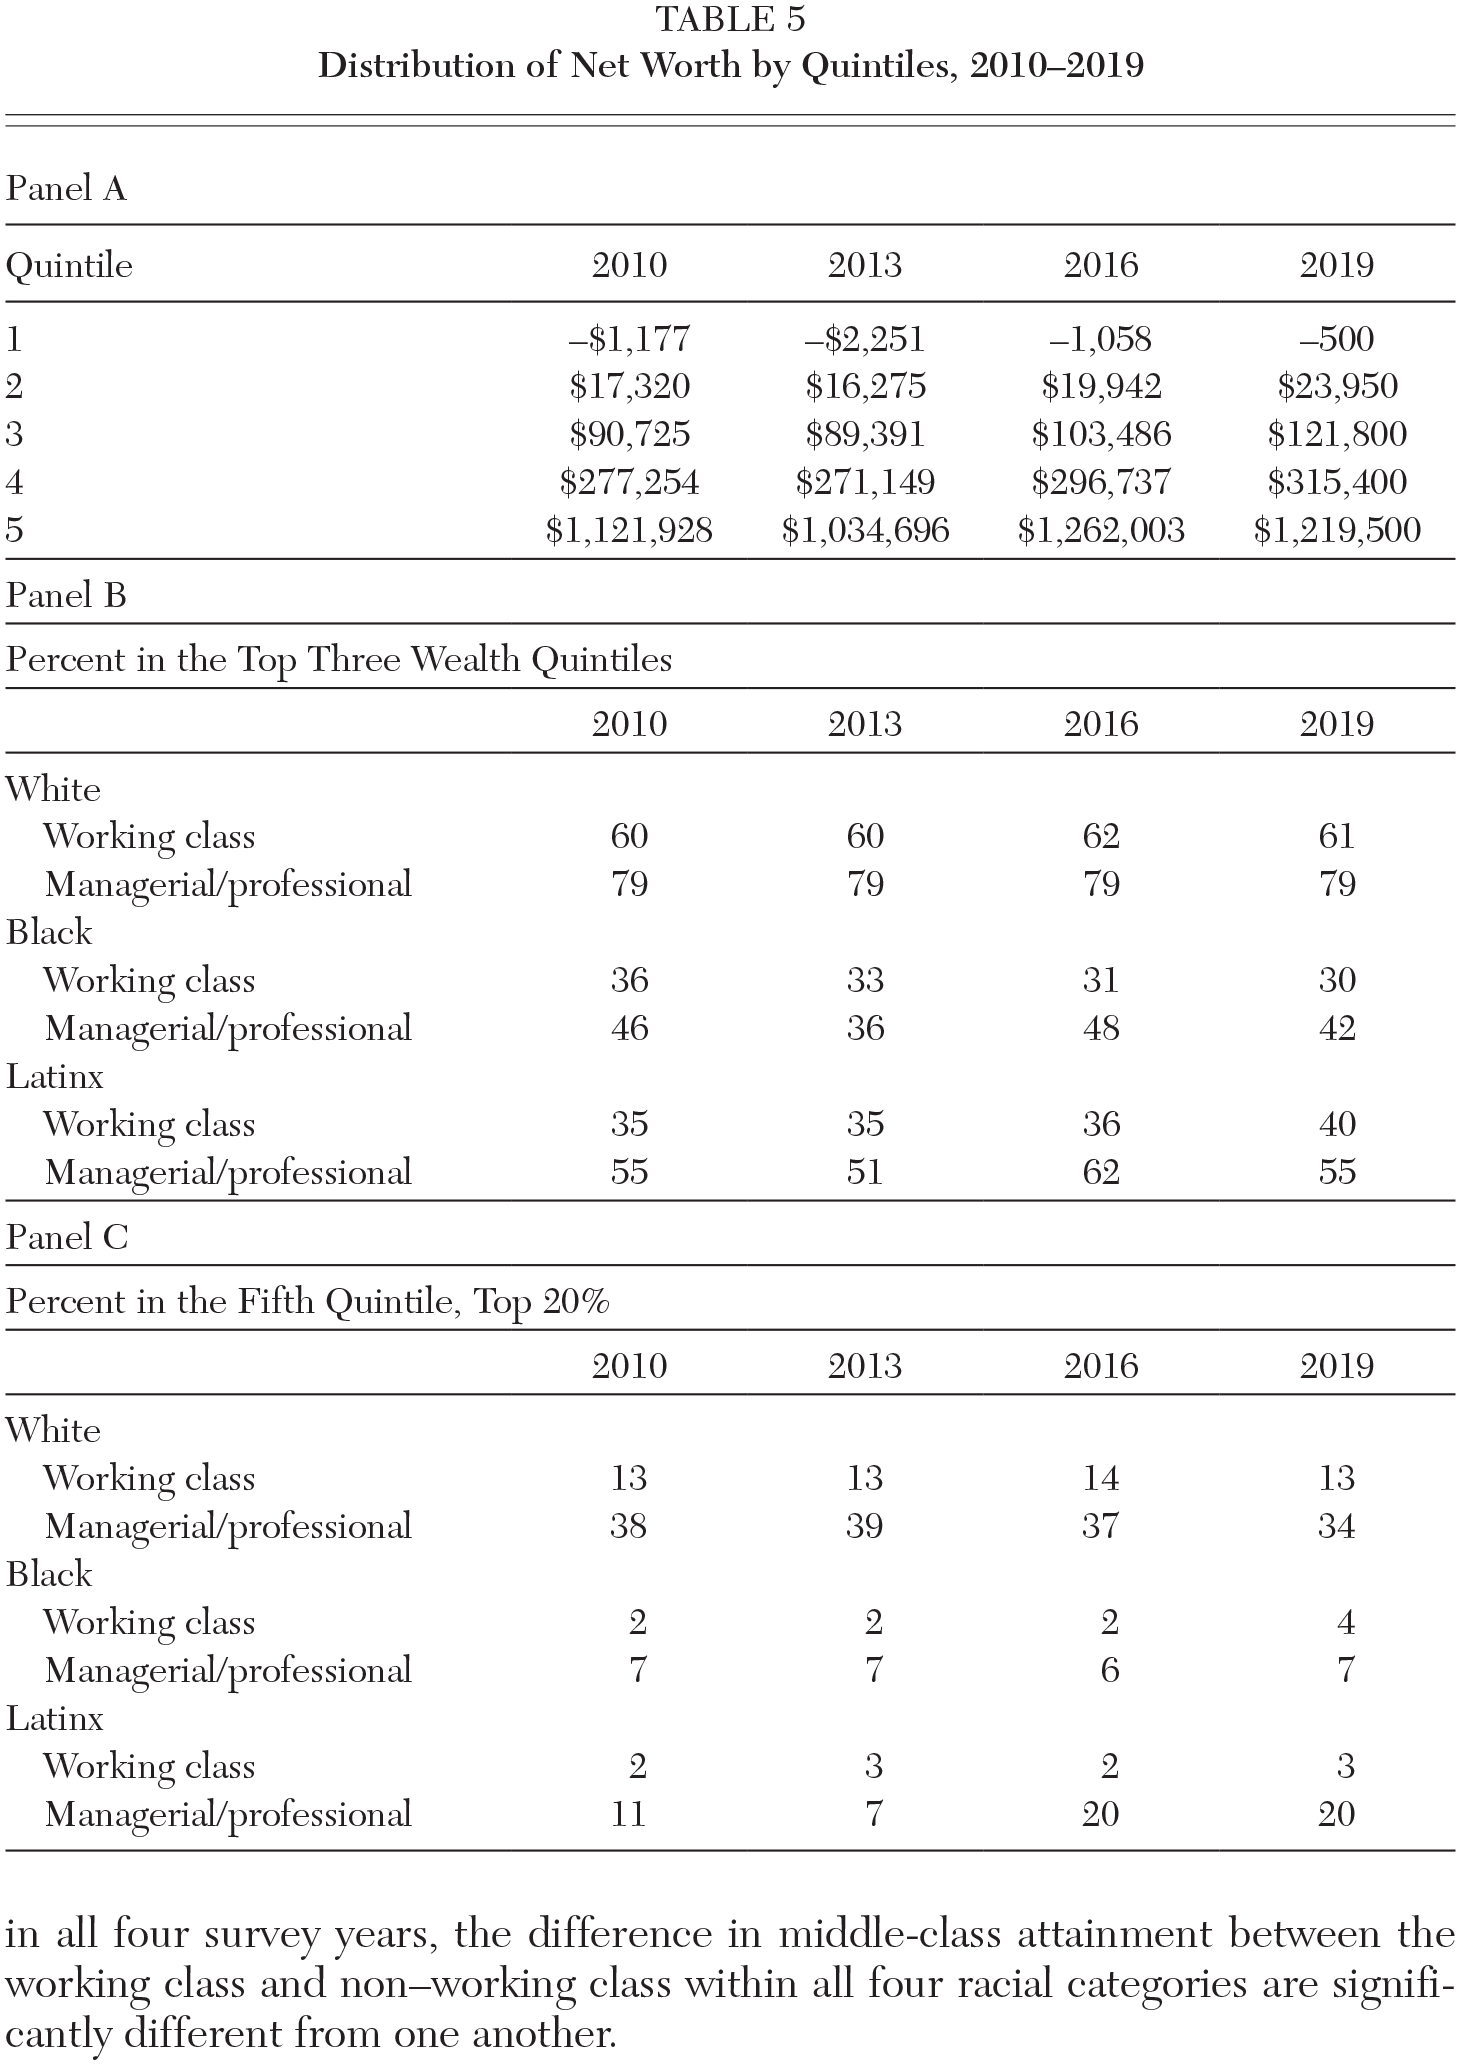
As is evidenced in Table 5, the comparative size of the Black middle class vis-à-vis the white middle class is stunning; being working class and having a net worth in the top three quintiles varies significant by race. By 2013, four years postrecession, 60 percent of white working-class households met the middle-class threshold with very little change afterward, increasing by only 1 percent by 2019. In contrast, as the threshold for middle-class status rose, fewer Black working households were able to meet it.
The percent of working-class Black households with middle-class levels of wealth, or higher, dropped 6 percentage points, with less than a third qualifying in 2019. Black professional-class households also fell from the middle-class threshold, dropping from a high of 48 percent in 2016 down to 42 percent in 2019. Latinx households experienced the largest growth from a low of just over one-third of their households meeting the criteria in 2013 to 40 percent by 2019. At the upper end of the wealth distribution, the top 20 percent, Black and Latinx working-class households are negligibly represented, reaching a high of 4 percent and 3 percent, respectively, in 2019.
We then estimate the marginal effect of working-class status on being at least middle class, dictated by wealth holdings. Results from this analysis are listed in Table 6. We find that by 2019 a working-class household was 4.9 percent less likely to be at least middle class compared to professional-class households. Households headed by Black and Latinx adults in the labor force also were less likely to achieve middle-class status relative to white households.
Logistic Regression Models Predicting Middle Class Attainment among Working Class, 2010–2019
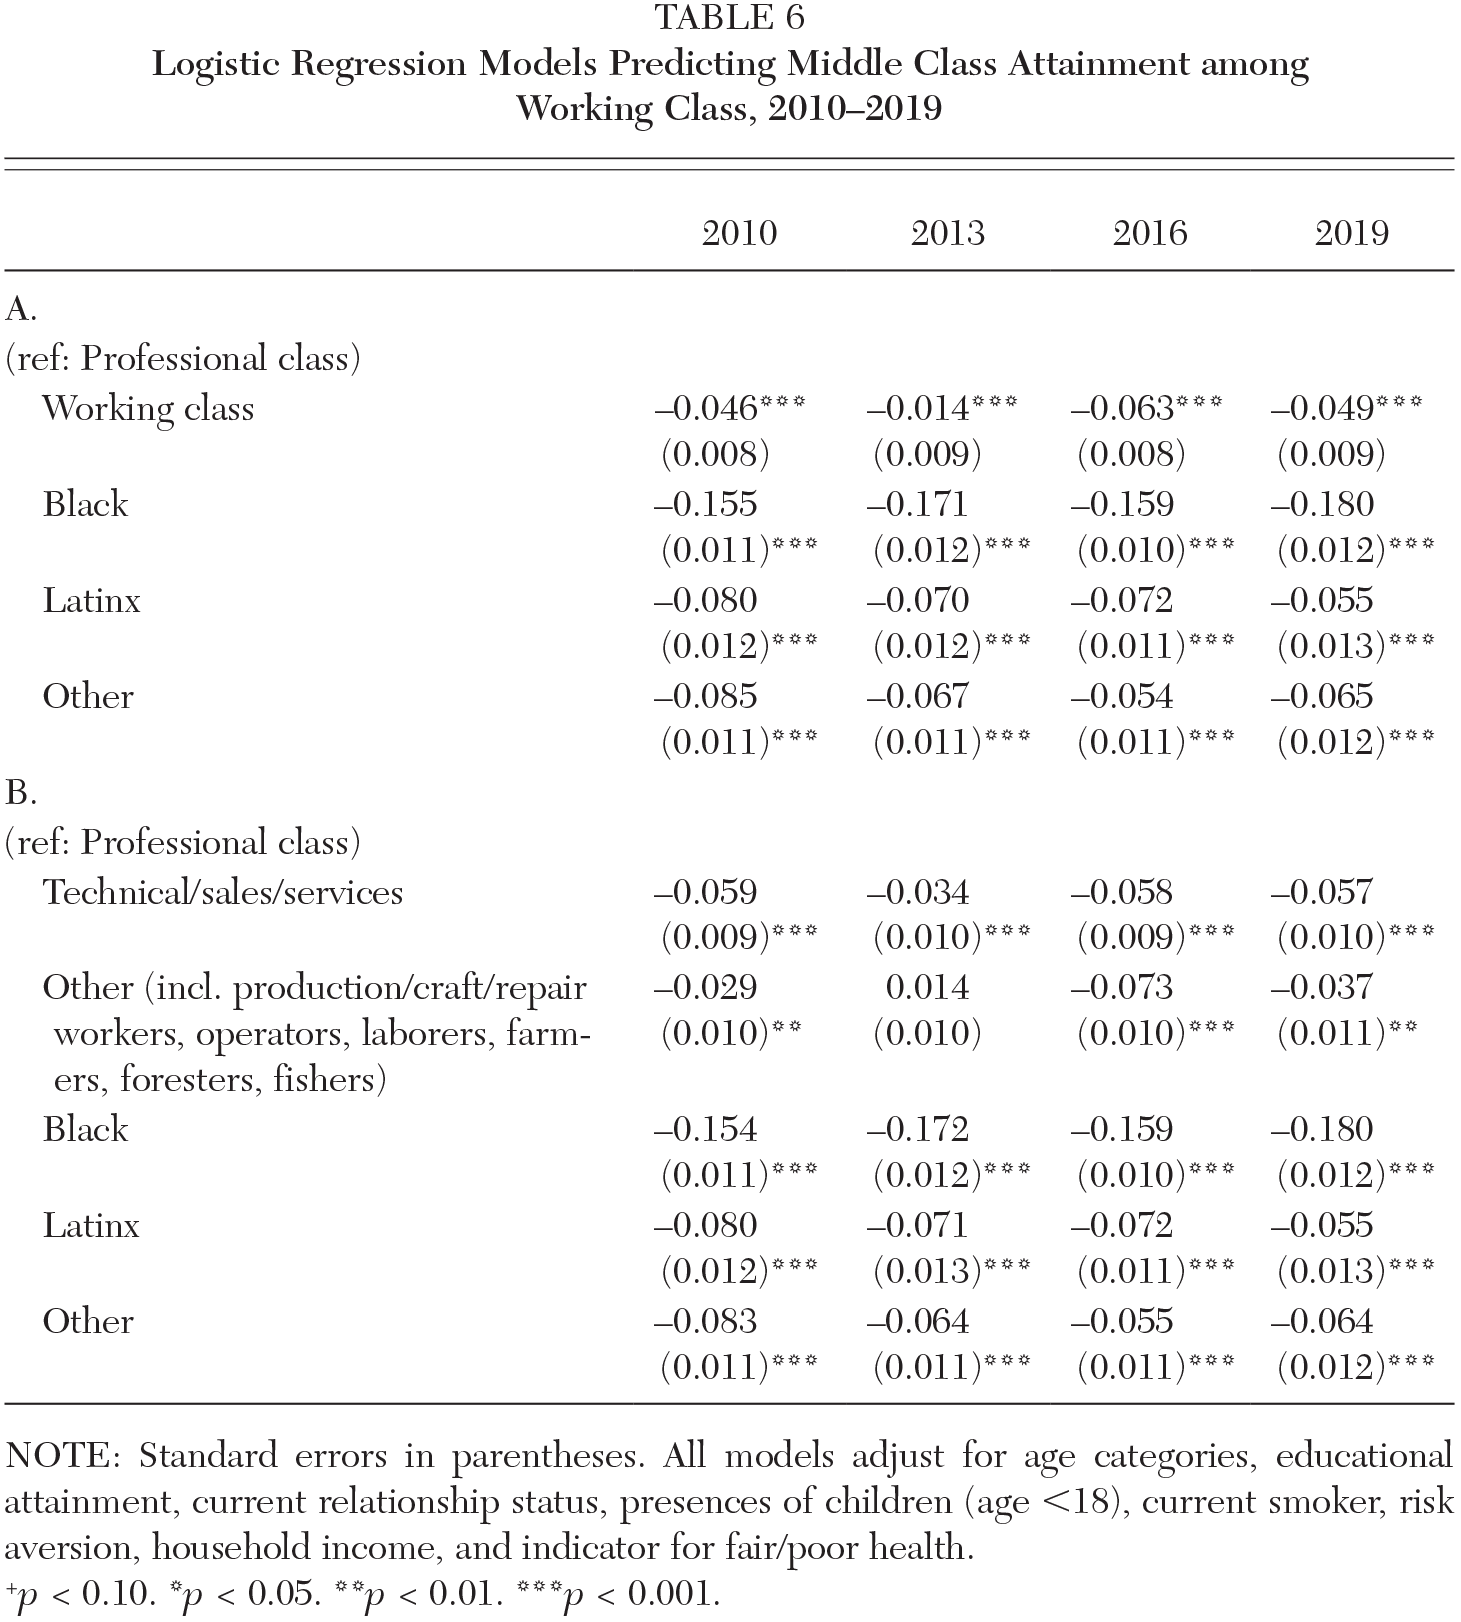
NOTE: Standard errors in parentheses. All models adjust for age categories, educational attainment, current relationship status, presences of children (age <18), current smoker, risk aversion, household income, and indicator for fair/poor health.
+p < 0.10. *p < 0.05. **p < 0.01. ***p < 0.001.
Within the working class, sales and service sector employment account for the largest portion of the negative relationship over the period. With the exception in 2016, sales and service workers were much less likely to be middle class compared to the professional-class households. As the composition of these groups shifted and the middle-class threshold increased over the period, however, both sectors were negatively associated with middle-class wealth attainment.
We also examined whether there are racial disparities in the relationship between working-class status and middle-class attainment by race or ethnicity. Two main findings are worth pointing out here. First, in all four racial categories in all four years, the probability of achieving middle-class status for professional households is greater than working-class households; and within white professional-class households, this probability remained above 0.60. Second, the working-professional gap grows for Black households as the chances of middle-class attainment decreases for Black working-class households. It is also the case that in all four survey years, the difference in middle-class attainment between the working class and non–working class within all four racial categories are significantly different from one another.
Conclusion
The current study is driven by a central question: what does it mean to be working class in a society of extreme racial wealth inequality? It means that if you belong to a historically marginalized racial or ethnic group, your racial status is the stronger predictor of your economic position than your education, income, and in this case, employment status and position.
Our article had three objectives. First, we wanted to move beyond conventional definitions of working-class status and define these households by labor force attachment and in relation to the means of production. Second, we needed to characterize the financial status of working-class households post–Great Recession and how their wealth position changed over and relative to professional class households. The third objective was to assess the relationship between working-class status and middle-class attainment.
We aimed to investigate these objectives with a racialized lens during the post–Great Recession, pre–COVID-19 era, and during the longest economic recovery in recorded U.S. history. In line with the stark racial wealth disparities present in the immediate years postrecession (McKernan et al. 2014; Compton, Giedeman, and Muller 2018), Black and Latinx households recovered slower and experienced lower relative gains.
During the post–Great Recession period between 2010 and 2019, we find persistent racial wealth gaps that trump occupational-class categorizations. We find that as the economy recovered and more adults returned to the labor force, wealth inequality grew, with fewer Black and Latinx working-class households benefitting enough to achieve societal thresholds of financial security. In addition, these households steadily increased their debt holdings, in education debt in particular, despite asset holdings either declining or remaining the same.
This article provides an intersectional analysis of race and class. To our knowledge, this is the first article to examine trends in wealth inequality with working-class populations and differences by race and ethnicity. Our occupational-based definition of working and professional class allows us to show that economic security and opportunity vary significantly across racial and ethnic groups.
Using wealth as a standard, the middle-class status of black households is extraordinarily fragile. And black households, regardless of class position, are sharply absent from the uppermost quintile. In fact, the data on the distribution of households in the top wealth quintile is devastating (panel C of Table 4). Even though the percentages doubled from 2010 to 2019, less than 5 percent of Black working-class households held enough wealth to meet the threshold over the period, and less than 10 percent of Black professional-managerial households met the threshold.
The economic fragility of Black households, undoubtedly, is tied to their jobs and wage precarity during the recessions, as Biu, Famighetti, and Hamilton (this volume) demonstrate. And even when the economy rebounds, the wealth positions of Black professionals who may experience greater returns in the labor market (Biu, Famighetti, and Hamilton, this volume) may not necessarily manifest on their balance sheet. We found that the proportion of Black professionals in the top quintile remained unchanged, with increases in this group among the wealth poor. The racialized differences in occupational sector sorting over the period within our broad categories also suggest that our calculations might be undercounting the wealth disparities by sector.
Although the SCF is one of the best surveys for comprehensive wealth information on American households, it is not without limitations. There is no detailed data available on Native American/Alaska Native/Native Hawaiians or Asian Americans to include in our analysis. Given the employment patterns of their working-class populations (see Akee, this volume), their exclusion means we are presenting an incomplete accounting of U.S. working-class households. The SCF is also cross-sectional and does not contain intergenerational wealth information.
Our summary descriptive statistics on the receipt of gifts and inheritances indicated that more white households had greater access to and anticipated receiving parental and grandparental wealth, and more white professional-class households did so relative to the white working class. This is suggestive that wealth transfers play an important role in maintaining racial wealth inequality independent of class.
The public use SCF files restrict a lot of demographic information to prevent identification of study respondents. As a result, no geographic indicators are available to include in the analysis. In addition, a sampling framework that only interviews men as the household head in partnered households restricts the ability to include a nuanced gender analysis. This is of special concern given evidence of persistent racialized gender wealth gaps among young adults and female-headed household postrecession (Bhattacharya, Price, and Addo 2019). Unfortunately, another limitation of the SCF is that it does not have detailed information on fines and fees and other debts related to the criminal justice industry (Harris, Evans, and Beckett 2010); nor does it separate out medical debt from other debt.
Finally, because the data from the most recent SCF is from 2019, it predates the COVID-19 crisis. While we have no direct evidence on changes in levels of wealth by race and class after the onset of the pandemic, evidence does exist that suggests that racial differences must have been aggravated by the crisis. For example, economist Robert Fairlie (2020) has estimated that by the end of April 2020, 41 percent of all Black-owned businesses had gone out of operation.
Similar to Ziliak (this volume), we find that homeownership declined among all groups during the recovery, with the exception of Latinx working-class households whose holdings increased 9 percent. Undoubtedly, this is a group that has fared particularly badly both in the labor market and COVID diagnoses and deaths. We only can conclude that the racial gulf in wealth has widened since the beginning of the pandemic year.
Footnotes
Fenaba R. Addo is an associate professor of public policy at the University of North Carolina–Chapel Hill. Her work on racial disparities in student debt, older Black women and wealth, and the Millennial wealth gap sheds light on the ways that societal inequalities stem from historical legacies of racial exclusion and discrimination, and how they get reproduced over time.
William A. Darity Jr. is the Samuel DuBois Cook Professor of Public Policy, African and African American Studies, and Economics and the director of the Samuel DuBois Cook Center on Social Equity at Duke University. His most recent book, coauthored with A. Kirsten Mullen, is From Here to Equality: Reparations for Black Americans in the 21st Century (University of North Carolina Press 2020).