
Abstract
Does resource allocation by the central government to local governments in Tanzania favour opposition or the ruling party's strongholds? The literature advances two opposing theories – electoral competition and hegemonic party hypotheses. We use unique data on fiscal transfers and human resource allocations to investigate the effect of electoral support on government allocations. Contrary to the two hypotheses, we find no political bias in fiscal resources transferred to local governments. Similarly, we find no strong evidence to suggest any political bias in human resource allocation. On the whole, neither does the evidence confirm nor conclusively disconfirm the two hypotheses. The findings imply that hegemonic-parties do not necessarily opt for a discriminative strategy in intergovernmental resource allocations even after facing a threatening opposition. Flexibility in autocratic menu and the path dependence of government's social policy are likely to explain this kind of hegemonic party's allocative behaviour.
Introduction
The political economy literature expresses a connection between political influence and public goods allocation, pointing to interest groups as crucial factors of government allocations. Depending on a country's socio-political and economic landscape, interest groups can be organised in terms of class, religion, ethnic identity, or political affiliation. Since not all interest groups are relevant in a given context, government allocations will be influenced by a politically significant interest group (Posner, 2004). In Africa, the political economy of resource allocation has attracted much academic interest. Given ethnicity's political salience in African politics, many studies on distributive politics in Africa have focused on ethnic diversity. In this regard, a significant contribution on how ethnicity affects public goods provision or resource allocation has been made (Habyarimana et al., 2007; Ilorah, 2009; Kramon and Posner, 2013, 2016; Miguel and Gugerty, 2005). This body of literature views ethnicity as a key organising principle of African politics.
These works notwithstanding, ethnic diversity has never had similar outcomes across African countries, Tanzania being a case in point. Studies have confirmed that ethnicity is generally insignificant in Tanzania's political and policy processes (Eifert et al., 2010; Green, 2011; Miguel, 2004). Other analysts have also shown that Tanzanians tend to mobilise along party and state rather than ethnic lines (Ndulu et al., 2019). Similarly, Afrobarometer surveys confirm a majority of Tanzanians identify themselves with the nation more than with their respective ethnic groups. 1 This is so despite the country's high level of ethnic fractionalisation compared to most other countries in Africa (Posner, 2004).
In this article, we investigate the effect of electoral support on government allocations in Tanzania, a country with insignificant ethnic attachments. Specifically, we examine the relationship between electoral support and financial allocations to local governments (LG). We also examine the relationship between electoral support and the allocation of human resources. We use unique cross-section data on fiscal transfers to LGs for four consecutive years after the 2015 general elections; these were the most competitive elections in Tanzania history, posing the greatest challenge to the hegemony of the ruling party, Chama cha Mapinduzi (Revolutionary Party, CCM). We also use data for personnel needs and allocations sourced from the President's Office, Regional Administration and Local Government (PO-RALG). We complement the two datasets with electoral data obtained from the National Electoral Commission and fiscal prudency data sourced from Controller and Auditor General's reports. In the empirical analysis, we use an econometrics technique to examine whether allocations of financial or human resources favour LGs that support CCM or those that support the opposition. The findings reveal no significant relationship between electoral support and allocation of financial resources to LGs. These results are robust at different specifications. Similarly, regarding human resources, we find no significant relationship between the allocation of primary and secondary school teachers and oppositional support. Overall, the findings indicate that an increase in opposition support in a district neither favours nor disadvantages it in terms of government resource allocations.
Tanzania opened up for liberal multiparty democracy in 1992. Since then, the country's democratic transition has created two major politically relevant interest groups: CCM and the opposition. 2 The latter constitutes various political parties, influential ones being Chama cha Demokrasia na Maendeleo (Party for Democracy and Progress, CHADEMA), the Civic United Front (CUF), Alliance for Change Tanzania (ACT-Wazalendo), and the National Convention for Construction and Reform (NCCR-Mageuzi). Likewise, policy debates have been polarised into the opposition's supporters versus supporters of the ruling party. Since CCM is the largest interest group in terms of influence, as it controls state institutions and resources, we examine whether the districts that support the ruling party receive disproportionately more resources than the districts that support the opposition. Tanzania is a unitary state. The structure of public administration consists of the central government and LGs. The central government extends from the national level through regional and district levels. In each district, there is at least one LG council. These are democratically elected institutions and key centres of service delivery to the citizens. The central government determines policy and the services that LGs should provide. LG units are relatively large, each serving an average population of approximately 270,000 people (Table 1). Politically, LGs are important centres for political mobilisation and competition. They coordinate both national and local elections at the district level. Electoral constituencies from which legislators are elected exist at the LG level where the majority of LGs have one constituency while a few others have two or three. LGs are also organised into wards from which LG councillors are elected. While Tanzania practises a devolved LG system, LGs are kept under tight central government control. They raise less than 10 per cent of their own revenues and thus depend highly on central government transfers. 3 Staff recruitment to LGs except for junior cadres such as office attendants, drivers, and village executive officers is carried out by the central government.
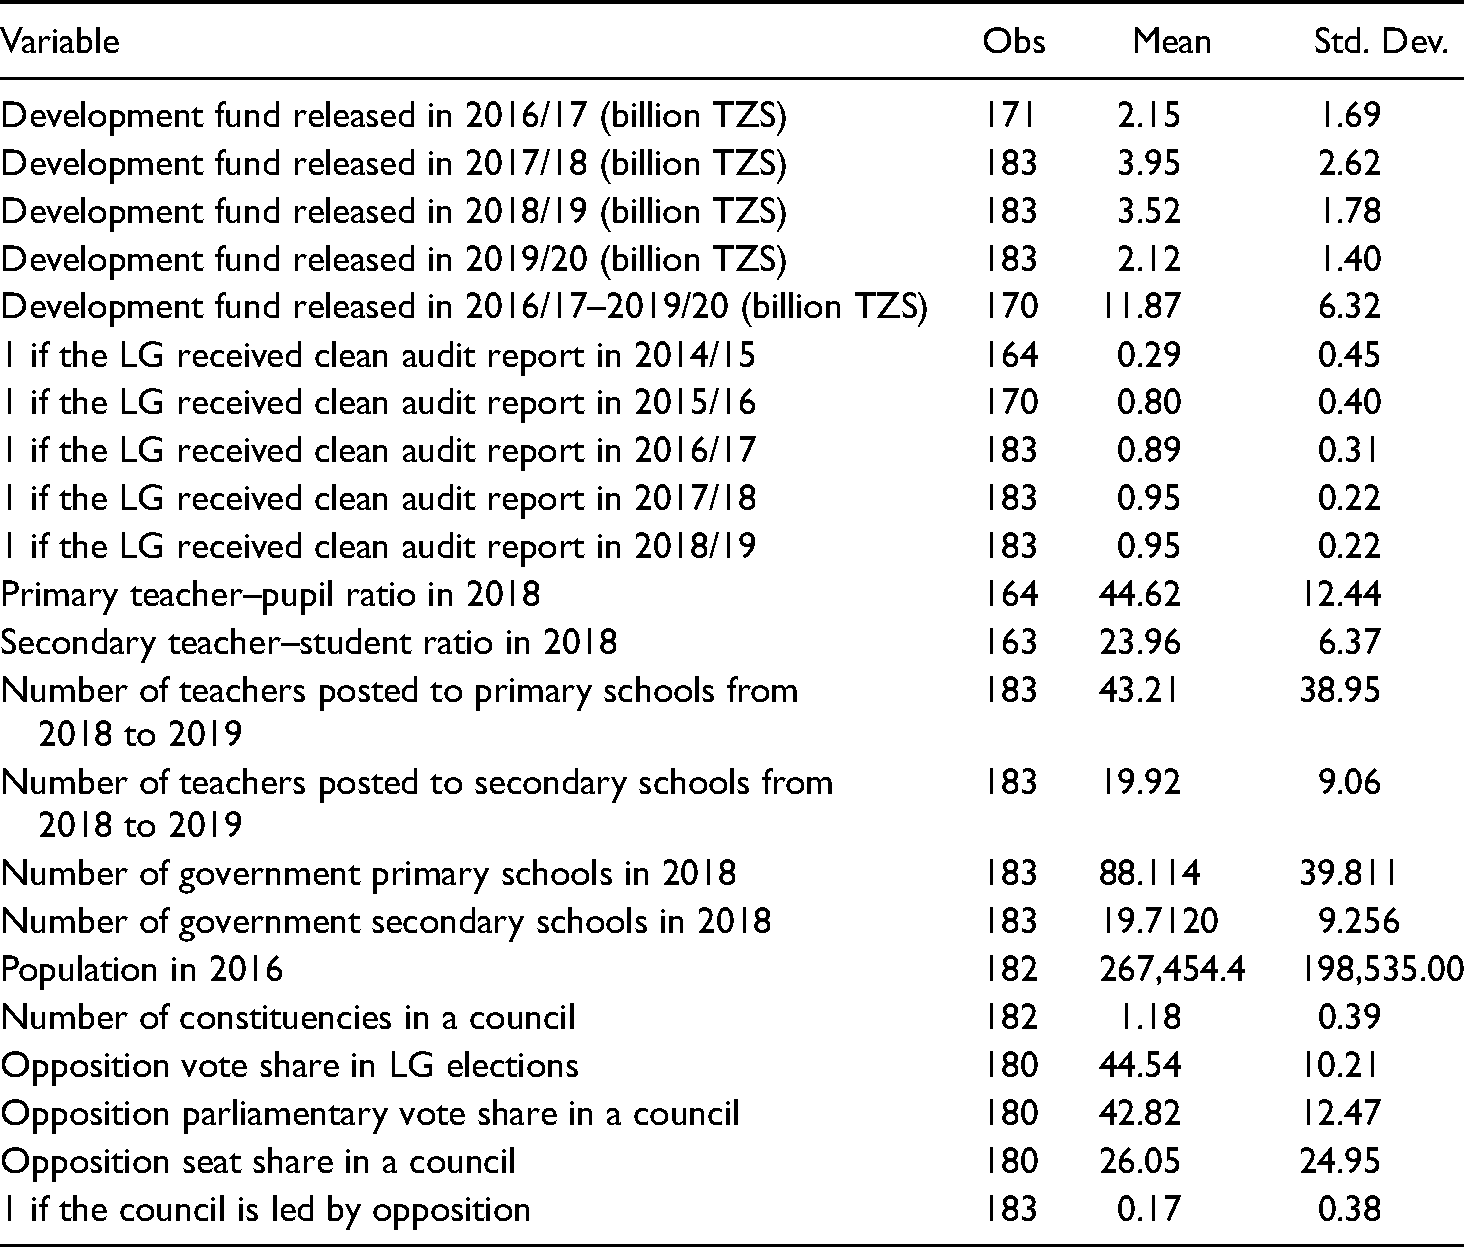
Summary Statistics.
The study is of both practical and theoretical significance for several reasons. First, research on resource allocation in Africa points to ethnic bias. Yet, ethnicity is not a salient feature of Tanzania's political processes. Second, unlike previous studies that focus only on financial allocations, this article adds human resource allocations to the distributive politics literature. Third, emerging discourses on distributive politics in Tanzania hint at political bias in resource allocations (Said, 2018). Likewise, during the 2020 general election campaigns, CCM's campaign rally messages were framed in such a way to make the voters believe that they were risking their regions’ development if their district elected opposition candidates. As part of its campaign strategy, CCM asked the voters to choose its candidates in all three posts – namely, a councillor, a legislator, and a president, as voting otherwise would cut the link to the government. 4 Such messaging may constrain voters’ choice, especially when they believe voting otherwise would disadvantage them. Nevertheless, and as revealed in the subsequent section, evidence on electoral support and distributive politics in Tanzania is mixed.
Tanzania provides an ideal case for this study for three reasons. First, LGs in Tanzania depend mainly on grants from the central government to finance development projects and public service provision. Second, Tanzania practises a centralised staff recruitment system where staff in crucial social sectors are recruited by the central government and posted to LGs (Tidemand et al., 2014). Third, although the ruling party remains hegemonic, it is facing a threatening opposition. This study advances two main unique contributions regarding the political economy and distributive politics in Africa: it addresses how distributive politics in ethnically undivided societies shape public resource allocations, and it demonstrates how a hegemonic party facing competitive opposition allocates resources.
The article proceeds as follows. Section ‘Electoral Politics and Government Allocation’ discusses the literature on electoral politics and government allocation and examines existing research in Tanzania. Section ‘The Political Setting’ presents an overview of Tanzania's electoral politics. Section ‘Data and Descriptive Statistics’ covers the data and descriptive statistics. Section ‘Estimation Strategy’ lays out the estimation strategy. Section ‘Results and Discussion’ presents and discusses the results, and Section ‘Conclusion and Implications’ concludes and provides policy recommendations.
Electoral Politics and Government Allocation
Golden and Min (2013) distinguish four classes of studies that characterise the discourses on electoral politics and government allocation. Two of them are of interest to our study: the core-vs.-swing-votes hypothesis and the political/ethnic-favouritism hypothesis. The former posits that, with increased political competition, incumbent politicians target swing voters by allocating more resources to highly competitive districts (Dalhberg and Johansson, 2002; Rosenzweig, 2015; Schady, 2000). This implies that districts in Tanzania with a relatively high electoral competition level will receive more allocations than districts considered CCM strongholds. Other literature maintains that this does not hold in hegemonic party contexts, contending that since hegemonic parties are not that threatened by the opposition, they tend to reward loyal supporters with more resources while punishing non-loyal districts (Magaloni and Kricheli, 2010). Relatedly, Magaloni's (2006) ‘voter defection deterrence’ model predicts that a dominant party will allocate distributive goods to the benefit of only those who vote for the party and severely punish those voting in favour of the opposition. In this scenario, the districts that support opposition parties would be expected to receive relatively fewer resources. Magaloni (2006) assigns Tanzania to the category of hegemonic-party autocracies, which employ punishment regimes to remain in power. This paper describes CCM as a state party that also exhibits features of a hegemonic-party autocracy but historically committed to regional equality.
Elsewhere, existing empirical studies on redistributive politics document mixed findings. While other studies have shown that incumbent governments target transfers to districts/constituencies with many swing voters (see, inter alia, Dalhberg and Johansson, 2002; Stokes, 2005), others have found that governing parties skew the distribution of funds in favour of areas that provide them with the strongest electoral support (see, for example, Ansolabehere and Snyder, 2006; Magaloni, 2006). In Tanzania, available research on distributive politics acknowledges political influence on grant allocations (Allers and Ishemoi, 2011a, 2011b; Boex, 2003; Boex and Martinez-Vazquez, 2005; Carlitz, 2017; McLellan, 2020; Rosenzweig, 2015; Semali and Minja, 2005; Weinstein, 2011). That research notwithstanding, the evidence on whether the political bias favours CCM strongholds is mixed. For instance, whilst Weinstein (2011) and McLellan (2020) found that government resources are allocated disproportionately to districts that support the ruling party, Rosenzweig (2015) revealed that more competitive districts receive greater budget allocations and greater access to piped water and electricity. Weinstein (2011) found CCM targeting expenditures towards those districts that elected the party with the highest margin of victory. Although Carlitz (2017) found no evidence of political favouritism when it comes to allocation of finance from the central government to LGs, she documented the bias within districts, whereby distribution of new water infrastructure was found to favour localities that support the ruling party.
By contrast, Allers and Ishemoi (2011a) found no evidence to suggest that government allocations are influenced by the CCM–opposition divide; instead, they are influenced by political representation. 5 They attribute this observation to CCM dominance, which makes it feel less threatened by the opposition. Drawing from the hegemonic-party thesis, Weinstein (2011) and McLellan (2020) contend that CCM employs a punishment strategy by withdrawing resources from districts that attempt marginal defection while targeting districts of its loyal supporters with more resources. With the exception of McLellan (2020), previous studies underplay the strength of the opposition in Tanzania, while the hegemonic-party thesis downplays the possibility of the electorate employing negative reciprocity. Moreover, the intergovernmental transfer data used in previous studies covers the period prior to the 2015 elections. This was before CCM had ever experienced significant competition. This article contends that the hegemonic party's distributive behaviour manifests openly when its hegemony is greatly challenged. Our study uses transfer data from after the 2015 elections, when the opposition threat apparently challenged CCM hegemony, vigorously shaking its hold on power.
The Political Setting
Tanzania got its independence from the British in 1961. Four years later, it abandoned multiparty politics. In 1967 it adopted ujamaa (socialist) ideology as a guiding framework in organising the politics and economy of the country. It opened up for liberal multiparty democracy in 1992 and held its first multiparty elections in 1995. This was after 27 years of a centralised one-party state. In 1977 the ruling party was constitutionally installed as the supreme authority, reducing the legislature to nothing but a mere CCM committee (Shivji, 2008). This concretised the already existing fusion of the bureaucracy and security organs into the party. The transition to multiparty democracy did not undo this fusion but transformed CCM into a state party (Makulilo, 2008). The Constitution remained almost the same, but with more powers assigned to the president. CCM's influence on the state is reinforced further by the party's tradition that once its candidate wins the United Republic's presidency, s/he automatically becomes the party's chairperson. CCM has maintained its hegemony in all past multiparty elections. This, however, has not been without contestations from the opposition, as election results are normally disputed. Likewise, some analysts have questioned the integrity and impartiality of the election management institutions (Makulilo et al., 2016). Despite the contestations over the playing field's levelness, the opposition has become increasingly competitive, even posing a threat to the ruling party. For instance, the opposition increased its electoral support in presidential elections, narrowing the electoral margin from approximately 69 per cent in 2005 to 36 per cent in 2010 and 18 per cent in 2015. This suggests that whilst CCM remains the dominant party, its hegemony is greatly curtailed in free elections.
Similarly, the opposition's share of parliamentary votes increased from 30 per cent in 2005 to 40 per cent and 45 per cent in 2010 and 2015, respectively. At the same time, opposition-led LGs increased to 17 per cent in 2015 from 7 per cent in 2010, with the opposition leading key municipalities and major cities. The results of the 2020 elections are, however, disconcerting as they almost wiped out opposition representation in both parliament and local government councils. CCM was declared winner in all but two constituencies on the Tanzanian mainland, while its presidential candidate, Dr John Pombe Magufuli, scored 84 per cent of the votes. This lopsided result notwithstanding, the 2020 election does not provide a sound basis to support claims that the power of the opposition is diminishing. Research has shown that the elections were, to a large extent, marred by irregularities and coercion (Cheeseman et al., 2021; Paget, 2021). Besides, the opposition's political space had been severely constrained by restrictive measures implemented by the regime after the 2015 elections (Paget, 2017). Regan and Henderson (2002) have shown that semi-democracies are likely to be repressive when they are politically threatened. This has been the case in Tanzania (McLellan, 2020). Nevertheless, the percentage of Tanzanians supporting democracy increased from 57 per cent in 2014/2015 to 78 per cent during 2016/2018, suggesting increasing challenges to the ruling party. 6 Whether the opposition threat motivates CCM to employ distributive strategies to deter opposition influence is examined in turn. Since CCM's dominance experienced substantial challenges between the 2010 and 2015 elections, it is essential to analyse how this hegemonic state party has allocated resources to LGs after the 2015 elections.
Data and Descriptive Statistics
Data
This study uses cross-section data from four main sources. 7 The data for fiscal transfers was sourced from the Ministry of Finance and Planning. The Ministry of Finance and Planning has detailed data on fiscal transfers disbursed to each LG (our unit of analysis) in different financial years. This study uses development funds 8 released by the central government to each LG in four consecutive financial years after the 2015 general election – that is, 2016/2017, 2017/2018, 2018/2019, and 2019/2020. Currently, there are 184 LGs in Tanzania. 9 The second type of data is that of the 2015 general election results sourced from the National Electoral Commission. Relevant information from this data includes the number of constituencies in each LG, opposition seat share in a council, 10 LG CCM seats, LG total votes, LG opposition council votes, LG CCM votes, total parliamentary votes in a council (i.e., LG), total opposition parliamentary votes in a council, and CCM parliamentary votes in a council. We use elected council seats to calculate LG opposition seat share. Another variable generated from this data is opposition vote share in LG elections, which is calculated using LG opposition votes and LG CCM votes. Likewise, we use total opposition parliamentary votes in a council and CCM parliamentary votes in a council to calculate total opposition vote share. From the National Electoral Commission data, we also determine whether the LG is led by the opposition or the ruling party, CCM.
We complement the above datasets with fiscal prudency data obtained from Controller and Auditor General's reports. These reports are produced at the end of every fiscal year. Each year, the National Audit Office of Tanzania subjects each LG to an audit and then issues an overall opinion. Usually, the opinions are of three main types, each representing a different situation encountered during the auditor's work. The three main opinions are the unqualified opinion (clean audit opinion), qualified opinion (when there are material misstatements in a district's financial record-keeping), and adverse opinion (when a district's financial statements are not as per the applicable financial-reporting framework or accounting standards). We use this information to create a proxy for fiscal prudence – that is, a dummy variable equal to ‘1’ if the council received a clean audit report and ‘0’ otherwise. The fourth source of data is the PO-RALG. From this, we obtain information on personnel needs and allocations (for primary and secondary school teachers). We proxy personnel needs with the primary pupil–teacher ratio in 2018 and the secondary student–teacher ratio in 2018. We also use 2016 population data obtained from the National Bureau of Statistics. This is a projected population, because the latest population census in Tanzania was conducted in 2012.
Descriptive Statistics
Table 1 reports the summary statistics. On average, the central government's development funds to LGs fluctuated between 2016/2017 and 2019/2020. For example, the funds increased from 2.15 billion in 2016/2017 to 3.95 billion in 2017/2018 and then decreased slightly to 3.52 billion in 2018/2019 before falling further to 2.12 billion in 2019/2020. The average number of teachers posted to primary schools from 2018 to 2019 was 23.96, while that of teachers posted to secondary schools was 43.21 during the same period. Concerning financial prudence, Table 1 shows it has been increasing over time, as indicated by the percentage of LGs that got clean audit reports. For example, in 2014/2015 only 29 per cent of LGs got clean audit reports. A year later, in 2015/2016, the figure rose to 80 per cent, then further to 89 per cent in 2016/17 and to 95 per cent in 2017/2018, remaining at 95 per cent in 2018/2019. Regarding opposition support, on average, the opposition got 5.8 seats in LGs in the 2015 elections. In these elections, the share of opposition parliamentary votes was 42.82 per cent, while the opposition seat share in a council was 26.05 per cent. Finally, 17 per cent of the LGs were led by opposition parties.
In Table 2, we present the descriptive statistics of some key variables by whether the council (LG) is led by the opposition or not. As can be seen, there is no statistically significant difference in terms of the development funds released between councils led by the opposition and their counterparts led by CCM. However, in terms of the number of teachers posted to primary schools from 2018 to 2019, the difference between opposition-led councils and those led by CCM is statistically significant. This is also true regarding the difference in the number of teachers posted to secondary schools from 2018 to 2019. On average, the CCM-led councils had 47 primary and 20 secondary school teachers from 2018 to 2019, while those councils led by the opposition on average had 23 primary and 17 secondary school teachers during the same time period. Therefore, it seems that the allocation of both primary and secondary teachers tends to favour councils led by CCM.
Summary Statistics by Whether the Council is Led by Opposition.
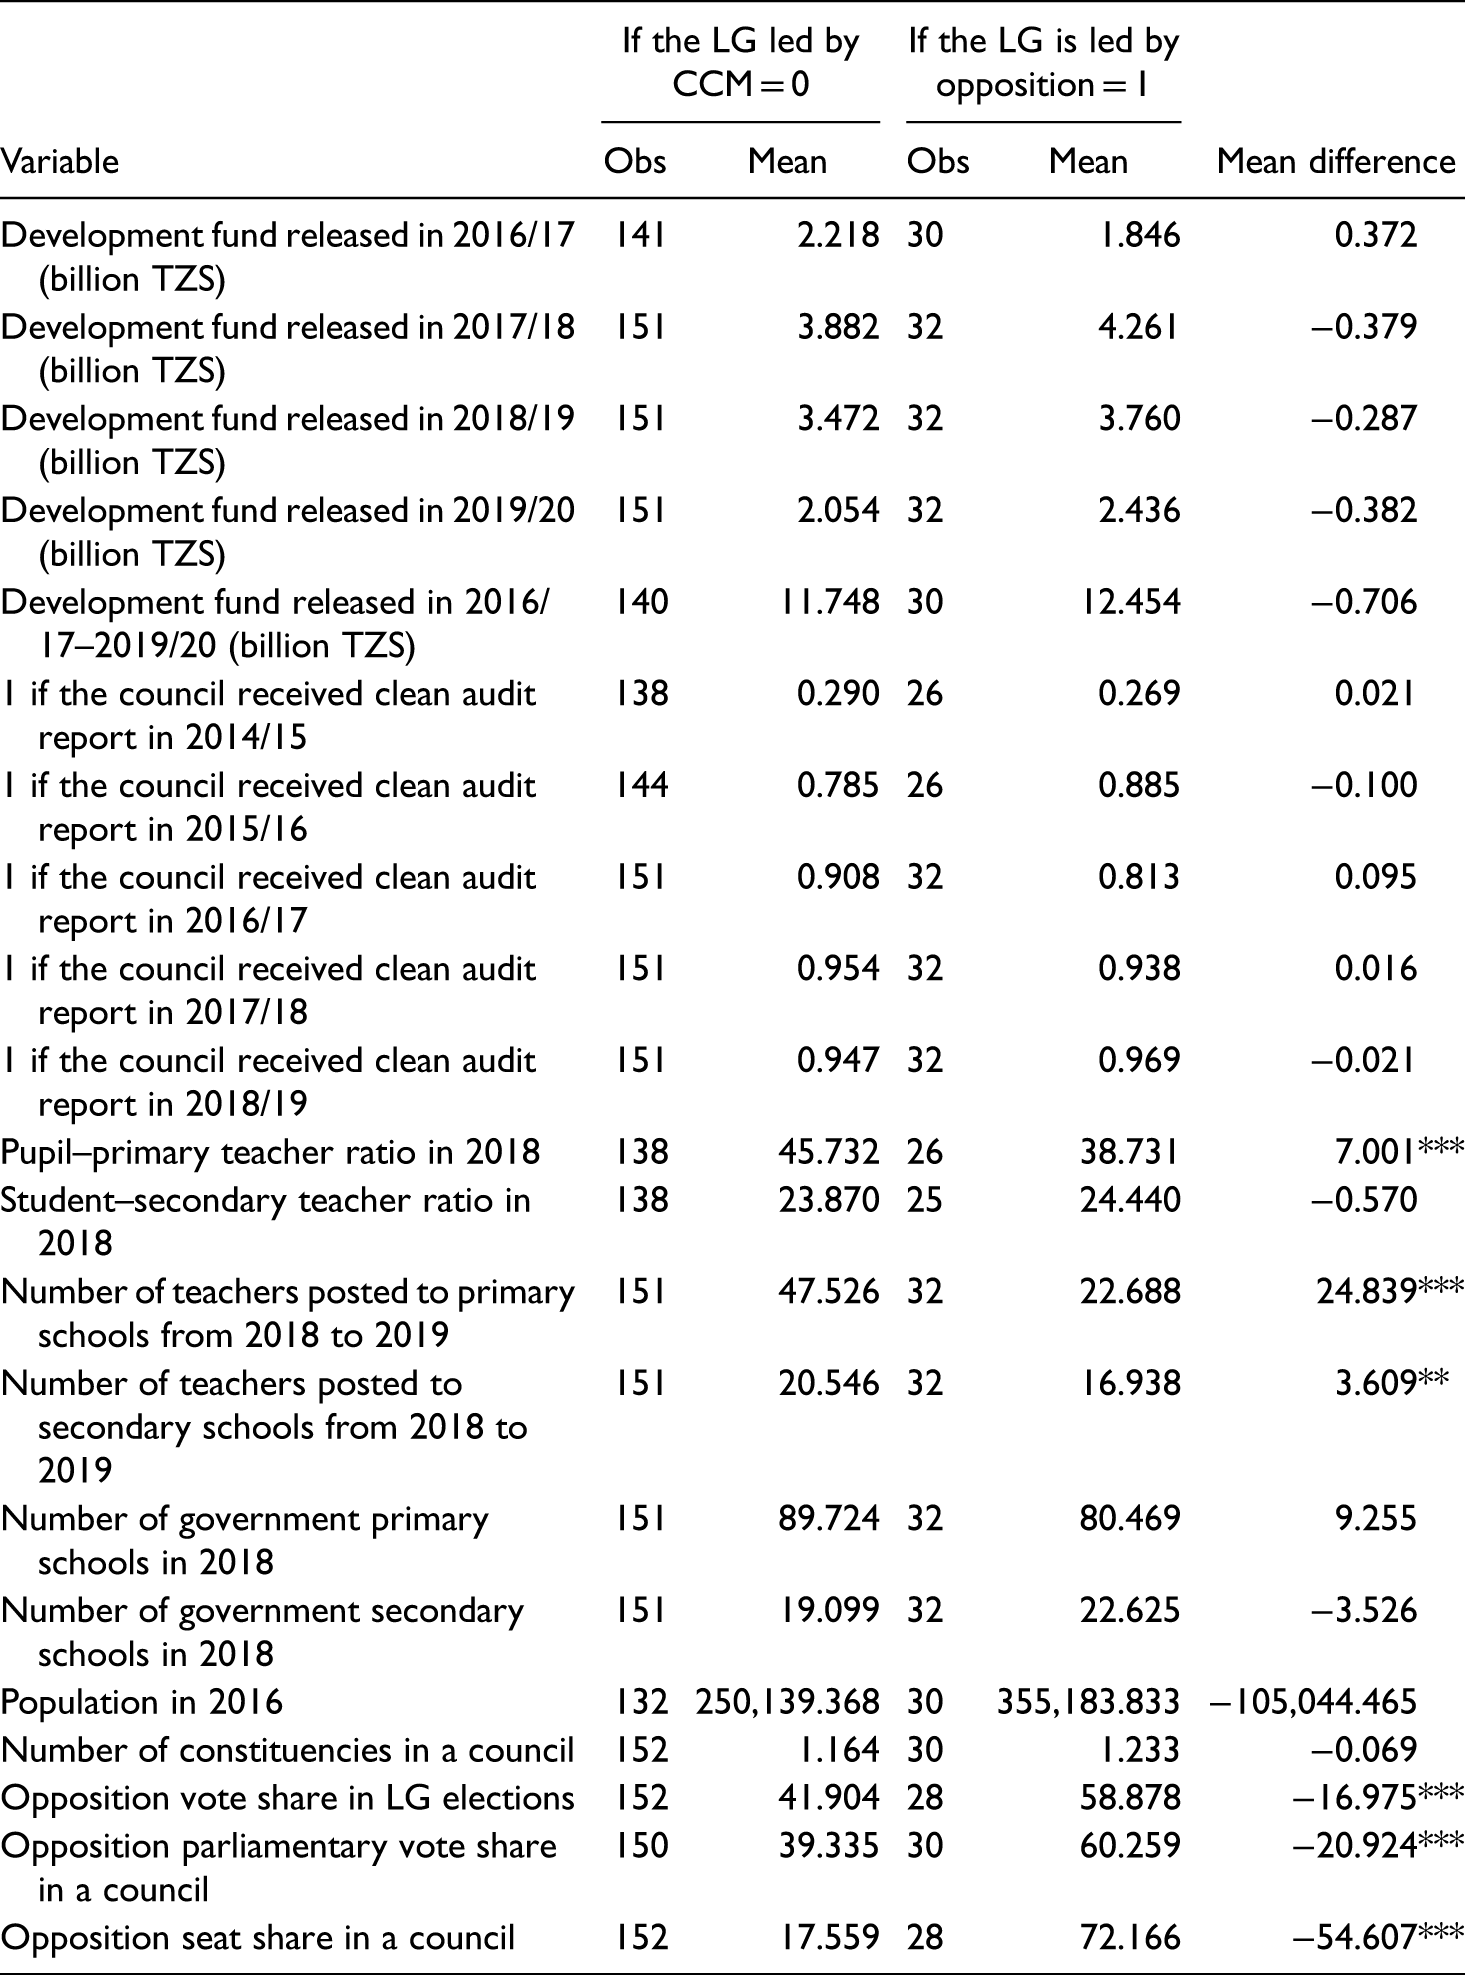
Overall, the descriptive statistics in Table 2 suggest there is no significant difference in allocation of financial resources between LGs led by CCM and those led by the opposition. On the other hand, they suggest significant differences in allocating human resources between CCM-led councils and those led by the opposition. More specifically, they suggest that the allocation of teachers disfavours LGs where opposition parties are strong. This provides a basis to perform rigorous analyses in the subsequent section.
Estimation Strategy
In this section, we develop two equations for our estimations. The first one is specified to examine the relationship between electoral support and allocation of financial resources to LGs. The second is specified to explore the relationship between electoral support and human resources allocation to LGs.
We begin the analysis by examining whether central government allocation of financial resources to LGs favours CCM or opposition strongholds. We use the Ordinary Least Squares (OLS) method. A major concern of using simple OLS is that our measures of opposition support are likely to be endogenous. Any endogeneity arising from the omitted variable problem or reverse causality could bias the estimates. We mitigate the omitted variable problem by controlling for a number of LG characteristics along with regional fixed effects by including regional dummies. Regarding reverse causality, the direction might be from financial resource allocation to opposition support – that is, LGs that receive few financial resources are more likely to reciprocate by voting for the opposition. In other words, it might not be electoral support that is affecting the allocation of financial resources but vice versa. However, reverse causality is not likely to be the case, because we measure electoral support by using the 2015 general election results, while allocation of financial resources is measured by using subsequent years. Therefore, it cannot be the case that allocation of financial resources in years after the 2015 general election may have influenced the 2015 general election results. However, admittedly, LGs that may have anticipated receiving little financial resources may have deliberately voted against the ruling party. Therefore, endogeneity arising from reverse causality remains a genuine concern. Our estimation results, therefore, should not be interpreted as causal effect, but correlation. To this end, we estimate the following OLS model:
To examine whether central government allocation of human resources to LGs favours either CCM-led or opposition-led LGs, we estimate the following model:
For reasons analogous to those explained in the context of equation (1), our measures of opposition support are likely to be endogenous due to problems with omitted variables or reverse causality. We mitigate the former by controlling for several LG characteristics along with regional dummies. Concerning reverse causality, as explained earlier, we argue that it is unlikely, because we measure electoral support by using 2015 general election results while human resource allocation is measured by using 2018 and 2019 measures. Therefore, it cannot be the case that human resource allocation in 2018 and 2019 may have influenced the 2015 general election results. However, we cannot confidently rule out the possibility of endogeneity arising from reverse causality. For example, people in LGs that may have anticipated receiving fewer human resources may have deliberately chosen to vote against CCM. Therefore, endogeneity arising from reverse causality remains a genuine concern. In this regard, our estimates should offer insight into correlation.
Results and Discussion
Financial Resource Allocation and Electoral Support
Table 3 reports the estimation results of the relationship between financial resource allocation and opposition support. Specifically, it presents the estimation of the relationship between electoral support and per capita development funds released in four consecutive financial years after the 2015 general election in Tanzania (equation (1)). We use four different measures of electoral support: opposition vote share in an LG, opposition parliamentary vote share in a district, opposition seat share in a council, and whether the LG is led by the opposition party. As demonstrated, financial resource allocation does not appear to have any significant relationship with opposition support (columns (1)–(16)). In columns (1)–(4), we use per capita development funds released to LGs in the 2016/2017 financial year. In columns (5)–(8), the outcome variable is log per capita development funds released to LGs in the 2017/2018 financial year, while in columns (9)–(12), the outcome variable is log per capita development funds released to LGs in the 2018/2019 financial year. Finally, in columns (13)–(16), the outcome variable is log per capita development funds released in the 2019/2020 financial year. In all columns, it can be seen that there is no significant relationship between opposition support and financial resource allocation. These results suggest no significant difference in financial resources allocated by the central government to opposition LGs and those led by CCM. Put differently, the results in Table 3 suggest that there is no bias in financial resource allocations to LGs in Tanzania. The findings are in accordance with those of Allers and Ishemoi (2011a), who also found that the allocation of financial resources to LGs neither favours opposition nor ruling-party strongholds.
OLS Estimates of the Correlation Between Per Capita Development Funds Released and Opposition Support.
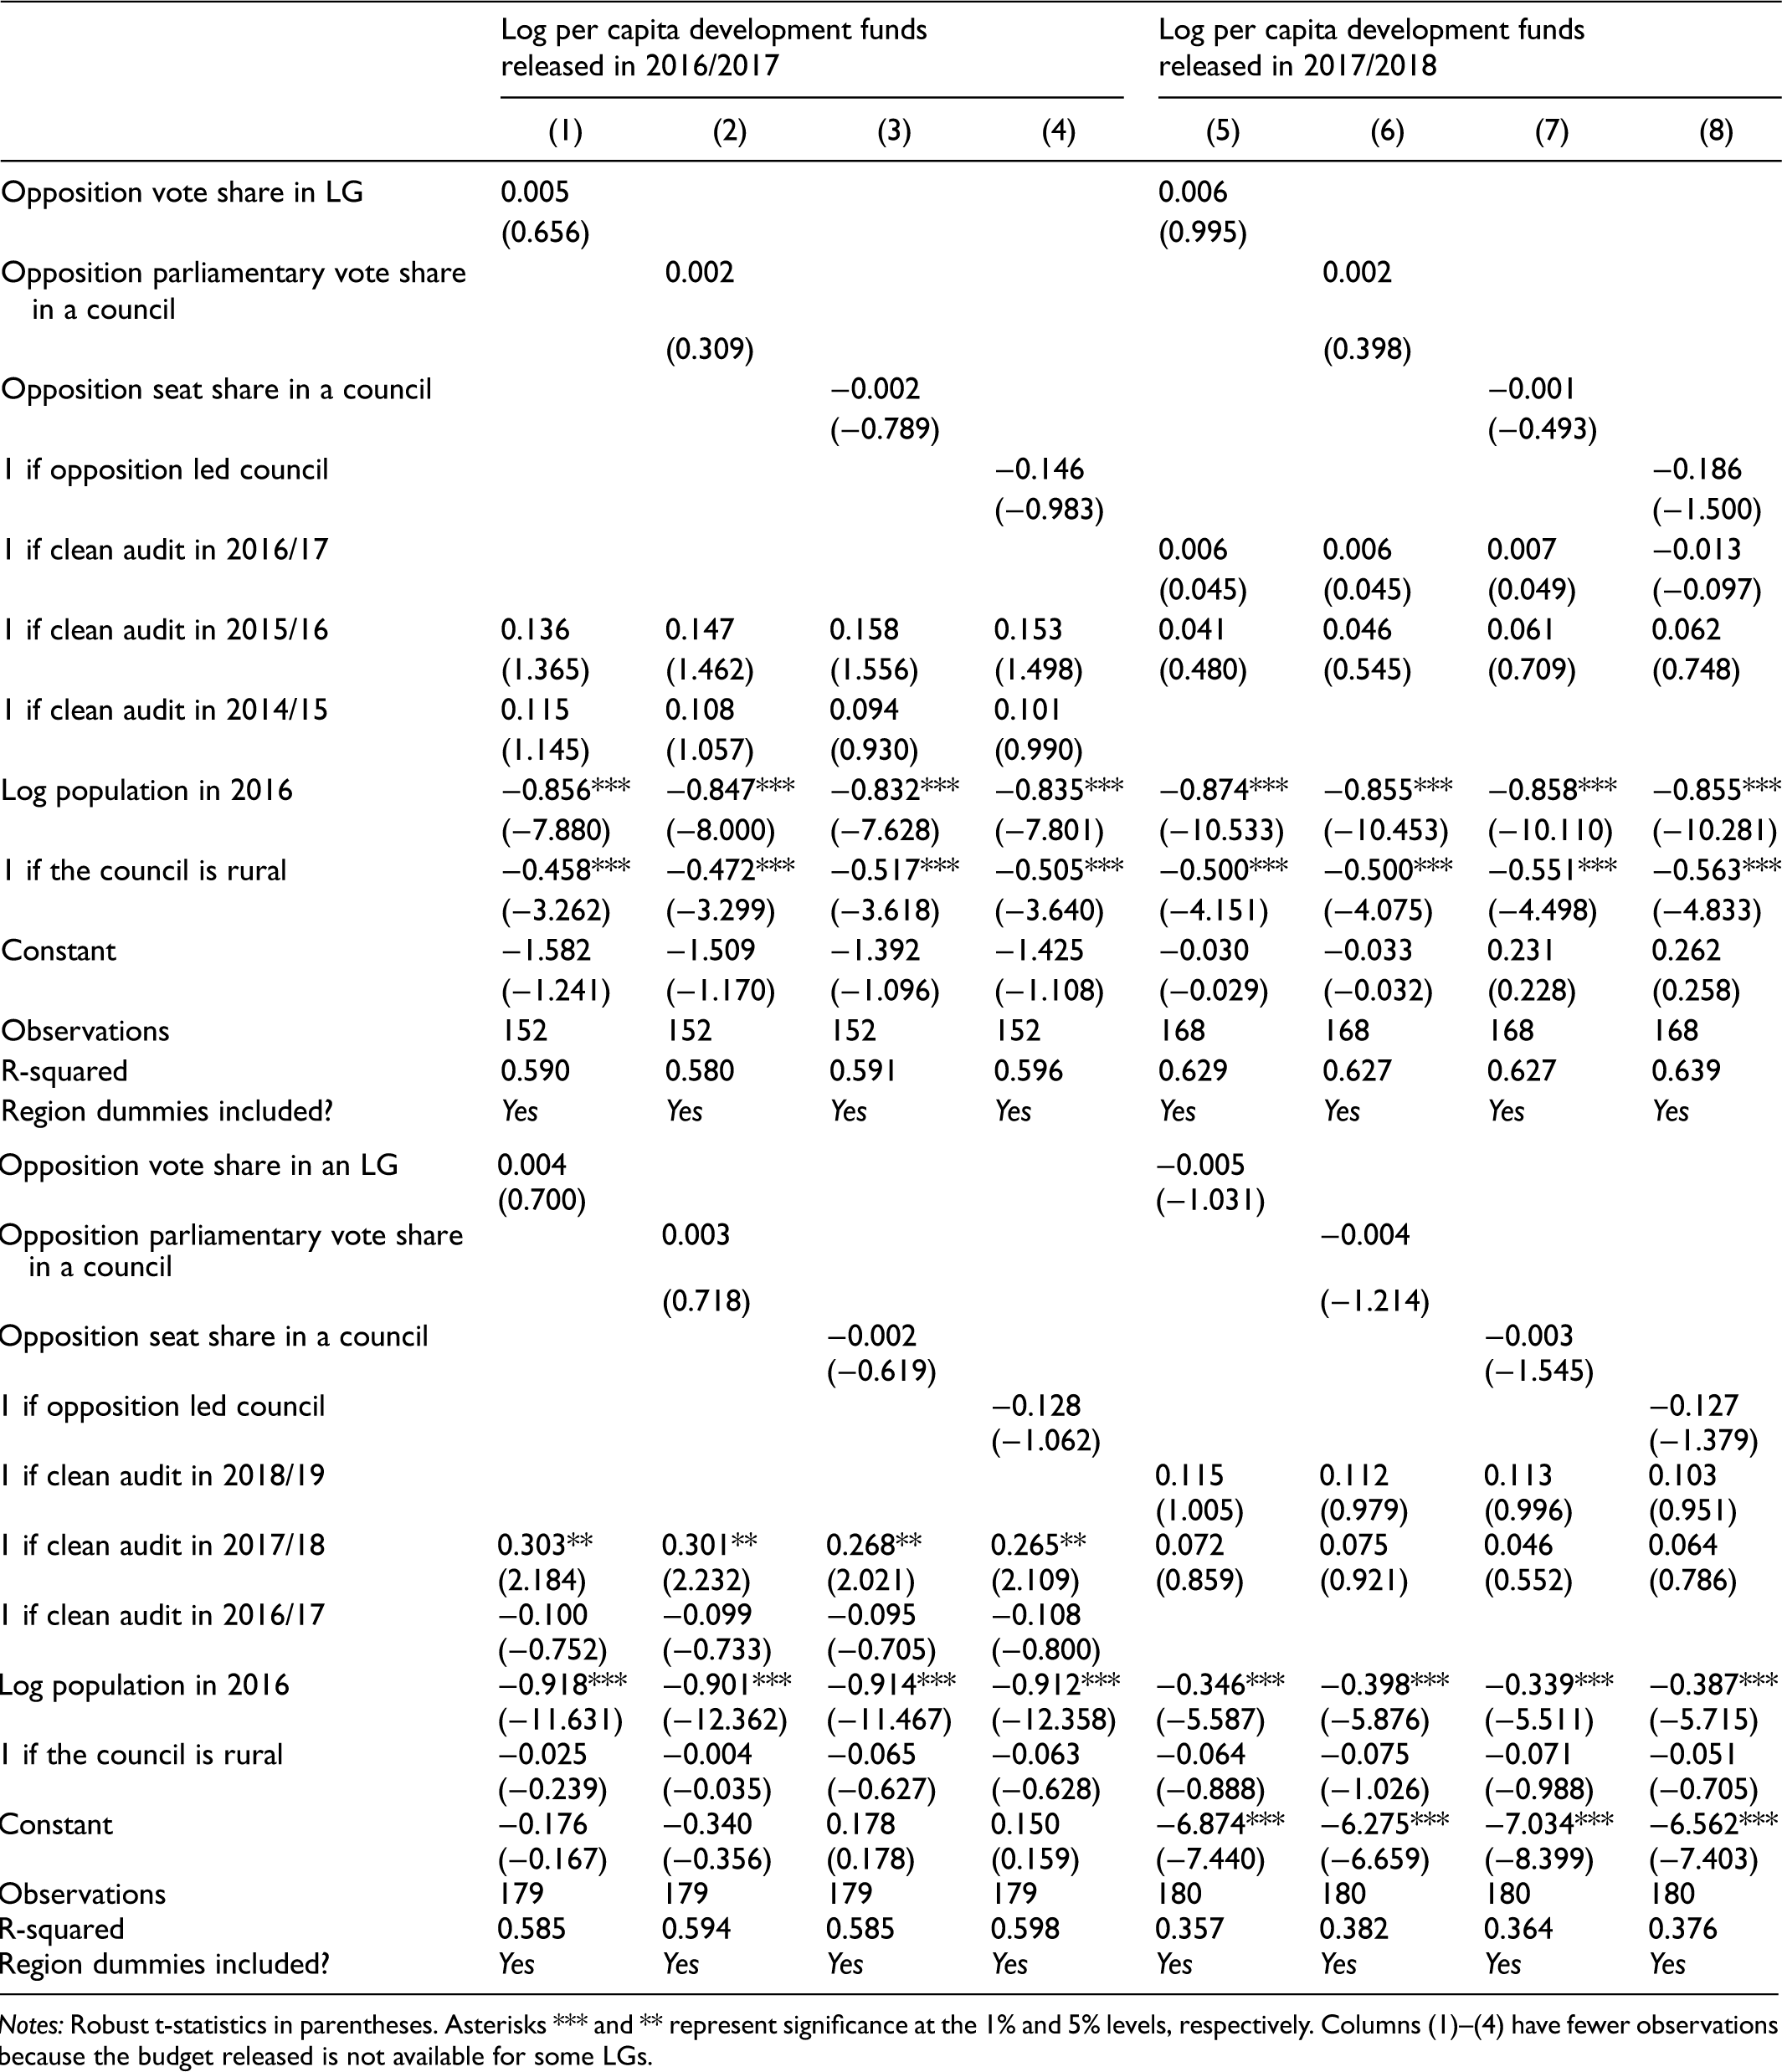
Notes: Robust t-statistics in parentheses. Asterisks *** and ** represent significance at the 1% and 5% levels, respectively. Columns (1)–(4) have fewer observations because the budget released is not available for some LGs.
To check the robustness of the above results, in Table 4 we present the results of the relationship between financial resource allocation and opposition support. Unlike in Table 3, the outcome variable is log per capital cumulative development funds released to LGs from 2016/2017 to 2019/2020 (equation (1)). In odd-numbered columns, we include no controls. In even-numbered columns, we include relevant controls and region dummies. In columns (1) and (2), we use opposition vote share in an LG as a measure of opposition support. As shown in the table, the estimated magnitudes of the coefficients are similar and insignificant across the models with and without controls – columns (1) and (2), although they bear different signs. In columns (3) and (4), we use opposition parliamentary vote share in a council as a measure of opposition support. These alternative specifications tell the same story. In columns (5) and (6), we use opposition seat share in a council, while in columns (7) and (8) we use a dummy equal to ‘1’ if the council is led by the opposition as measures of opposition clout. In these specifications (columns (5)–(8)), although the signs of the coefficients are negative, they are largely insignificant. On the whole, the results in Table 4 corroborate those of Table 3. This further provides suggestive evidence that there is no bias in the allocation of financial resources by the central government to LGs in Tanzania.
OLS Estimates of the Correlation Between Per Capita Development Funds Released and Opposition Support.
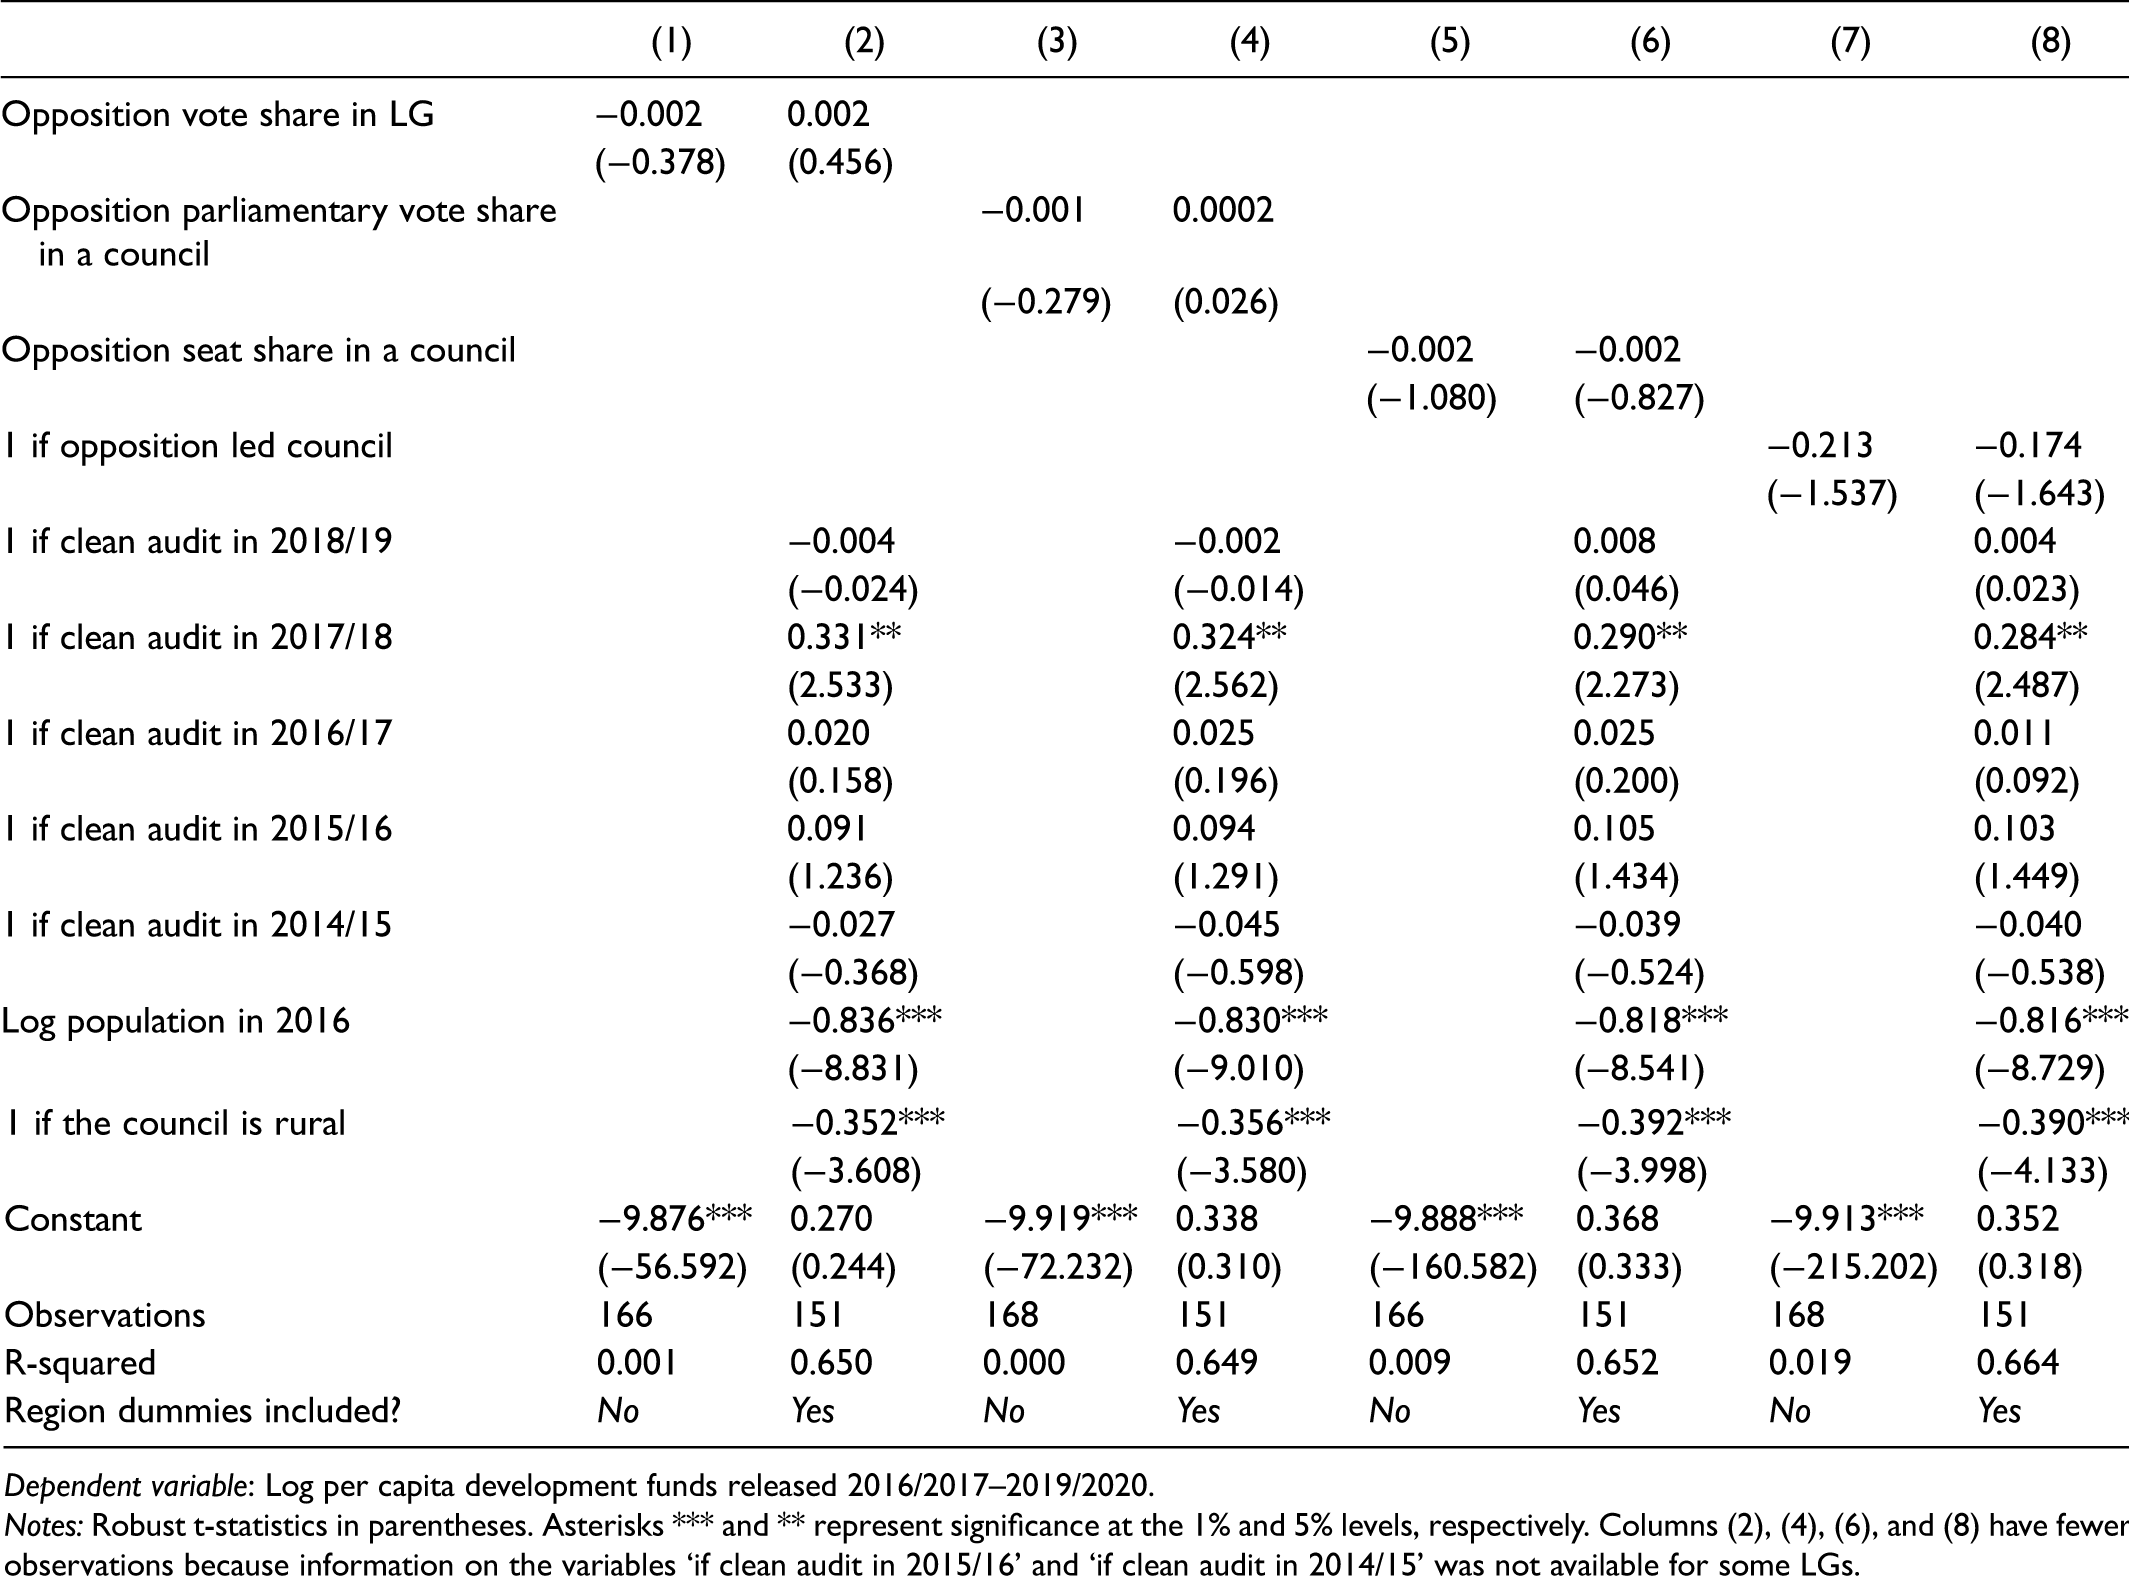
Dependent variable: Log per capita development funds released 2016/2017–2019/2020.
Notes: Robust t-statistics in parentheses. Asterisks *** and ** represent significance at the 1% and 5% levels, respectively. Columns (2), (4), (6), and (8) have fewer observations because information on the variables ‘if clean audit in 2015/16’ and ‘if clean audit in 2014/15’ was not available for some LGs.
This study's findings reinforce those by Carlitz (2017), who also finds that intergovernmental transfers do not follow a political bias logic. However, the results are in contrast to those documented by Rosenzweig (2015) and Weinstein (2011) as well as McLellan (2020). There are several explanations as to why this might be the case: First, Rosenzweig (2015) and Weinstein (2011) use data collected before Tanzania had introduced a formula-based system of grant allocation, or before this system had taken off. 17 Since 2004, the country has adopted grant allocation formulas based on experts’ opinions concerning regional spending needs. Second, the enormous powers of the executive branch in Tanzania give it leverage to allocate discretionary funds to an LG outside the ordinary central–local fiscal transfer system. Such allocations have not been captured in our analysis. Third, since the purpose of deploying fiscal transfer as a punitive strategy is to deter opposition influence, the ruling party may still not choose to use it if there are other more effective strategies at its disposal. 18 Studies have reported a wide range of strategies the incumbent regime in Tanzania uses to stifle the opposition while fostering its hegemony (Cheeseman et al., 2021; Croke, 2017; McLellan, 2020; Paget, 2017, 2021). Three of those are relevant to our explanation: one is violence and repression; two is political encroachment on the opposition's LG autonomy including in determining how council resources are allocated at the sub-district level; and three is recentralisation of local capacity, rendering LGs dependent on discretionary allocations (McLellan, 2020). Rather than relying on distributive politics, CCM might have exploited these strategies to counter the opposition threat.
A fourth explanation for CCM's allocative behaviour might be historical. Historically, Tanzania has been an egalitarian state committed to social policy that aims to reduce inequalities between individuals and regions (Court, 1976; Kessler, 2006). Since CCM had been the only ruling party in the country, the path dependency of its social policy is likely to continue committing it to equitable resource distribution among regions and LGs without regard to opposition threat.
Human Resource Allocation and Electoral Support
Table 5 reports the results for the relationship between the per capita teachers posted to primary schools from 2018 to 2019 and opposition support (equation (2)). For each measure of opposition support, we estimate three different specifications – without controls, with controls, and with both controls and regional dummies. Column (1) shows that the opposition vote share in an LG is statistically significant and negatively correlated with per capita teachers posted to primary schools. Specifically, a 1 per cent increase in the share of opposition votes in LG decreases per capita primary teachers posted by about five. Although the signs of the coefficients remain the same in columns (2) and (3), the magnitude of the coefficients becomes lower – and insignificant after including controls and regional dummies.
OLS Estimates of the Correlation Between Teachers Posted to Primary Schools from 2018 to 2019 and Opposition Support.
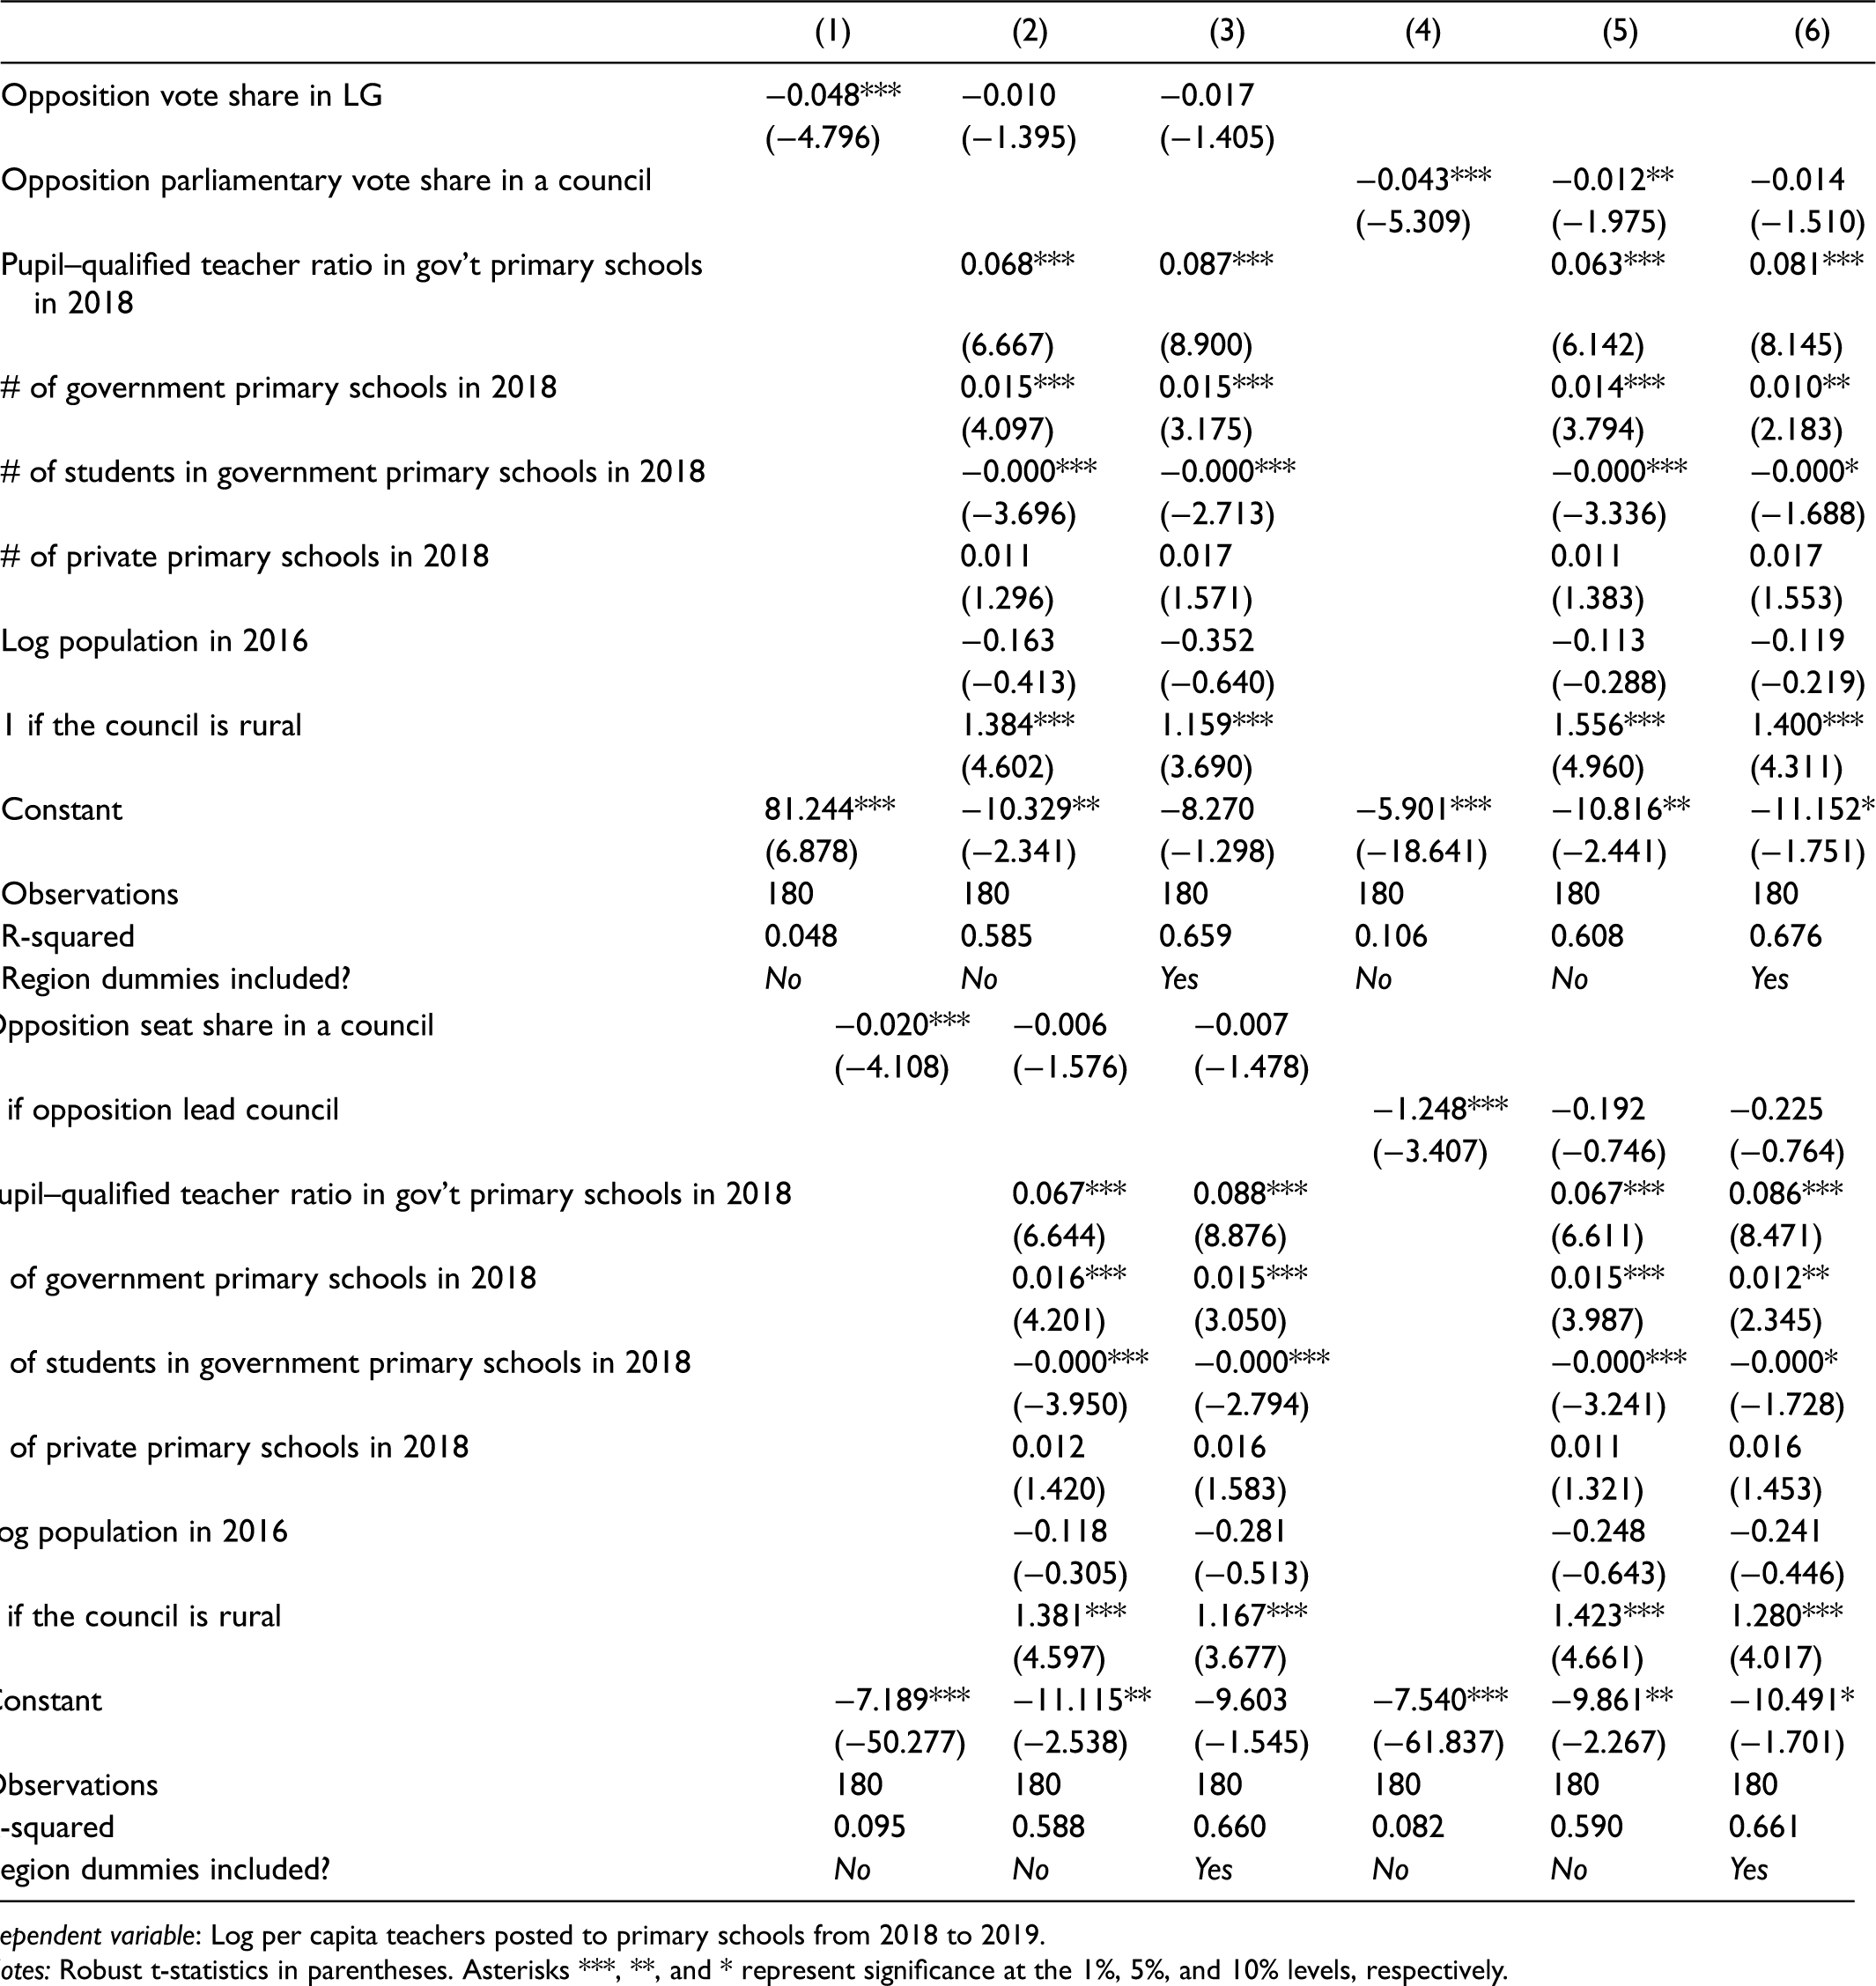
Dependent variable: Log per capita teachers posted to primary schools from 2018 to 2019.
Notes: Robust t-statistics in parentheses. Asterisks ***, **, and * represent significance at the 1%, 5%, and 10% levels, respectively.
Next, in columns (4)–(6), we use opposition parliamentary vote share in a council as a measure of opposition support to check the robustness of the results. In column (4), where no control is included, the relationship between per capita teachers posted to primary schools and opposition parliamentary vote share in a council is negative and statistically significant. The results in column (4) show that a 1 per cent increase in the share of opposition parliamentary votes in a council decreases the per capita primary teachers posted by about four. With inclusion of controls in column (5), although the magnitude of the coefficient goes down, the relationship bears the same sign and is statistically significant at 5 per cent. However, in column (6) (our preferred specification), although the coefficient bears the same sign, the significance disappears when we include regional fixed effects.
To further check the robustness of the results, in columns (7)–(9), we use an alternative measure of opposition support – opposition seat share in a council. Column (7) shows that opposition seat share in a council is negatively associated with per capita teachers posted to primary schools. To be precise, a 1 per cent increase in the share of opposition seats in a council decreases the future per capita primary teachers posted by two. In columns (8) and (9) (our preferred specification), the magnitude of the coefficients largely shrinks and the statistical significance disappears although the sign of the coefficient remains the same. Finally, in columns (10)–(12), we measure opposition support by using a dummy variable equal to ‘1’ if the council is led by the opposition party and ‘0’ otherwise. As in the first three measures of opposition support, the relationship is negative and statistically significant in the first column – column (10). However, in our preferred specification – column (12) – although the sign of the coefficient remains the same, the statistical significance observed earlier disappears once we include regional fixed effects.
Table 6 presents the estimation results of the relationship between per capita teachers posted to secondary schools from 2018 to 2019 and opposition support. In columns (1)–(3), we use opposition vote share to measure opposition support. In column (1), we see that our explanatory variable of interest – opposition vote share – is negative and significantly correlated with per capita teachers posted to secondary schools. A 1 per cent increase in opposition vote share in the LG decreases per capita teachers posted to secondary schools by about two. With inclusion of controls in column (2), the relationship is still negative but less precise. However, after inclusion of regional fixed effects in our preferred specification – column (3) – the statistical significance disappears, although the sign of the coefficient remains negative.
OLS Estimates of the Correlation Between Teachers Posted to Secondary Schools from 2018 to 2019 and Opposition Support.
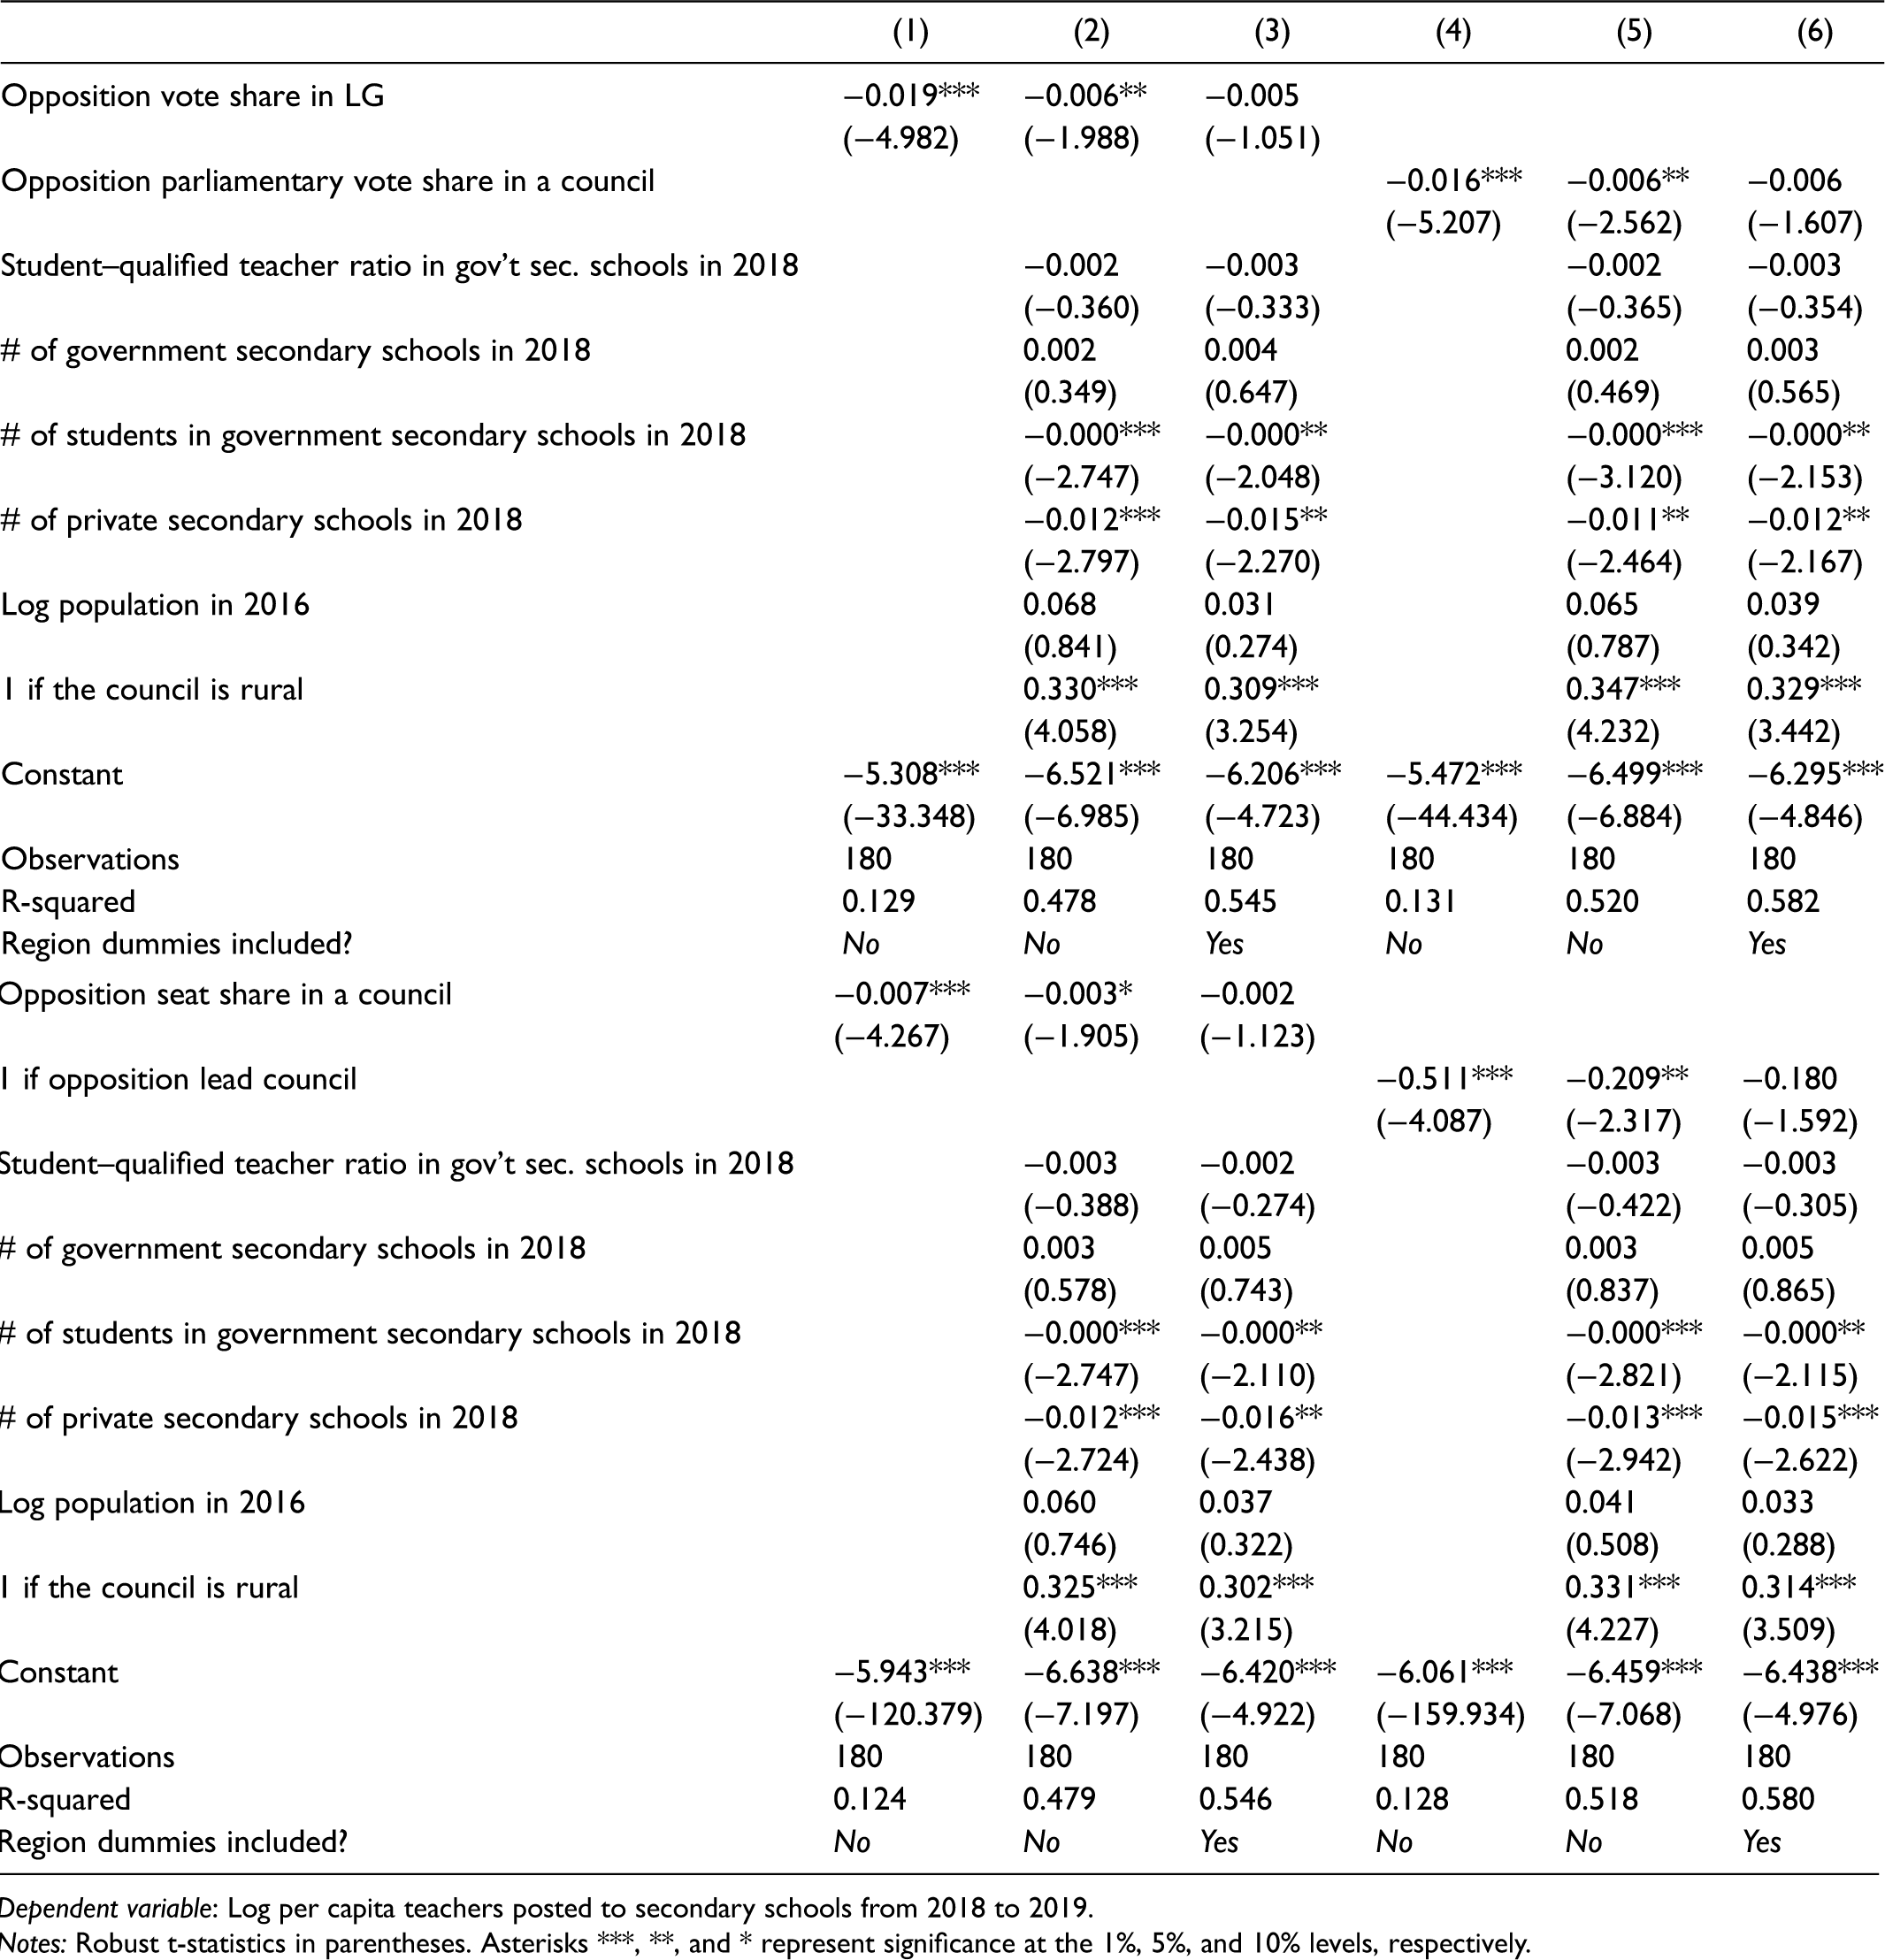
Dependent variable: Log per capita teachers posted to secondary schools from 2018 to 2019.
Notes: Robust t-statistics in parentheses. Asterisks ***, **, and * represent significance at the 1%, 5%, and 10% levels, respectively.
In columns (4)–(6), we use opposition parliamentary vote share in a council to measure opposition support. In columns (4) and (5), the relationship is negative and statistically significant at 1 and 5 per cent, respectively. In both columns, the results indicate that a 1 per cent increase in the share of parliamentary votes in a council decreases per capita secondary teachers posted by about one. In column (6), our preferred specification, the significance disappears once we include regional fixed effects, but the effects are in the same direction. In columns (7)–(9), we use an alternative measure of opposition support: opposition seat share in a council. In column (7), the relationship is negative and statistically significant at 1 per cent. The magnitude of the coefficient indicates that a 1 per cent increase in the share of opposition seats in a council decreases per capita teachers posted to secondary by about seven. In column (9), which is our preferred specification, although the relationship remains negative, it is not statistically significant at any acceptable level.
Finally, in columns (10)–(12), we measure opposition support by using a dummy equal to ‘1’ if the council is led by the opposition party and ‘0’ otherwise. In column (10), we include no controls. As can be seen, the result is negative and statistically significant at 1 per cent. In column (11), we include control variables; the sign remains the same but statistical significance becomes imprecise. Similarly, in column (12), our preferred specification, although the sign remains the same, the coefficient is not statistically significant. On the whole, the results in Table 6 corroborate those of Table 5. Taken together, the results indicate that there is no significant negative relationship between opposition support and human resource allocation to LGs. Thus, the results from our analysis provide no strong evidence to suggest any political bias in human resource allocation to LGs.
Conclusion and Implications
The literature on how incumbent governments allocate resources suggests two conflicting explanations: (i) more resources will be allocated to highly competitive districts to target swing votes, and (ii) hegemonic party systems employ a punishment strategy by allocating resources to supportive districts. Tanzania exhibits the features of a hegemonic party – albeit one that it has experienced threatening competition, especially since the 2015 elections. This study has examined the Tanzanian government's distributive behaviour after the 2015 election, the most competitive in its history. In the same election, CCM witnessed a significant narrowing of its electoral margin and a loss of key municipalities and major cities.
The article began with an examination of the relationship between electoral support and the allocation of financial resources to LGs and then the allocation of human resources. Contrary to the hegemonic-party and the swing-vote hypotheses, we find no bias between the amount of fiscal resources transferred to LGs led by CCM and those led by the opposition. The results are robust across different specifications and measures of electoral support. Therefore, increased opposition support in a district neither favours nor disadvantages that district in terms of government allocation. At a quick glance, these results suggest that intergovernmental transfers in Tanzania are inclined to neither the hegemonic-party nor the swing-vote hypothesis. However, our results should be cautiously interpreted for the following reasons: First, the paper analyses only some types of resource allocation in Tanzania. It is possible that resources beyond those analysed here are allocated according to voting patterns. Therefore, the evidence here neither confirms nor disconfirms the hegemonic-party or the swing-vote hypotheses in their entireties – rather, it addresses these only in regard to resources channelled to LGs through conventional budgetary allocations. Second, the fact that we find no strong evidence does not necessarily suggest that the opposition in Tanzania is ‘weak’; likely, it demonstrates that the ruling party uses other strategies to effectively deter opposition influence without relying on distributive politics. In addition, CCM's choice of the distributive strategy may be constrained by the historical path it has taken in allocating resources to LGs since the single-party period.
Regarding human resource allocation, in our preferred specifications we find a negative but insignificant relationship between the allocations of both primary and secondary school teachers to LGs and opposition support. The results indicate no significant negative relationship between opposition support and human resource allocation to LGs. Thus, the results from our analysis also provide no strong evidence to suggest political bias in human resource allocation. Instead, the allocation seems to follow the logic of the rural–urban divide, with more teachers being posted to rural councils. This is so because of the high scarcity of teachers in rural as opposed to urban districts. It is, however, worth mentioning this article's focus was limited to allocation of primary and secondary school teachers. But the central government does allocate human resources to LGs in other sectors, such as health. Therefore, our analysis of the allocation of primary and secondary school teachers is not necessarily representative of larger patterns. In addition, Tanzania has a higher shortage of teachers in Science, Technology, and Mathematics (STEM) as compared to arts subjects. Politicised allocation might occur among STEM teachers. Future research on teacher allocation may focus on this.
One key implication is drawn from the findings above: hegemonic parties do not necessarily adopt a discriminatory strategy in resource allocations, even when facing a threatening opposition. This lack of discriminatory allocation is likely to be possible when (a) the hegemonic party has a wider menu of autocratic actions to enable it to deter the opposition influence and enhance its hegemony without needing to resort to distributive measures, or (b) the historical path dependence in the government's social policy leads the party to non-discriminatory allocations. Our findings should be interpreted in regard to intergovernmental (central–local) and not sub-district allocations. The evidence on politicised allocations at the sub-district level remains compelling (see, e.g., Carlitz, 2017 and McLellan, 2020) as no study has so far revealed contradictory results.
Footnotes
Declaration of Conflicting Interests
The author(s) declared no potential conflicts of interest with respect to the research, authorship, and/or publication of this article.
Funding
The author(s) received no financial support for the research, authorship, and/or publication of this article.