
Abstract
Traditionally, economists measure middle class from the income perspective. Considering quality of data for many African countries, relying solely on income may, unfortunately, lead to an incorrect picture. This article compares and analyses the African middle class measured by income and by ownership of assets. Results indicate that middle class sizes differ significantly in some countries, while in others they are more or less the same. Regression analyses performed to investigate potential correlates of the African income and assets middle class sizes indicate that the African assets middle class size is positively associated with income per capita and negatively with assets inequality. To a lesser extent, it is positively affected by education and negatively by ethnic fractionalisation. The African income middle class size depends positively on income per capita and education, while negatively on income inequality.
Keywords
Introduction
The debate on how large the middle class is in developing countries, or in Africa in particular, has been going on for some time. The worldwide interest has been provoked mostly since the 1990s with the rapid evolution of the middle class in some Asian and Latin American countries. Another factor was the rising number of studies underlying the role of the middle class in economic development (e.g. Chun et al., 2017). This development has further encouraged research on how to eventually define the middle class and how to measure its size in developing countries' context, especially when the measurements applied in developed countries fail to provide a correct picture.
Despite the recent interest and development, there is no single widely held definition of the middle class. Sociologists have paid much attention to conceptualise it in relation to other social classes. Neo-Weberian and Neo-Marxist theories of class represent two influential perspectives on the middle class. Both emphasise the importance of market capacities in shaping life opportunities and how the middle class differs from the working class and the upper class in this dimension (Fitzpatrick, 2012). However, while Max Weber and his followers attempt to answer the question of ‘in the middle of what’ the middle class is, Neo-Marxists tend to explain the relationship between the means of production and the middle class structure. French sociologist Pierre Bourdieu is to some extent linking these two. While examining the French educational system and introducing the concept of ‘cultural capital’, Bourdieu argues that middle- and upper-class students were more likely to persist in school, attain credentials and become part of the middle or upper class themselves upon adulthood, reinforcing stratification in society. According to Bourdieu, it is indeed the educational system which reproduces the existing social class and does not serve, as naturally expected, as a social mobility factor (Dumais, 2015).
Economists tend to simplify the concept of middle class in order to be able to measure its size. Typically, they measure middle class using income (or expenditure on consumption) of households or individuals as a particular (middle) section of an income distribution or as a certain interval around the mean or median income. The size of the middle class is then measured as a proportion of households or individuals that fall into such a section or interval. However, narrowing down the middle class to merely income (flow) measures does not reveal much about the actual material living conditions of households (stock) in the relevant income (consumption) brackets (Wietzke and Sumner, 2014). Unfortunately, the available evidence on middle class in developing countries so far has been based largely on per capita income (or consumption expenditure) collected through large budget surveys (Shimeles and Ncube, 2015). In case of Africa, this is even more precarious since (income) data of many African countries are either unavailable, or inconsistent (Jerven, 2013). Various attempts to measure the middle class by other than income measures exist (Shimeles and Ncube, 2015; Thurlow et al., 2015, etc.), but these focus rather on creating new measures of the middle class in different developing countries and regions, than on comparison of various approaches and investigation of differences between them. Similarly, the existing research does not explain why results among different measures vary, and what the implications are for policies.
Our research aims to fill this gap. We acknowledge that the middle class could (and should) be measured by a multidimensional set of criteria. In order to explore disparities between a differently measured middle class, we have decided to compare the African middle class measured by income and ownership of assets. The selected approach allows us to anchor the discussion about differences in results of middle class measurements into a more clearly defined framework. Our aim is to investigate to what extent the middle class measured by income and by ownership of assets vary in size. As a sample, we have chosen all African countries for which data are available.
For the purpose of our research, we construct and work with income middle class (measured by households’ income) and assets middle class (measured by households’ assets ownership). We explore in which African countries assets are more or less equally distributed when compared to income, how this affects the size of the middle class according to these measures and whether there is an association between inequalities and the income- and assets middle class size. We also identify countries where large shares of people are classified as income middle class while they do not belong to the assets middle class (and vice versa). We also investigate to what extent the composition of income- and assets middle class differ according to the three main middle class sub-categories defined by the African Development Bank (AfDB, 2011): the floating, lower- and upper-middle class and how the differences in both middle class sizes change when the floating middle class is excluded. And last but not least, we explore potential correlates of (1) the assets middle class size, (2) the income middle class size and (3) the differences between them. For this reason, we work with variables such as the quality of governance, GDP per capita, education, ethnic fractionalisation, population, income inequality and assets inequality. We believe that analysing such differences between various measures of the middle class could have significant policy implications.
The article is organised as follows. First, we review literature that deals with various approaches to measuring middle class. This is done to point at some methodological concerns when measuring the middle class, especially in low-income countries such as Africa where the most challenges prevail in this regard. Then we describe the data we work with and the methods and procedures we use to construct the African income middle class and the African assets middle class. The subsequent section presents and discusses the results of our comparative and regression analyses. The final section summarises our main conclusions.
Literature Review
Typically in economics the middle class is measured by income (or expenditures on consumption) within some interval. Unfortunately, there is no agreement among scholars on such an interval (see discussion on this issue for example, in Melber, 2017 or Southall, 2018). For example, Ravallion (2009) prefers to use the income median per capita (and not the mean income) and the symmetric interval in the income space around it. Such an approach has been applied by Thurow (1987) and Birdsall (2010) who both define the space around from 75 per cent to 125 per cent of the country's income median per capita. Others, such as Barro (2000) defines the space between the second- and fourth-income quintiles, and Alesina and Perotti (1996) define the space between the third- and fourth-income quintiles. Applying relative approach may, however, cause some problems.
As shown in the research by Banerjee and Duflo (2008), such an approach can bear the risk that the middle class defined in relative terms can be so poor in absolute terms (in some low-income countries) that it may entirely fall under the international poverty line. Therefore, some researchers incline to construct absolute thresholds of income to measure the middle class in low-income countries, usually with a minimum level of income per capita of USD 2 per day. Again, there is no agreement on such interval. Banerjee and Duflo (2008) define the range of USD 2–10 per day, while Ravallion (2009) uses a definition of USD 2–13 per day. Considering international standards, a thus defined middle class is actually very poor. In most developed countries people with USD 2–10 per day would be considered extremely poor. This led others, for example, Birdsall (2010), to measure the middle class in developing countries with the minimum income per capita bound to USD 10 per day. At the same time, Birdsall set the upper threshold at the 95th percentile of the income distribution of a country, since setting an absolute upper threshold bears the risk that there may be no upper class in countries with very low income.
Unfortunately, methodological and measurement issues are not the only challenges researchers on the African middle class face. There are also problems with availability and reliability of income (or consumption) data for African countries (Jerven, 2013). This situation has led some researchers to explore alternative approaches to measuring the middle class. One of them is the self-identification approach used as a supplementary technique by HCP (Le Haut Commissariat au Plan) in Morocco. It assumes that each head of a family associates himself/herself with a given social class (Boufous and Khariss, 2015). 1 However, for example, as outcomes of a research study from Soweto in South Africa indicate, people often tend to identify themselves as middle class as they see themselves richer than the poor and poorer than the rich (Alexander et al., 2013). Because of this, some researchers prefer to apply other criteria to measure the middle class.
For example, Thurlow et al. (2015) choose the three following criteria: (1) head of the household or her spouse has finished all levels of secondary education, (2) they all reside in housing with decent amenities and (3) head of the household or her spouse is employed in a skilled, non-farm sector. Another perspective presented by Shimeles and Ncube (2015) calls upon the fact that the middle class owns certain assets which the poor people do not have access to. They introduce the concept of measuring the middle class based on evaluating a ‘decent housing environment’, which differentiates poor people from the middle class. They construct an assets index based on responses to the following questions: (1) sources of water for households (such as pipe water, tap water, water kiosk, well, etc.), (2) conditions of housing (number of rooms, floor material – parquet, cement, ceramic, earth – roof material – bricks, tin, grass, earth, etc.), (3) access to electricity and (4) ownership of durable assets (radio, television, refrigerator, and car). Generally, ownership of assets (housing, durables, etc.) is often used to measure welfare of households (or individuals). In the developing countries’ context, the ownership of assets has also been applied to concepts of poverty and pro-poor growth (see, for example, Ezzrari and Verme, 2012; Oyekale and Oyekale, 2013 and Cardozo and Grosse, 2009).
Measuring the Middle Class: Methods, Data and Procedures
The aim of our research is to investigate to what extent the middle class measured by income and by assets differ in size across individual African countries. To construct the African income middle class, we use income data available from the World Bank’s PovcalNet (2018). To construct the African assets middle class, we create our own assets index inspired by Shimeles and Ncube (2015) using data from the Demographic and Households Surveys (DHS) (United States Agency for International Development (USAID), 2018). On both types of data, we subsequently apply the same absolute thresholds to measure the middle class.
To set the absolute thresholds, we have found inspiration in the African Development Bank (AfDB) classification which measures the middle class as people living on between USD 2 and 20 per person per day (2011). The Bank further splits the middle class into three sub-categories: (1) the floating middle class with income between USD 2 and 4 per person per day, (2) the lower-middle class with income between USD 4 and 10 per person per day and (3) the upper-middle with income between USD 10 and 20 per person per day. The AfDB defined these thresholds in 2011; however, the World Bank changed its absolute definition of extreme poverty from USD 1.25 per person per day to USD 1.90 in 2015 and also adjusted all income data in the PovcalNet database from 2005 constant prices to 2011 constant prices. Therefore, for the purpose of our research we have adjusted the AfDB thresholds accordingly, multiplying them by 1.52 (i.e. 1.90/1.25). This means that after the adjustment we work with the following sub-categories of the middle class: the floating middle class with income between USD 3 and 6 per day, the lower-middle class with income between USD 6 and 15 per day and the upper-middle class with income between USD 15 and 30 per day. For comparison, the Economic Commission for Latin America and the Caribbean (ECLAC) works with USD 5.50–13 per day for vulnerable middle class and USD 13–70 per day for middle class in Latin America (Organization for Economic Cooperation and Development (OECD), 2019). So, even if the range of USD 6–30 per day for the lower- and upper-middle class might seem high for Africa, the thresholds are rather low even for the developing countries standards. We apply these absolute thresholds for both income and assets data (see below).
It is important to stress that by applying these thresholds, we get the all-African middle class rather than the actual middle class in individual countries (which is more of a relative nature). Therefore, the size of the middle class that we calculate should be interpreted as a proportion of people in an individual country that belongs to the all-African middle class. To reflect this distinction, we use the designations of African income middle class size and African assets middle class size (in an individual country). When referring to (African) middle class without any attributes, we mean people with income between USD 3 and 30 per day (and corresponding thresholds in the assets approach).
African Income Middle Class Across African Countries
To construct and calculate the African income middle class, we use the most recent data on aggregate income distributions for 50 countries in Africa for which the data are available in PovcalNet (2018). 2 It is important to note in this regard that these most recent data for African countries include a large span of years: the most remote year is 2003 (Gambia) and the most recent year is 2015 (Togo, Zambia, Ivory Coast and Egypt), with an average year of the most recent surveys being 2010/2011 (with the standard deviation of 2.68 years).
The PovcalNet database provides us only with the aggregate income distribution data (i.e. population deciles, vigintiles or percentiles and their cumulative income shares) for each of the 50 African countries. To be able to calculate the size of the income middle class for individual African countries, we must first disaggregate the data to the household level. Using the Distributive Analysis Stata Package, we perform the disaggregation procedure assuming a log-normal shape of the income distribution with the optional adjustment to ensure that the initial distribution matches the aggregated data (see Araar and Duclos, 2007). We repeat this procedure by countries to obtain the (disaggregated) income vector of each country. This vector for each country is then multiplied by the corresponding mean income value which is available in the PovcalNet database. Thus, we obtain the actual income distribution data for all 50 individual African countries (see also Harmáček et al., 2016 or Harmáček et al., 2017). We then use the middle class threshold values to calculate the proportion (per cent) of people that belong to the above defined subcategories of the African middle class in each African country.
African Assets Middle Class Across African Countries
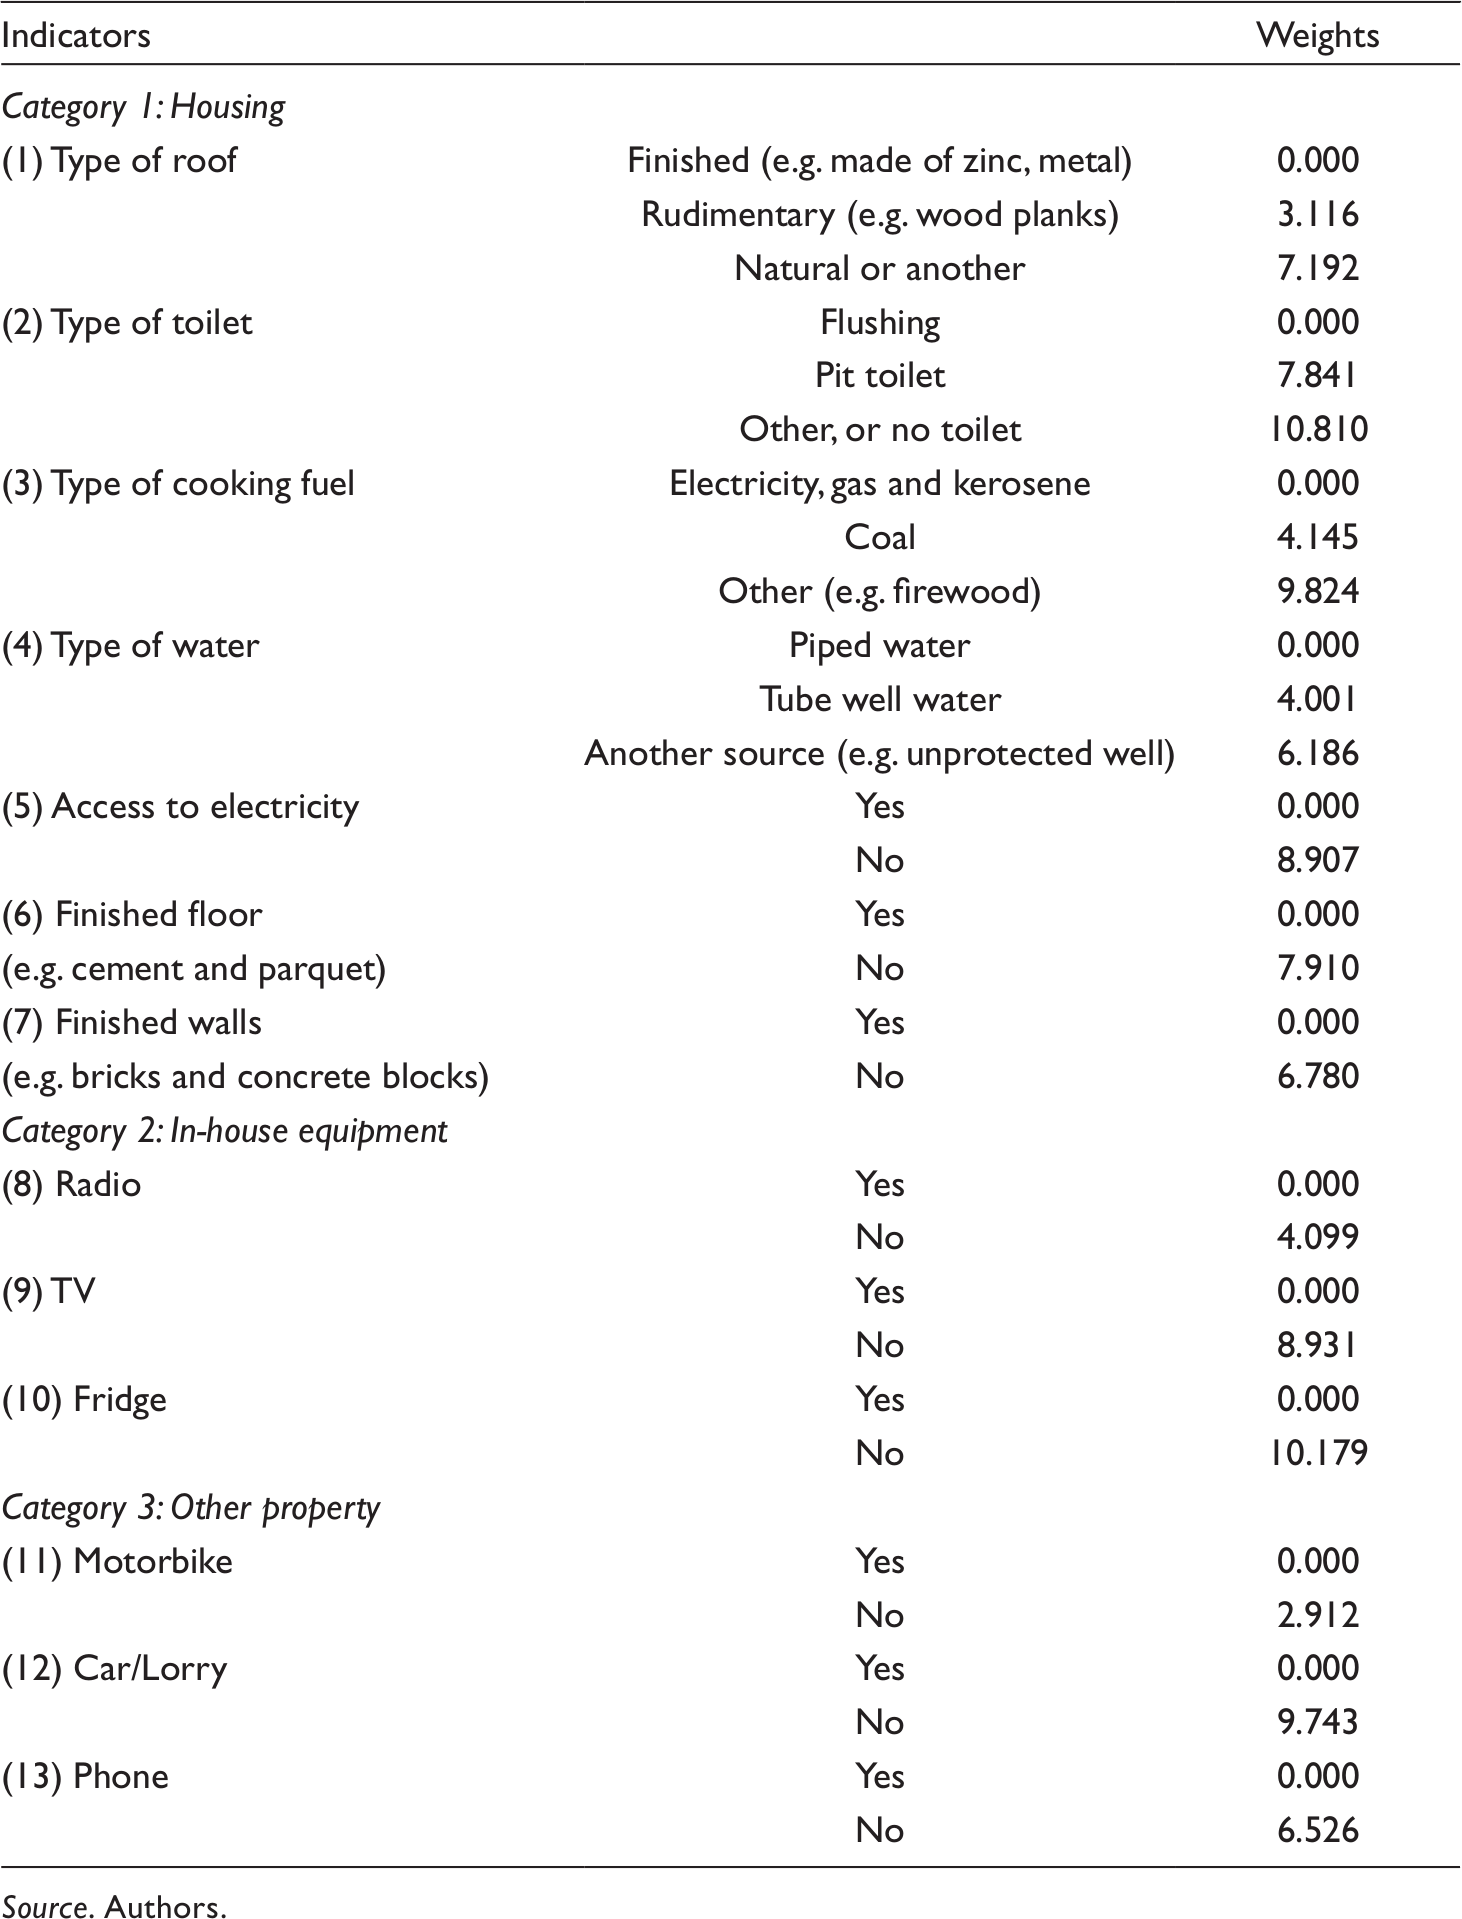
To construct and calculate the African assets middle class, we develop our own assets index using DHS data. We first identify all African countries for which the most recent issue of DHS data (ranging from 2010 to 2014) are available – this is thirty countries in total. Subsequently, we choose all indicators which measure ownership of assets. We exclude some of them for several reasons: (1) some indicators reflect ownership of assets of an extremely low financial value (e.g. bed nets), (2) some indicators display ownership of assets with limited usage in many areas (e.g. having a motorboat is irrelevant for people living far from the coast), (3) some indicators represent ownership of assets which are not increasing welfare per se (e.g. having a hectare of agricultural land hardly creates any benefit; it is beneficiary indirectly only as it produces income). Lately, we exclude some indicators due to insufficient data availability for African countries and some observations (households) with incomplete data. The aim is to optimise the number of categories for those indicators having more than three to simplify the structure of the composite assets index. The merging of categories has been done in a way which allows the qualitative alignment of categories (e.g. a finished roof is better than a rudimentary roof which is better than a natural or another roof). Finally, we end up with 13 indicators of ownership of assets for which data for all thirty African countries are available (Table 1). They can be grouped into three sub-categories: (1) housing, (2) in-house equipment and (3) other property. For comparison, Shimeles and Ncube (2015) work with eleven indicators.
Indicators and Weights of Our Assets Index.
Source. Authors
The most challenging part usually comes with the determination of weights of indicators. For example, Organization for Economic Cooperation and Development (OECD) (2008) lists seven methods which can be classified into two categories: (1) weights determined by statistical models, or (2) by expert/participatory assessments. Methods of statistical weighting are based on characteristics of data and therefore may be less arbitrary than expert/participatory weighting. Many options exist such as the multiple correspondence analysis (e.g. used by Boccanfuso et al., 2009; Ezzrari and Verme, 2012), the polychoric principle component analysis (e.g. used by Cardozo and Grosse, 2009) or the fuzzy analysis (e.g. used by Oyekale and Oyekale, 2013). However, their disadvantage lies in the fact that they do not assess the importance of variables from a theoretical perspective. On the contrary, expert weights may better reflect the theoretical relevance of variables, but their credibility depends on selection of experts and their understanding of the process. We use multiple correspondence analysis (MCA) and rescale the results linearly in a manner which assigns zero points to households with the worst set of assets (i.e. households that are in the last category for each indicator) and 100 points to households with the best set of assets (i.e. households that are in the first category for each indicator). Table 1 presents the final structure of our assets index together with (rescaled) weights of each category.
After all calculations, we undertake a sensitivity analysis of the index which confirms that the outcomes of the index are robust and relatively insensitive to the normative decisions we have made during the process of its construction. 1 The last step is to project the absolute measure of income middle class (USD 3–30) into the assets index. This is not a straightforward task because the assets index and income have different units of measurement. Therefore, we base the calculation on the average proportions of people who live below and above the middle class as defined by the absolute income thresholds. We calculate the (unweighted) average proportions of people below the USD 3 and 6 thresholds and above the USD 15 and 30 thresholds. These average proportions are used then to set thresholds for the assets data. Specifically, we calculate thresholds of 43.17 (analogy of USD 3 income), 70.39 (USD 6 ), 90.31 (USD 15) and 97.09 (USD 30). Subsequently, we employ these thresholds to compute the assets middle class sizes for each country.
Limits of the Middle Class Quantifications
The availability of data on African countries poses the most serious challenge to our research. First, we are left with a set of only thirty African countries to analyse (the final sample consists of countries for which data on both income and assets are available). Second, due to insufficient data for all pre-selected indicators, we have to limit the number of indicators used in the assets index as well as the number of observations (households) included in the analysis. Third, the ‘most recent data’ for African countries that are available in PovcalNet encompass a large span of years, covering the period from 2003 (Gambia) to 2015 (Togo, Zambia, Ivory Coast and Egypt). On the contrary, the survey years in the most recent issue of DHS data range between 2010 and 2014. This may pose a challenge particularly for our comparative analysis. Finally, we are aware that we focus only on cross-country comparisons of the most recent available data, without considering changes over time.
Research Outcomes of the Comparative and Regression Analyses
In this section, we perform comparative and regression analyses and present and discuss their results. First, we focus on the African income and assets middle class across countries. We calculate their sizes and compare them across countries. We also deal with the composition of the middle class across countries in terms of the various categories (floating, lower- and upper-middle class). Second, we analyse and compare the influence of the same set of selected factors on the size of both African income and assets middle classes as well as on differences between them.
Size of the African Income and Assets Middle Class Across African Countries
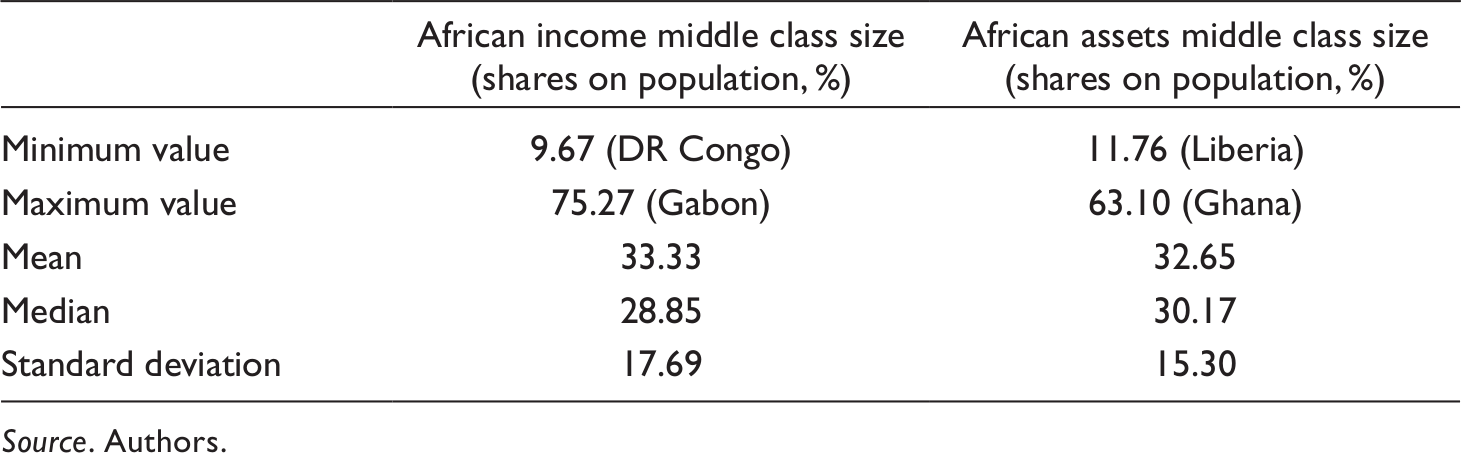
Based on the most recent data and methodology described earlier, we first calculate the size of African income middle class and African assets middle class for thirty countries for which data are available (using corresponding thresholds discussed above). Table 2 displays the summary statistics. It is important to stress that these results are not weighted by population size of the respective countries (each country has equal weight).
Summary Statistics for African Income and Assets Middle Class Sizes.
Source. Authors
Table 2 shows that the range for both middle class sizes differs slightly. The maximum for African income middle class is observed for Gabon. The value of 75.27 per cent means that the vast majority of Gabonese live with income between USD 3 and 30 per day and therefore belong to the African income middle class. On the contrary, only 9.67 per cent of citizens in the DR Congo belong to it, too. A similar interpretation also holds for the African assets middle class where the maximum observed for Ghana is lower in comparison to income middle class (63.10 per cent), while the minimum observed for Liberia is higher (11.76 per cent). See Appendix 1 for details.
In our sample, the means of both middle class sizes are basically the same. This is an obvious consequence of derivation of the assets middle class thresholds from the income data (we discuss this above). However, despite the large similarity in setting the thresholds for both types of African middle class, it is apparent that the differences between the middle class sizes can be very substantial for some countries. Graph 1 presents all countries (14) whose African assets middle class is larger. They are ranked from left to right according to the difference calculated as the African income middle class size (per cent) minus the African assets middle class size (per cent) across individual countries. Nigeria is the most lopsided country in our sample, as it has the largest difference (−24.85 p.p.) in favour of the assets middle class. This means that only 24.26 per cent of Nigeria’s population belongs to the African income middle class but more than 49 per cent fall into the African assets middle class. The following four countries (Gambia, Togo, Malawi and Mozambique) have differences larger than −10 p.p. The most balanced countries in this regard are Burundi and Rwanda which have a difference smaller than −1 p.p.
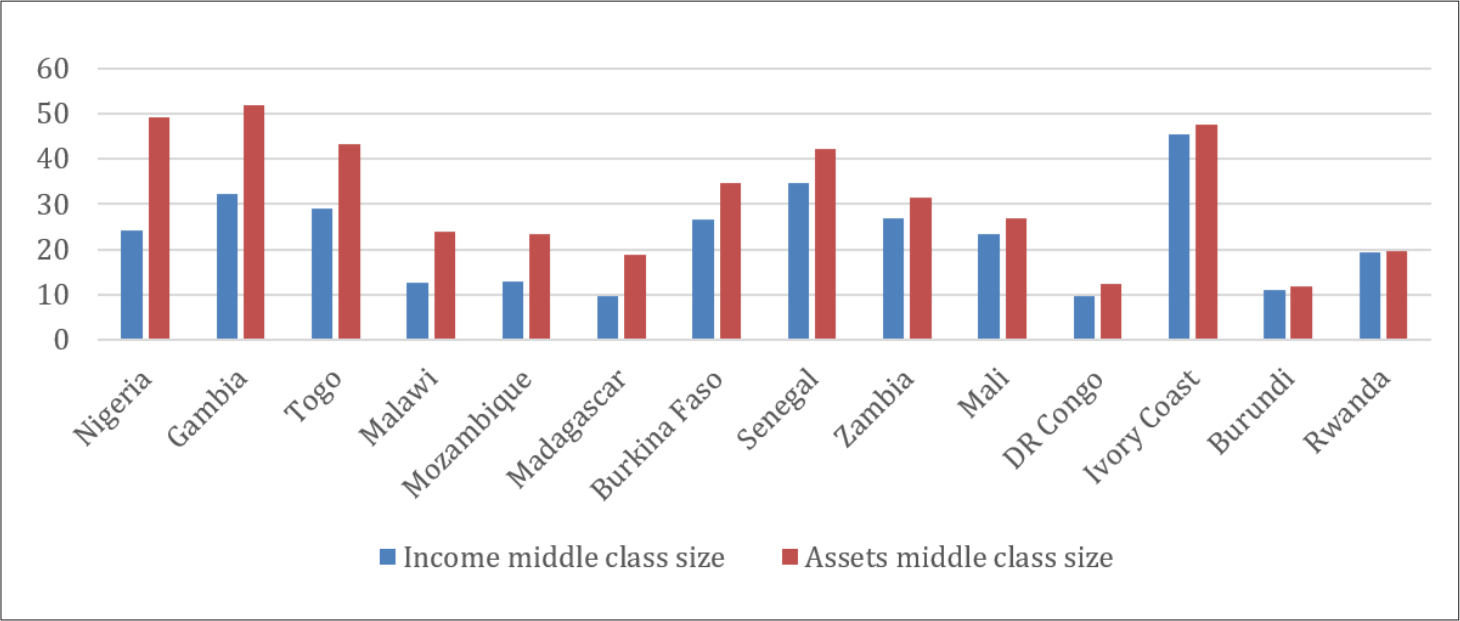
The Middle Class Sizes (%) for Countries with Larger African Assets Middle Class. Source: Authors
Graph 2 presents the remaining 16 countries as having the African assets middle class smaller. They are ranked from left to right again according to the size of difference calculated in the same way as above. Zimbabwe is the most lopsided country, with the largest difference (+17.09 p.p.) in favour of the African income middle class. This indicates that 54.85 per cent of Zimbabwe’s population belongs to the African income middle class, while only 37.76 per cent fall into the African assets middle class. Seven countries have a difference larger than + 10 p.p. Besides Zimbabwe, it is also Liberia, Uganda, Gabon, Congo, Cameroon and Kenya. The most balanced country is Guinea with a difference of only + 0.13 p.p.
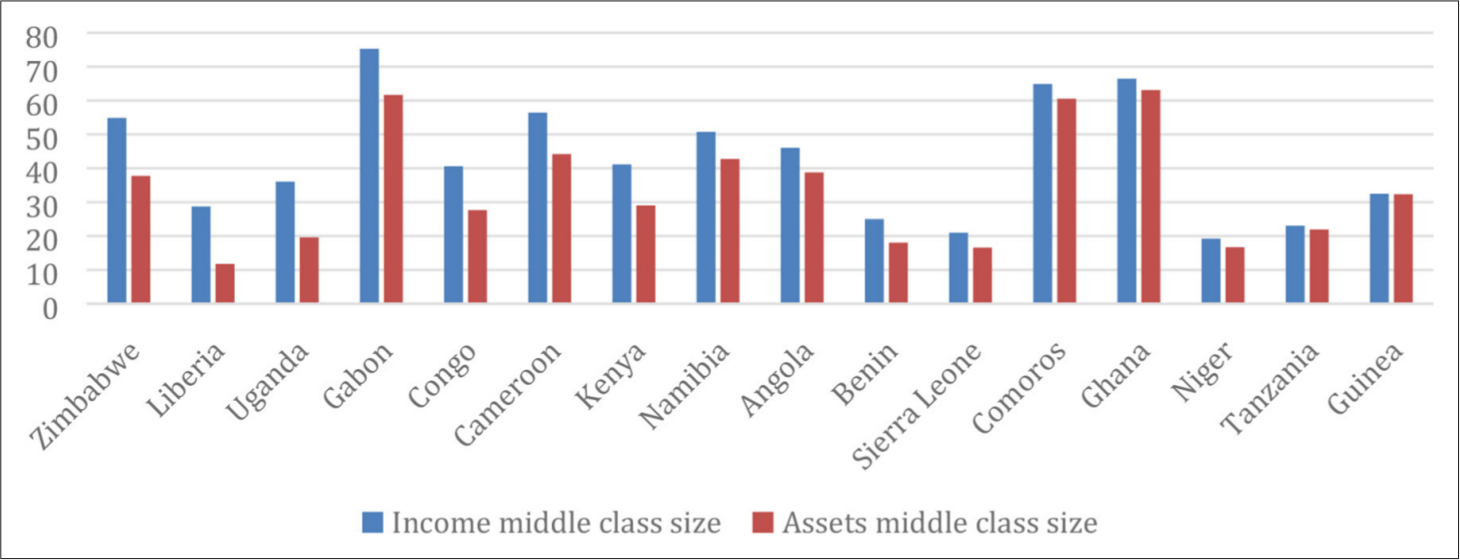
The Middle Class Sizes (%) for Countries with Larger African Income Middle Class. Source: Authors
To check whether the differences between the African income and assets middle class sizes across individual countries are statistically significant, we use a mean comparison test for dependent samples (paired t-test) at the 5 per cent significance level and the related 95 per cent confidence intervals for the differences. We perform the comparative analysis with all observations that are available (30): the test statistic is 0.35 and the p-value is 0.731. The results indicate that there is no statistically significant difference between the size of the African income middle class and the size of the African assets middle class across individual African countries.
Another relevant question concerns the (in)equality of assets and income distribution in individual countries and whether there is an association between them. To compare the inequalities, we calculate and contrast Gini coefficients for our income and assets distributional data. The (unweighted) mean of the assets Gini coefficient for the thirty African countries is 0.3982 (standard deviation is 0.097). The mean of the income Gini coefficient for the same set of countries equals 0.429 (with a standard deviation of 0.066). The small difference is also confirmed by the paired t-test which is not significant (p-value is equal to 0.205). To investigate an association between the inequalities, we use Pearson’s correlation coefficient. We also test whether it is statistically significant. The correlation coefficient (−0.23) and the p-value of the significance test (0.222) indicate that there is a negative but insignificant relationship between the two inequalities (see Appendix 3 for details). This suggests that similar cross-country analyses should focus not only on the distribution of flows (income), but also on the distribution of stocks (assets).
Composition of the African Middle Class Across African Countries
As already mentioned, the African middle class can be further divided into three sub-groups: the floating middle class (with income between USD 3 and 6 per person per day, or its equivalent), the lower-middle class (USD 6–15) and the upper-middle class (USD 15–30). We are interested to know to what extent these sub-categories differ in both income and assets middle classes and how the differences between both of them change when the most vulnerable sub-group (floating class) is excluded. Table 3 presents descriptive statistics for the composition of African income and assets middle class in terms of the three sub-groups. Appendix 2 presents the composition for individual African countries. It is important to stress that these results are not weighted by population size of the respective countries (each country has equal weight).
Descriptive Statistics for Groups of the African Income and Assets Middle Class.
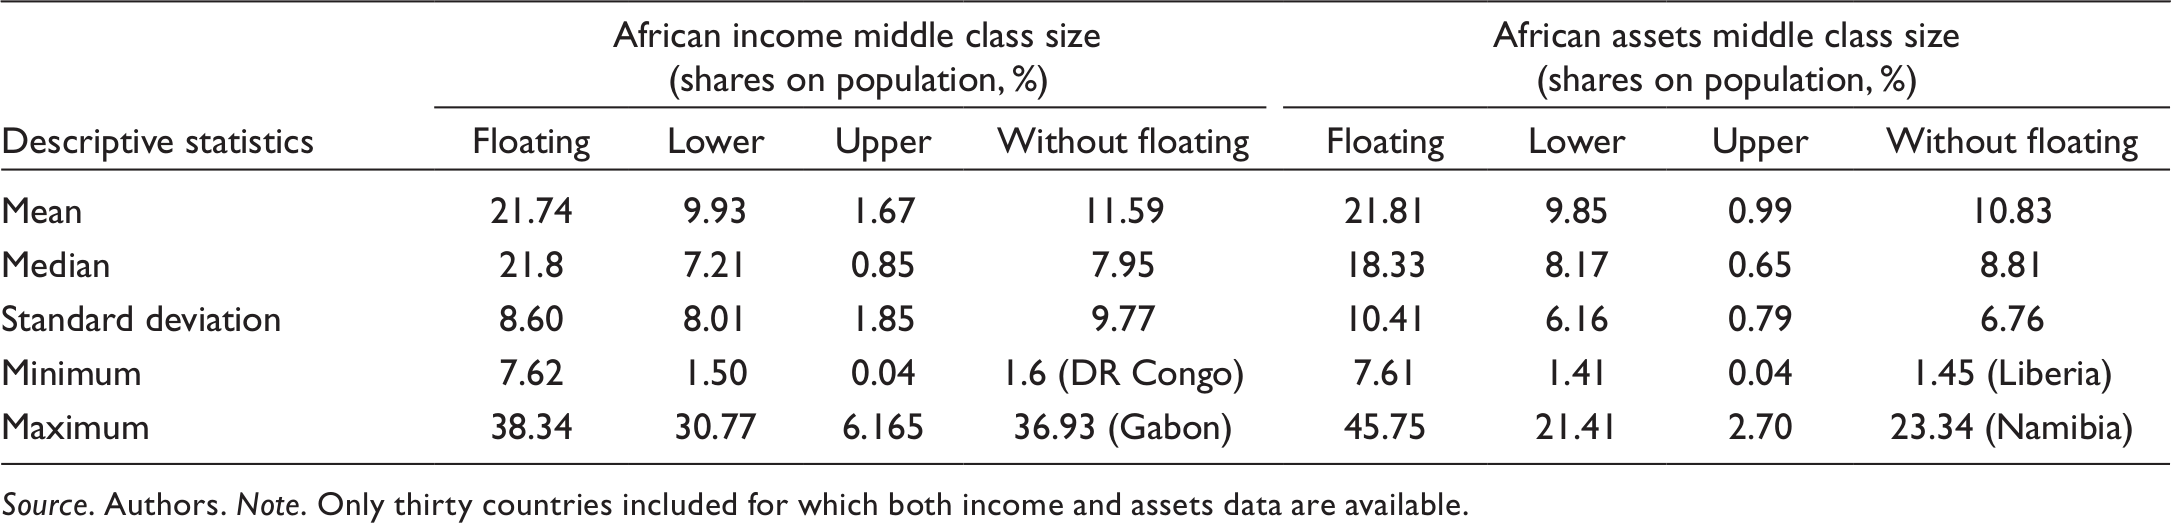
Source. Authors. Note. Only thirty countries included for which both income and assets data are available.
Results show that the largest part of the African middle class across countries is represented, on average, by the floating middle class. The upper-middle class is very thin and in some countries negligible. These results hold both for the income as well as the assets dimension. The maximum value for the floating income middle class is lower than for the floating assets middle class, while for the lower- and upper-income and assets middle class it is vice versa. Interestingly, the floating and lower-income middle class maximums are relatively balanced (38.34 per cent and 30.77 per cent), but the maximum value for the floating assets middle class (45.75 per cent) is about twice higher than the maximum for lower-assets middle class (21.41%). How this reflects on individual countries, we can make an example of Gabon. We have already noticed that Gabon is the country with the largest proportion (75.27 per cent) of population belonging to the African income middle class. In terms of its composition, 38.34 per cent of Gabonese belong to the floating middle class, 30.77 per cent to the lower-middle class and 6.16 per cent to the upper-middle class. Interestingly, Gabon has the largest shares of the population that belongs to all levels of African income middle class. But in terms of the African assets middle class, the composition of Gabonese middle class differs: 45.75 per cent of the population belongs to the floating assets middle class, 13.22 per cent to the lower-assets middle class and 2.7 per cent to the upper-assets middle class. This means that in terms of the assets middle class, the Gabonese are much poorer. See Appendix 2 for details.
Since the floating middle class is still rather poor, we have decided to exclude it from the analysis in the next step to see how the results change. Table 3 (above) shows that still, Gabon remains the country with the highest share of population belonging to the African income middle class and DR Congo the country with the lowest share. However, due to exclusion of the large floating middle class, the shares drop significantly to 36.93 per cent (Gabon) and 1.6 per cent (DR Congo). Concerning the African assets middle class, Namibia newly becomes (compared to Ghana before) the country with the largest share of population belonging to the African assets middle class, even though its share drops to 23.34 per cent. Liberia remains the country with the lowest share of 1.45 per cent.
To investigate how differences between sizes of both middle classes change when the floating middle class is excluded, we calculate the difference between the African income middle class (per cent) and the African assets middle class (per cent) across individual countries in the same way as above but we exclude the floating middle class. Interestingly, the results show that the number of countries whose African assets middle class is larger than its African income middle class rises to 18 (compared to 14 before). Graph 3 illustrates these countries ranked according to the size of this difference. Nigeria remains the most lopsided country with the largest difference (−11.83 p.p.), five other countries have a difference over −5 p.p. (Gambia, Mozambique, Guinea, Angola and Senegal). The most balanced countries in this regard are Niger and Sierra Leone with differences lower than −1 p.p.
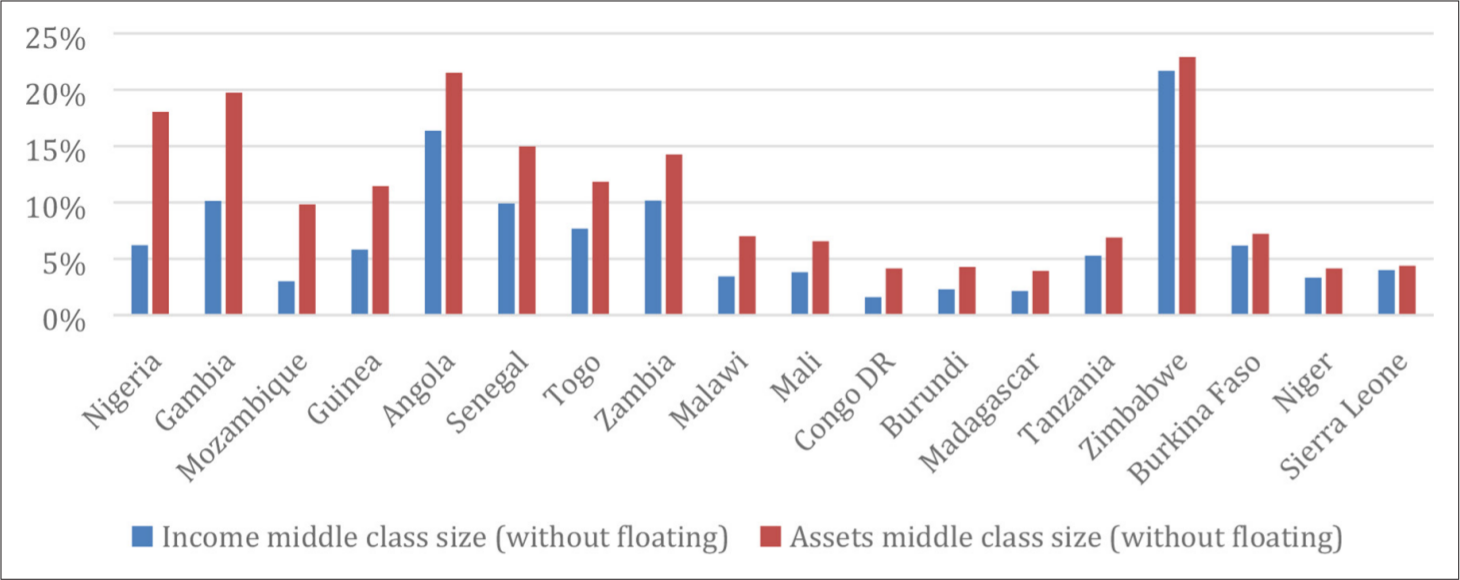
The Middle Class Sizes (%) for Countries with a Larger African Assets Middle Class (after Excluding the Floating Middle Class). Source: Authors
Graph 4 presents the remaining 12 countries where the African income middle class is larger than the African assets middle class (after excluding the floating class). They are ranked from left to right according to the size of the difference. Gabon is now the most lopsided country (and not Zimbabwe as before) with the largest difference (+21.01 p.p.) in favour of the African income middle class. Six other countries have a difference larger than + 5 p.p. (Comoros, Cameroon, Ghana, Kenya, Congo and Uganda). The most balanced country in this regard is Namibia.
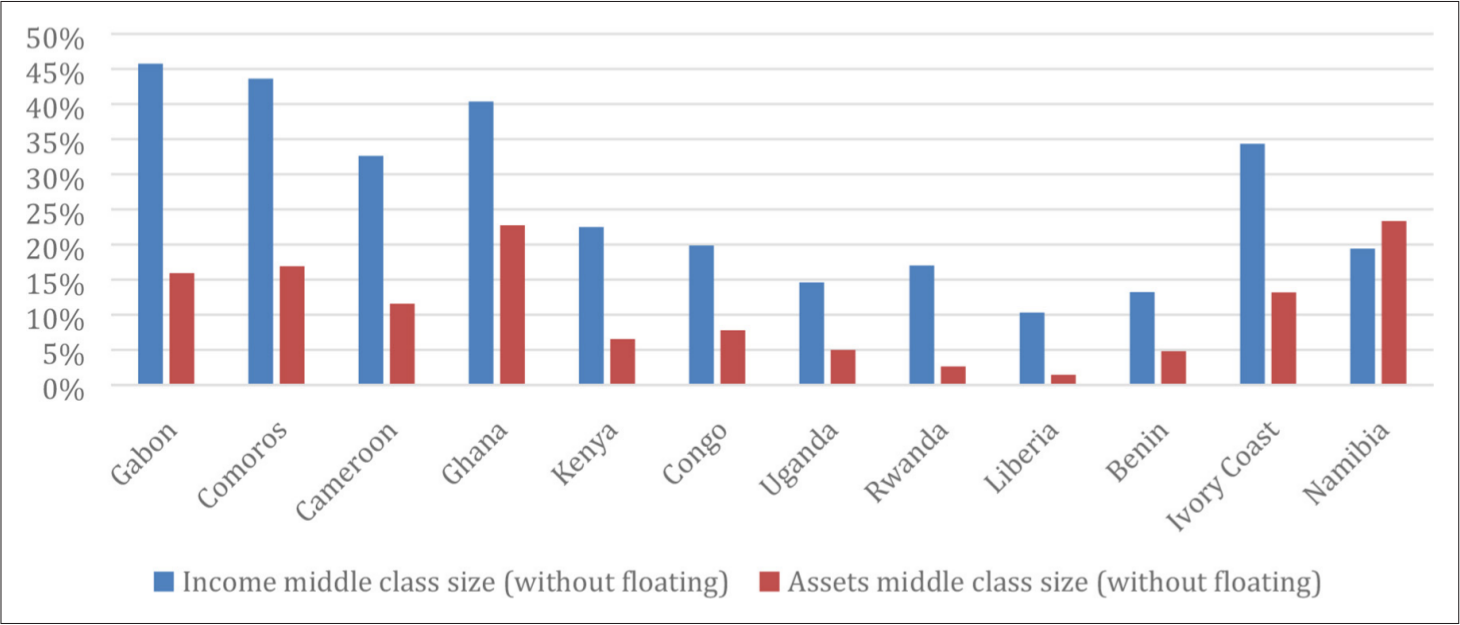
The Middle Class Sizes (%) for Countries with a Larger African Income Middle Class (after Excluding the Floating Middle Class). Source: Authors
These results show that the larger the differences between both middle class sizes in individual countries after the exclusion of the floating middle class, the larger the differences between the composition of both middle class sizes in individual countries. Take the example of Nigeria, the most lopsided country in favour of the African assets middle class. In Nigeria, the share of the population that belongs to the floating income and assets middle class is 18.05 percent versus 31.07 per cent, the share of the population that belongs to the lower-income and assets middle class is 5.6 percent versus 15.4 per cent, and finally, the share of the population that belongs to the upper-income and assets middle class is 0.6 per cent versus 2.64 percent. On the contrary, Sierra Leone is one of the most balanced countries regarding the differences among both middle class sizes. At the same time, the composition of both its middle class sizes is balanced. The share of the population that belongs to the floating income and assets middle class is 16.98 per cent versus 12.19 percent, the share of the population that belongs to the lower-income and assets middle class is 3.91 percent versus 3.88 percent, and finally, the share of the population that belongs to the upper-income and assets middle class is 0.9 per cent versus 0.5 percent.
Potential Correlates of the African Income and Assets Middle Class Size Across Countries
In this section, we focus on finding the potential correlates of the African income middle class size and the African assets middle class size in individual countries. Our first concern, however, is to identify any association between these two sizes of middle class across African countries. As expected, the Pearson’s correlation coefficient shows a strong and highly significant relationship between the variables (r = 0.794 and the p-value is 0.000) and this is also supported by the Spearman's rank-order correlation (rho = 0.748 and the p-value is 0.000). The strength of the relationship does not change when only those countries are included for which the difference in survey years is not greater than three.
We further investigate whether there are associations between the size of the African income middle class, the size of the African assets middle class and the differences between them on one side (our dependent variables) and some other variables measuring different dimensions of development on the other side. For this purpose, we perform three ordinary least squares (OLS) regression analyses with the same set of explanatory variables. These are the quality of governance measured by the Mo Ibrahim index (Mo Ibrahim Foundation (MIF), 2018), the index of ethnic fractionalisation (Alesina et al., 2002), GDP per capita in purchasing power parity at constant international dollars (World Bank, 2018), the lower secondary education completion rate (World Bank, 2018), the infant mortality rate (World Bank, 2018) and the total population size (World Bank, 2018). In some of the regressions, we also work with the income and assets inequalities that are measured by Gini coefficients calculated from our income and assets datasets. The majority of these variables were selected on the basis of research done by Shimeles and Ncube (2015) who investigated the main determinants of the size of the assets middle class in sub-Saharan Africa.
To look for associations, we create a cross-section of data separately for the income and assets middle class. This means that we take the survey year for which we have data on the middle class size and then, for our explanatory variables, we calculate the average value over three years just preceding that survey year. 3 In cases where those data points are not available we calculate the averages from the data points which are the closest to (but precede) the survey years. Then, using the same set of independent variables (but with slightly different data points), we perform three regression analyses to find correlates for the size of the African assets middle class, the size of the African income middle class and for the differences between them.
In the first regression analysis, we investigate factors of the African assets middle class size. Our results are summarised in Table 4. The dependent variable is the size of the African assets middle class in individual African countries. Since it is expressed as a proportion that varies between zero and one, we first use a logit transformation of this variable to take its bounded nature into account and then apply the OLS technique (Baum, 2008). Results show that the level of income (as measured by the natural logarithm of the GDP per capita) is positive and significant in all specifications. In other words, the size of the African assets middle class increases with a higher level of income. Similarly, the level of education (the lower-secondary education completion rate) has a positive effect in most specifications as well, although these relationships are only marginally significant (at the 15 per cent level). 4 Conversely, the ethnic fractionalisation is a negative factor of the assets middle class size indicating that a higher degree of fractionalisation leads to a thinner middle class.
Factors of the African Assets Middle Class Size Across African Countries.
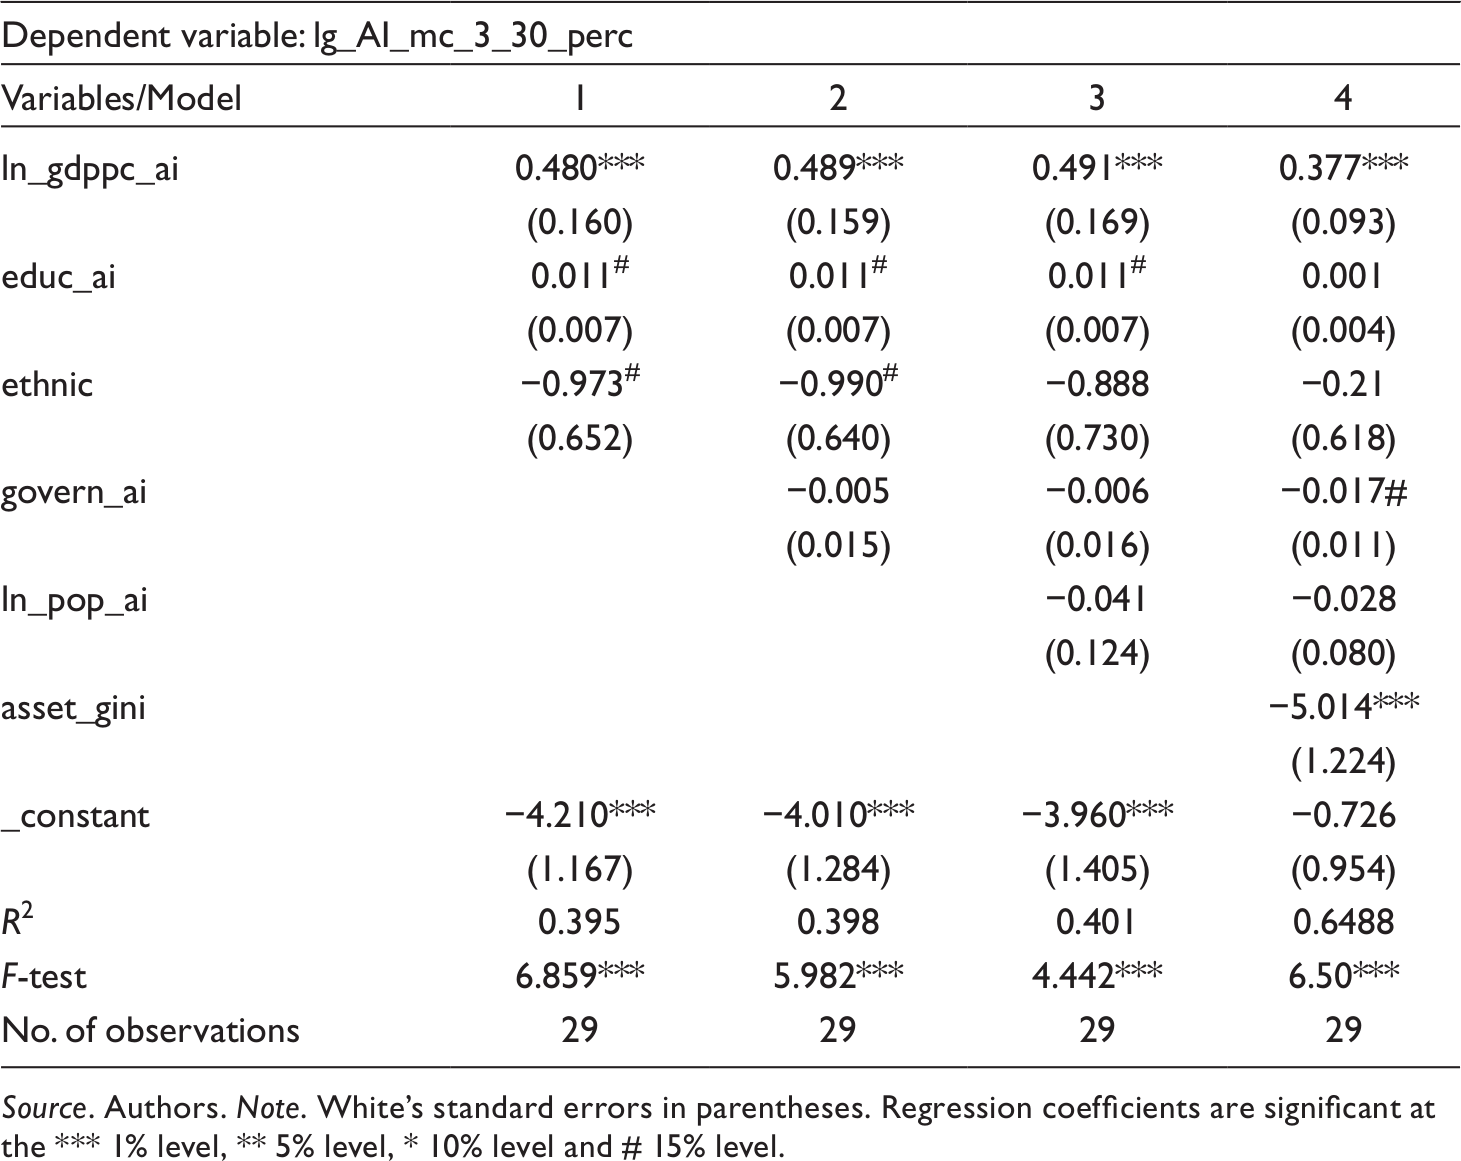
Source. Authors. Note. White’s standard errors in parentheses. Regression coefficients are significant at the *** 1% level, ** 5% level, * 10% level and # 15% level.
When the assets inequality (measured by the Gini coefficient of the assets index) is included in the last model, it is negative and highly significant suggesting that the African assets middle class is larger in size when the assets inequality is lower. The last specification is also the only one in which the level of governance is marginally significant, however with a negative sign. The population of African countries does not have any effect on the African assets middle class size. With one exception (the rather insignificant relationship between the level of governance and the size of the assets middle class), these results are generally in line with the findings of Shimeles and Ncube (2015), although it is important to note that their research was designed in a different way (most importantly, they used a pseudo-panel approach to explain the factors of the middle class size in African countries).
In the second regression analysis, we use the same variables to explain the size of the African income middle class. The dependent variable is the size of the African income middle class in individual African countries. Since it is a bounded variable, we use its logit transformation and then we employ OLS regression. Results in Table 5 show that the coefficient of income level is positive and highly significant in all specifications. It is also apparent that education is a positive and significant determinant of the income middle class size. Ethnic fractionalisation is negatively associated with the income middle class size; however, it is mostly clearly insignificant. The same is true for governance and population variables. On the contrary, the Gini coefficient that measures income inequality is a negative and highly significant factor: the lower is the income inequality (when the level of income is controlled), the higher is the size of the African income middle class across African countries.
Factors of the African Income Middle Class Size Across African Countries.
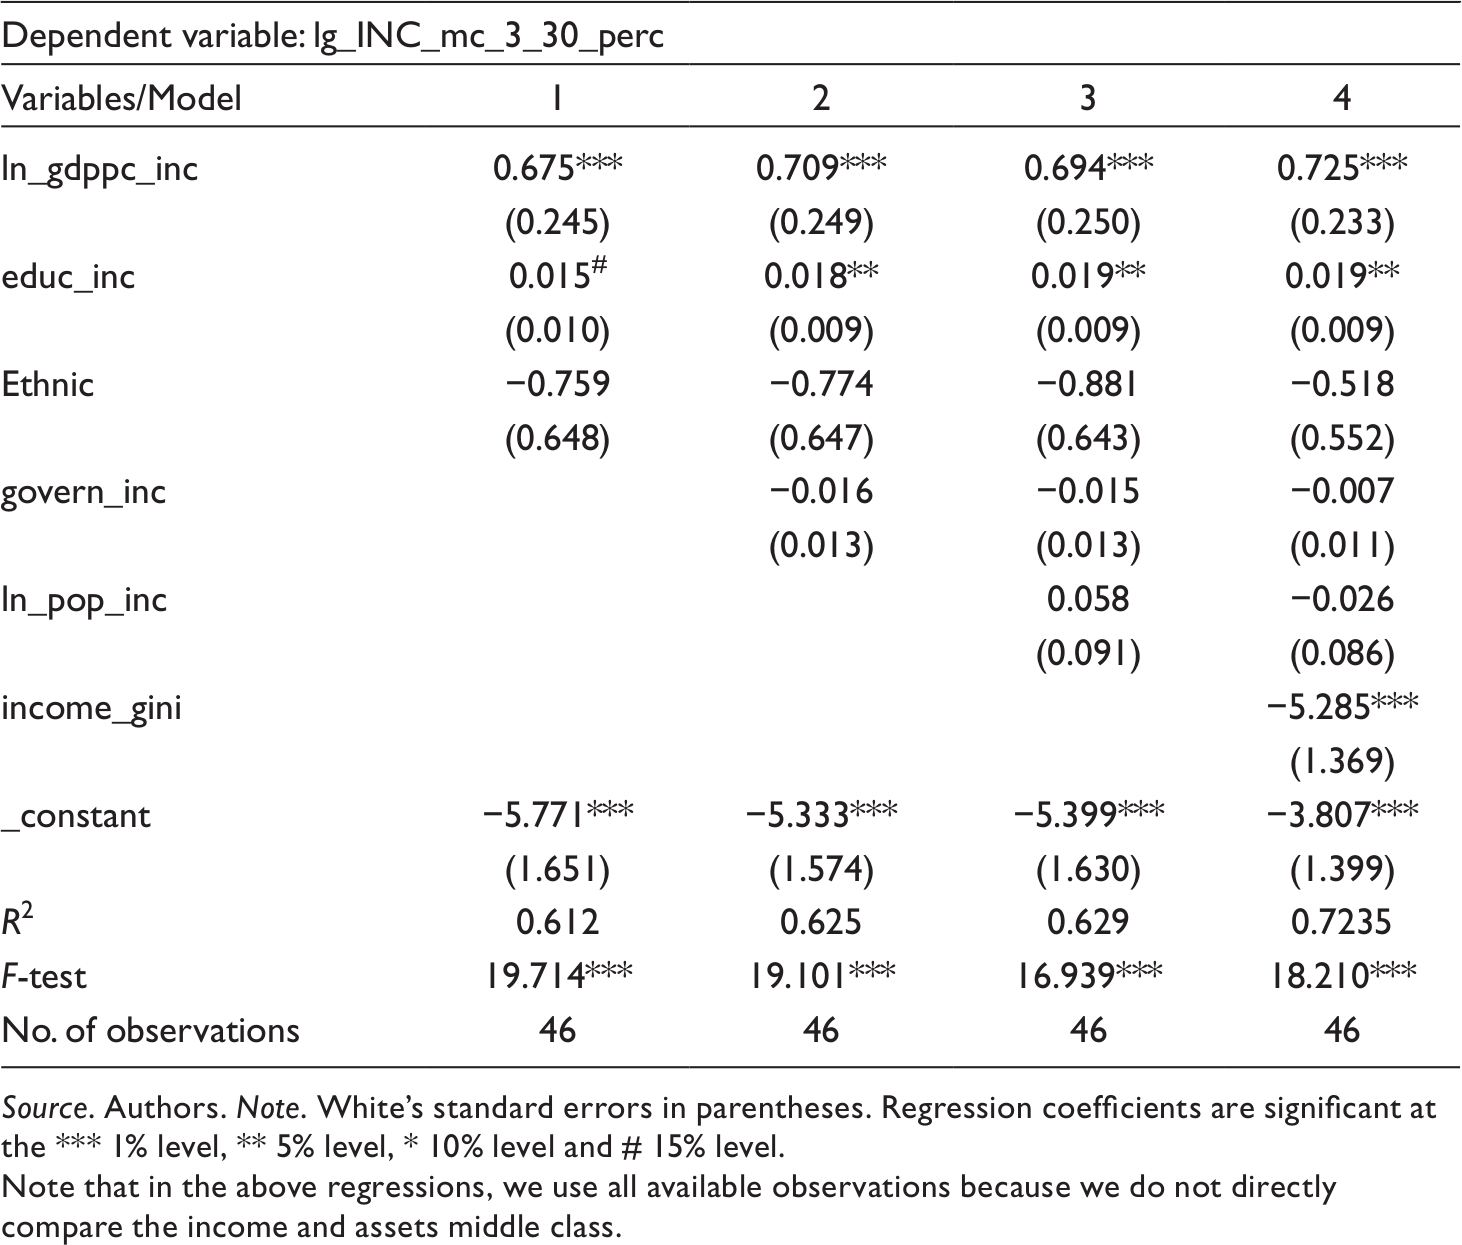
Source. Authors. Note. White’s standard errors in parentheses. Regression coefficients are significant at the *** 1% level, ** 5% level, * 10% level and # 15% level.
Note that in the above regressions, we use all available observations because we do not directly compare the income and assets middle class.
The results do not change in substance when we perform the income regressions for those thirty countries for which the assets data are available. However, while the signs of the coefficients do remain the same, their significances predominantly drop. This is true particularly for the income level and the income inequality which both become insignificant even at the 15 per cent level. On the contrary, the significance of the education variable increases in all four models. These changes in the results are a consequence of excluding some income-rich African countries from the analyses (such as Seychelles, Mauritius, South Africa or Algeria) for which the assets data are not available.
To summarise the findings so far, we have used the same set of explanatory variables with the aim to compare their influence on the size of the African income middle class and the size of the African asset middle class. Our cross-country regression analysis of the assets middle class factors has confirmed to a large extent the results of Shimeles and Ncube (2015). The regressions of the African income middle class size have confirmed the expectations as income and income inequality are the leading factors. Education does play a role as well. To a lesser extent, some negative effect has the ethnic fractionalisation variable, although it is stronger and at least marginally significant in the assets middle class regression. The results of the regression analyses are compared in Table 6.
Comparison of Factors’ Influence and Significance in Our Regression Analyses.
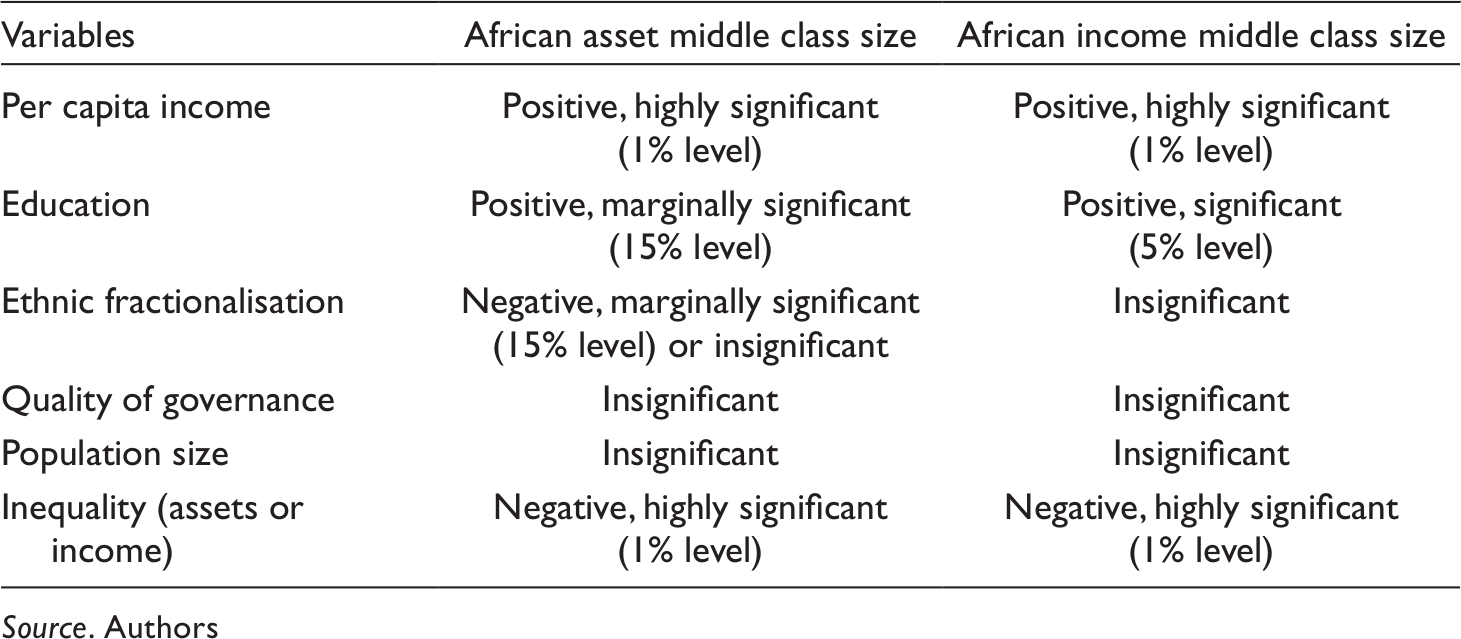
Source. Authors
In the last regression analysis, we investigate the factors of differences between the size of the African income middle class and the size of the African assets middle class. By doing this, we try to explain why there are differences between the two middle class sizes. Since the dependent variable is a difference that may take negative values (for countries in which the assets middle class size is larger than the income middle class size), we do not transform the data by the logit transformation. Also, we include in the analysis only those countries for which the gap between survey years is not greater than three. The data for explanatory variables is averages over data from the previous two regressions (except for the two inequality variables). The results are summarised in Table 7.
Factors of the Differences Between the Sizes of the Middle Class.
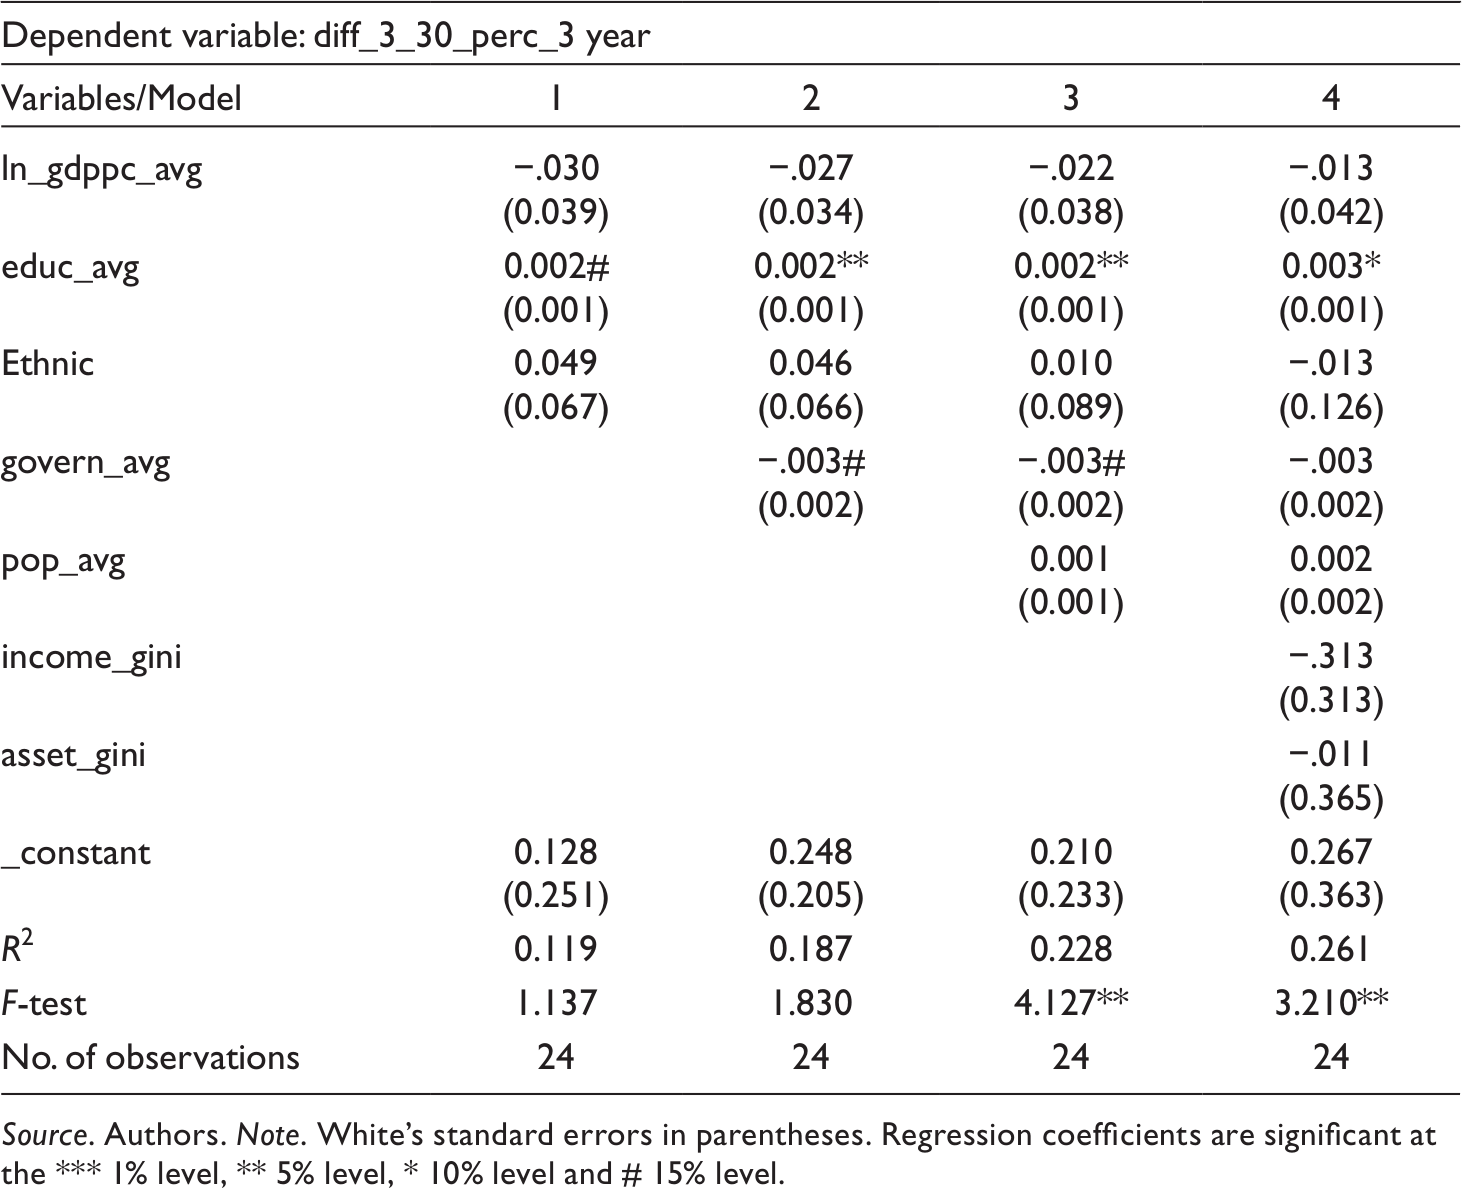
Source. Authors. Note. White’s standard errors in parentheses. Regression coefficients are significant at the *** 1% level, ** 5% level, * 10% level and # 15% level.
There is a negative but statistically insignificant relationship between the level of income and the difference in African middle class sizes, meaning that African countries with higher GDP per capita have a weak tendency to display larger differences in favour of the assets middle class. Education is the only significant variable, meaning that African countries with a higher level of education show a tendency to have larger differences in favour of the income middle class. The level of governance has a weak negative influence indicating that countries with better governance tend to have larger differences in favour of the assets middle class. The remaining variables (i.e. ethnic fractionalisation, population, income inequality and assets inequality) are clearly insignificant.
It can be seen from the results that while our models perform rather decently in terms of the African income and assets middle class size, they do not explain the differences very well. To check the robustness of our findings, we have also repeated all our analyses for the African income and assets middle class, excluding the floating middle class. By doing this, we have focused on the more stable, but also rather thin components of the African middle class. However, the results do not practically differ, and all our findings remain unchanged.
Discussion of Results
Our results indicate that even though both the income and assets approach to measuring the middle class sizes provide a similar picture, as confirmed by both Spearman and Pearson’s correlation coefficients, such measured middle class sizes can vary substantially in some countries. In some, noticeable differences exist. For example, in Nigeria, the proportion of population that belongs to the African assets middle class is more than twice as large as the one that belongs to the African income middle class (49 per cent vs 24 per cent). In Zimbabwe, it is vice versa (38 per cent vs 55 per cent). Simultaneously, in some countries both middle class sizes are more or less balanced (Guinea, Rwanda or Burundi). The same holds for middle class sizes after exclusion of the most vulnerable sub-group (floating middle class). But interestingly, in this case more countries show the African assets middle class to be larger than the income middle class (without the exclusion it is vice versa). And also, the most lopsided countries in terms of the differences between both middle class sizes after exclusion of the floating middle class show the biggest differences in the composition of both middle class sizes. These results can be highly informative for policy-makers, yet the main issue is to understand why the middle class sizes in some countries differ, while in others not. And also, why in some countries the income middle class size is larger than assets middle class, while in others it is vice versa.
The variables included in the assets index (especially those under category 1: housing) are clearly influenced by the country’s level of infrastructure, urban development and public policies (provision of electricity, water, or sanitation systems). Therefore, we can assume that countries lopsided towards the income middle class (i.e. countries whose income middle class is larger than its assets middle class) have weaknesses in these above-mentioned policies, or not a large share of their income middle class population has access to them.[ 5 ] Alternatively, such a disbalance could be caused by the economic growth cycle: naturally, when income rises, improvements in households assets lag behind (first, financial means are accumulated, then investment in assets is done). Yet, for example, variables such as policy on the mortgage market for housing could play a role (shorten the time lag of assets improvement). Our research also indicates that countries with a higher level of education show a tendency to have larger differences between both middle class sizes in favour of the income middle class. Thus, educational policy can also play a role.
Countries lopsided towards the assets middle class could be relatively strong in their public investment policies (especially in infrastructure), as confirmed by our research indicating that countries with better governance (in general) tend to have larger differences between both middle class sizes in favour of the assets middle class. Yet, they can be weaker in economic policies. We can assume that income middle class in such countries could be undermined either by the inability of households to raise income high enough to be able to buy assets (low purchasing power), or by a large share of the floating income middle class, respectively. The imbalance can be also caused by stagnant or negative economic growth (households accumulate assets and still keep them even though the economic situation and consequently their income has deteriorated). Therefore, we can assume that the income middle class is more responsive to economic policies implemented in respective countries, while the assets middle class is more responsive to public investments in infrastructure and good governance in general. Also, we note that change in economic dynamics is captured faster by the income middle class rather than the assets middle class. Therefore, changes in the income middle class can be considered an indicator of successfulness of policies in the short-term, while changes in the assets middle class indicate long-term (or at least medium-term) successfulness of policies implemented in the country.
Conclusions
There is a rising interest in measuring the middle class in developing countries. Vast evidence of the African middle class has been so far based on income, even though most African countries still lack available and accurate income data. The picture of such a middle class may not be fully correct. In our research, we compared and analysed two different measures of middle class: the traditional one based on income, and the other one based on ownership of selected assets. To investigate to which extent results in middle class sizes in Africa for these two approaches differ, we have defined and constructed two main middle class categories – the African income middle class and the African assets middle class, both based on absolute thresholds initially used by African Development Bank (AfDB) (2011). We have measured sizes of both types of middle class and explored the differences between them across all thirty African countries for which data were available. We have also performed a set of regression analyses in order to investigate and compare the correlates of both types of middle class.
Our results indicate that both middle class sizes can substantially vary in some countries. Some countries show larger income middle class, the others vice versa. Some countries have both middle class sizes balanced. When further analysing the composition, we can confirm findings of African Development Bank (AfDB) (2011) indicating that the majority of the African middle class belongs to the floating category. The upper income middle class is very thin, and in some countries negligible. These results hold for both the African income and assets middle class. Consequently, the share of the African middle class decreases significantly when the floating class is reduced. And interestingly, in this case the number of countries whose African assets middle class is larger than its income middle class increases. Results of our regression analyses show that the African assets middle class size across countries is positively correlated with income per capita and education and negatively correlated with ethnic fractionalisation and assets inequality. The African income middle class size across countries also depends positively on income per capita and education, while negatively on the income inequality. Quality of governance and size of population have not been found significant in either regression. Our models, unfortunately, perform rather poorly when explaining the differences between the middle class sizes.
We admit that, generally, differences in income and assets distributions or in sizes of the middle classes measured by income and ownership of assets can be partly caused by noise in data (especially by only cruel approximation of property ownership and also by differences in years of data collection). We also suppose that the absolute thresholds applied to measure the African middle class across countries produced lower differences in middle class sizes. If the relative approach was used, the factor of (un)even distribution - which is quite different for income and for assets – would have played a more important role. Nevertheless, our findings indicate that measuring the middle class solely by income does not sufficiently capture the reality. It is possible to assume that the same holds true for other social classes, such as poor or rich. This has serious implications for policy-makers, especially when designing social programs for those in need. We suggest that measuring the middle class (or poverty) should be as much as possible carried out from multiple perspectives (income and assets being only two of them). On a macro level, estimates of middle class sizes based on multiple criteria could be more accurate, especially in developing countries with generally higher levels of noise in data. Potential differences in results should always be analysed in depth to understand why they exist. Following our analysis, there is still space for further research. We suggest investigating how much the income and assets middle classes overlap in individual countries (data used in this article did not allow that). Moreover, testing the robustness of the results in various modified contexts, introducing comparisons over time, or analysing the most lopsided countries in a more depth could be other noteworthy directions of the subsequent research.
Footnotes
Declaration of Conflicting Interests
The author(s) declared no potential conflicts of interest with respect to the research, authorship, and/or publication of this article.
Funding
This article is result of the Metropolitan University Prague research project No. 74-02 (2020) based on a grant from the Institutional Fund for the Long-term Strategic Development of Research Organizations.
Notes
Author Biographies
E-mail:
Appendix 1
The Size of the African Income and Assets Middle Class Across African Countries.
Appendix 2
The Composition of the African Income and Assets Middle Class Across African Countries.