
Abstract
We introduce and demonstrate the utility of coded aperture (CA) nuclear scintigraphy for imaging small animals. CA imaging uses multiple pinholes in a carefully designed mask pattern, mounted on a conventional gamma camera. System performance was assessed using point sources and phantoms, while several animal experiments were performed to test the usefulness of the imaging system in vivo, with commonly used radiopharmaceuticals. The sensitivity of the CA system for 99mTc was 4.2 × 10³ cps/Bq (9400 cpm/μCi), compared to 4.4 × 10⁴ cps/Bq (990 cpm/μCi) for a conventional collimator system. The system resolution was 1.7 mm, as compared to 4–6 mm for the conventional imaging system (using a high-sensitivity low-energy collimator). Animal imaging demonstrated artifact-free imaging with superior resolution and image quality compared to conventional collimator images in several mouse and rat models. We conclude that: (a) CA imaging is a useful nuclear imaging technique for small animal imaging. The advantage in signal-to-noise can be traded to achieve higher resolution, decreased dose or reduced imaging time. (b) CA imaging works best for images where activity is concentrated in small volumes; a low count outline may be better demonstrated using conventional collimator imaging. Thus, CA imaging should be viewed as a technique to complement rather than replace traditional nuclear imaging methods. (c) CA hardware and software can be readily adapted to existing gamma cameras, making their implementation a relatively inexpensive retrofit to most systems.
Introduction
Nuclear imaging is a mainstay of small animal imaging research, but has long been hampered by intrinsically low resolution [1]. Traditionally, nuclear images have been acquired with gamma cameras using either conventional parallel-hole type collimators, or with pinholes. Collimator imaging, depending on design, generally has significant constraints on the resolution achievable, but will allow reasonably high-count images in most applications. In pinhole imaging, a high-resolution projected image of the source object is obtained by limiting access to the imaging detector to a single small aperture. The smaller the pinhole aperture, the higher the image resolution, but the fewer photons reach the detector, often leading to low-signal, noisy images. This often necessitates impractically long acquisitions and/or high doses for pinhole imaging to be useful. One can increase the size of the pinhole, allowing increased photon counts, but at the expense of increased geometric blur and loss of resolution.
Coded aperture (CA) imaging is a nuclear imaging technology that permits high-resolution imaging while preserving image count statistics and maintaining high signal-to-noise ratios. The fundamental principle of CA imaging is to have more than one pinhole simultaneously open (480 apertures in our case). By having each pinhole small, geometric blur is minimized and high resolution is maintained, but the count rate is increased as photons traveling through multiple pinholes contribute to the image. The projected pinhole images will overlap on the detector surface, giving rise to a non-interpretable image, but from a knowledge of the pinhole pattern, computer postprocessing of the raw image data yields a clear image of the object [2]. CA imaging utilizes a patterned mask set up between the small animal imaged and the detector surface (Figure 1). Photons are emitted from the animal, but only those that pass through the patterned pinholes in the mask reach the detector surface.
We undertook this study of CA imaging because of its potential in improving spatial resolution and count rates in small animal imaging research. Specifically, we hypothesized that CA imaging would yield improved signal-to-noise ratios compared to conventional collimator imaging, with higher resolution images for equivalent exposures. We thus defined the system performance in terms of resolution and count sensitivity. Our work is distinguished from previous efforts by the recent advance of near-field artifact elimination (Figure 2), which allows the acquisition of CA images of high quality under near-field conditions. This advance allowed us to overcome a major problem faced by previous investigators.
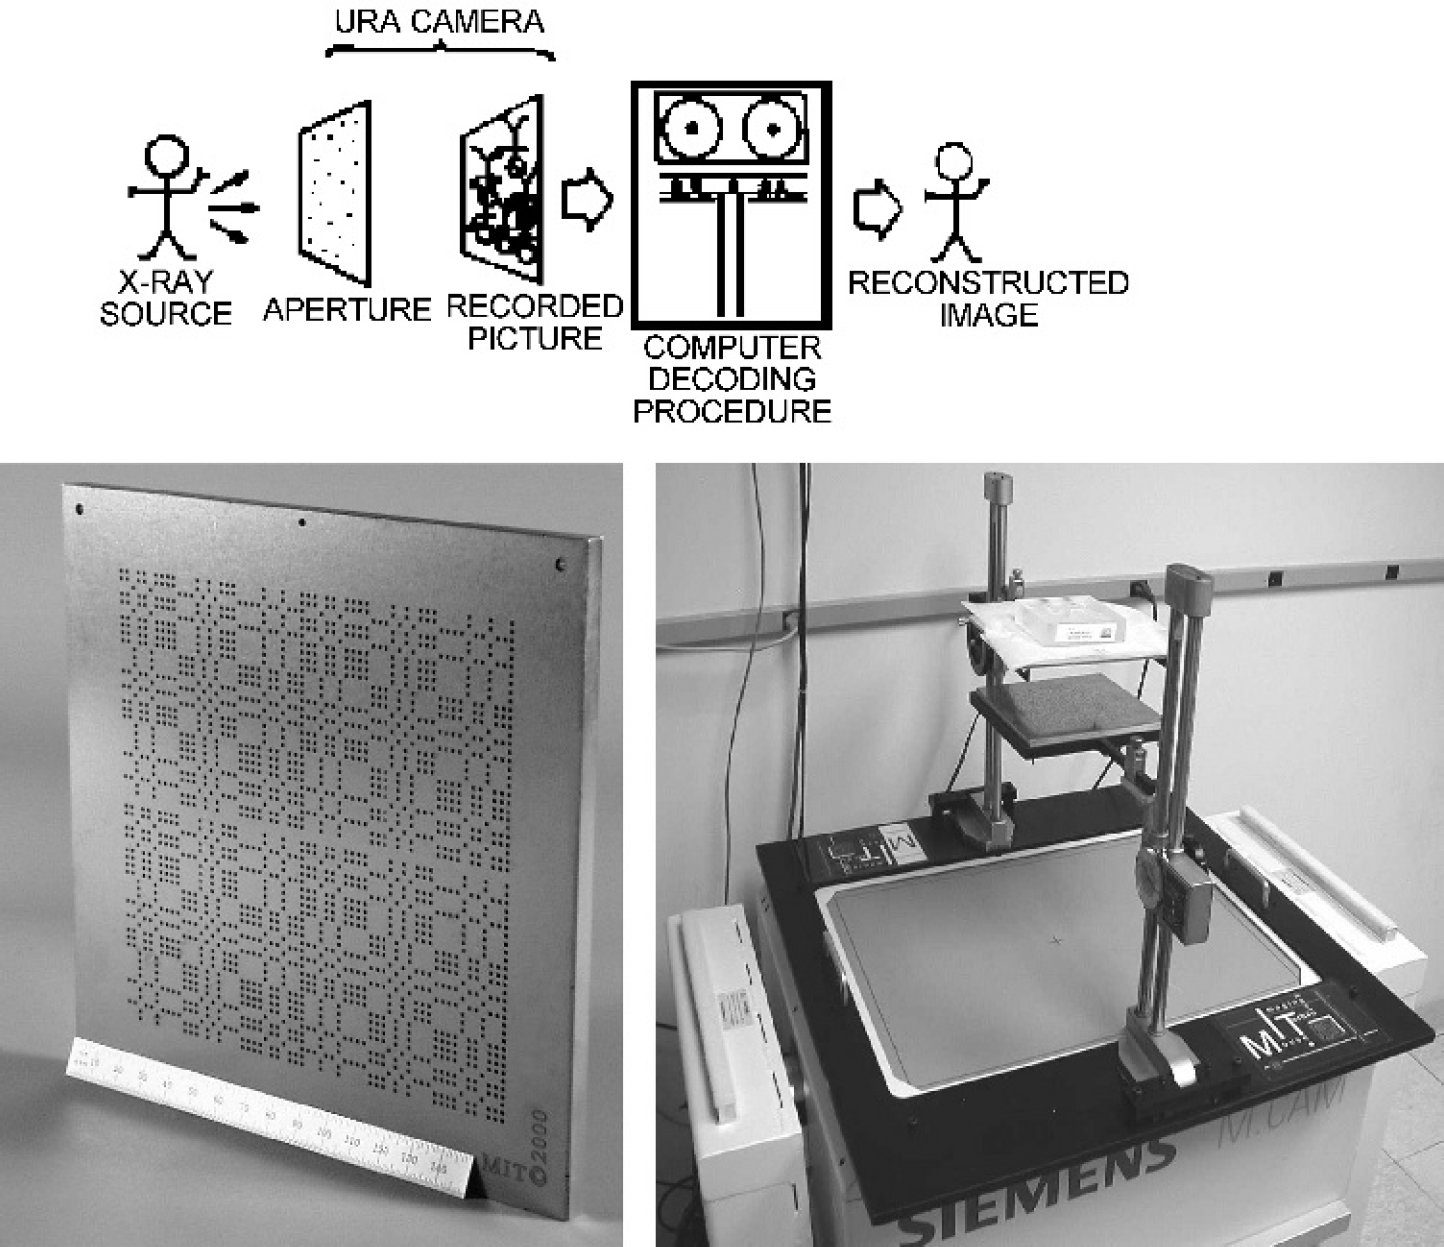
The CA system hardware. Top image: Schematic representation of CA image acquisition: The object is imaged and a raw dataset obtained. A computerized algorithm running on a desktop PC processes these raw images into an interpret able reconstructed image [adapted from Fenimore EE, Cannon TM (1978). Appl. Opt. 17:337–347]. Bottom left: The tungsten mask used for our CA studies. An NTHT MURA 62 × 62 pattern is photo-etched into the mask, antisymmetric about the center of rotation. There are 480 pinholes of 1.11 mm each, with a total open fraction of 12.5%. Bottom right: The experimental setup with the mask positioned between the object or small animal to be imaged and the detector crystal surface. The object to crystal distance is 40 cm, the mask is 30 cm from the crystal. Notice the inherent magnification imposed by the setup, and the limiting effect this has on the FOV. Our setup has a 9 × 9 cm FOV, with an experimentally determined 1 cm useful image depth.
We conducted both phantom and biological studies to investigate the performance of CA imaging. Phantom studies allowed quantitative assessment of resolution and sensitivity. Varied biological applications were chosen to assess the value and robustness of CA imaging including vascular imaging, bone imaging, mapping distribution of viral vectors, and thyroid imaging. A variety of radionuclides were used for these studies, namely, 99mTc, 111In, and 125I. These represent low, medium, and very low energy isotopes, respectively, and would represent a test of CA performance across a wide range of gamma ray energies. It should be noted that 125I, while widely used in biotechnology applications, is generally regarded as a poor imaging isotope because of the very low energy of its gamma rays (principal emission 27 keV, range 27–35.5 keV) and long half-life. However, for mouse imaging, these issues may be less of a problem and, indeed, we were able to obtain reasonable quality images with this nuclide.
Materials and Methods
Hardware Description
Mask. A technical account of the considerations that influenced mask design can be found in Ref [3]. Here, we will simply report that the mask was made of 12 layers of photo-etched tungsten, with pinhole sizes of 1.11 mm, for a total thickness of 1.5 mm. Pinholes are arranged in a mosaic 62 × 62 No Two Holes Touching (NTHT) MURA pattern with 12.5% open fraction for a total of 480 pinholes (Figure 1). This pattern is rotationally antisymmetric about the center, a feature designed to be convenient for artifact reduction. In fact, to reduce near-field artifacts, two CA images need to be taken and added: one with the CA mask and one with the antimask, which is a mask with open and closed positions interchanged. If the pattern is rotationally antisymmetric, we simply use the same mask after a rotation by 90° about its center, making construction of a separate physical antimask unnecessary [4].

Near-field artifact elimination. The method used to eliminate near-field artifacts is demonstrated graphically in these images. Two acquisitions are performed, with the mask and antimask representing equal acquisitions with the mask rotated 90° between the acquisitions. The resulting individual reconstructions (top left, top right) show extensive near-field artifact with “bows” of artifactual gradient visible on each image, and obscuring the object. However, when these images are summed (bottom left), the near-field artifacts cancel, and the object is clearly shown. Subtracting the images cancels the object, showing the near-field artifact only (bottom right).
Camera. The gamma camera used is a Siemens MCAM (Siemens Medical Solutions, Chicago, IL) equipped with a high-sensitivity, low-energy collimator (2.5 mm holes). This camera, developed for small animal imaging, was used with the collimator in place for collimator imaging; and with the collimator removed and replaced by the mask-tower assembly, for CA imaging. For collimator imaging, the animal was laid directly on the collimator surface; while for CA imaging, the animal was placed on the imaging gantry of the mask-tower assembly (Figure 1).
Setup. We chose a geometry with a 9 × 9 cm field of view (FOV), well suited for small animal imaging, by selecting the distances between the mask, the crystal and the animal platform (Figure 1). The animal to crystal distance was 40 cm, the mask to crystal distance was 30 cm. Image acquisition was done as a two-step process, with one half the time spent acquiring the mask image, and the other half the antimask image. Between these two halves, the mask is simply rotated 90°, a task requiring minimal user effort.
Postprocessing. The two images (mask and antimask) so acquired were then used as input for a custom algorithm written in Matlab (Mathworks, Natick, MA) to decode the raw data and sum the mask and antimask images in the final image. We discuss the algorithm and mathematical basis of the decoding process in a footnote.‡
Decoding and summation was performed on a commercial desktop PC. Depending on the acquisition matrix setting on the gamma camera, decoding yielded a 248 × 248 or 124 × 124 matrix image, saved as a TIFF file.
Phantom Studies
A point source was used to measure the point-spread function of the system. This was prepared using 10 μl of 99mTc (50 μCi, 1.85 MBq). Two capillary tubes with an internal diameter of 1.15 mm and a wall thickness of 0.2 mm were filled with 5.55 MBq (150 μCi) of 99mTc each. A third empty tube was placed between these two to act as a spacer. The edges of the radioactive solutions were separated by a space of 2 mm. A thyroid phantom filled with 12.95 MBq (350 μCi) of 99mTc was used for further testing.
Animal Studies
A total of 11 animals were used for these studies, eight rats and three mice (Charles River Labs, Cambridge, MA). These animals were cared for according to institutional guidelines.
Small Animal Bone Scan. Three 250-g Sprague–Dawley rats were injected intravenously with 333 MBq (9 mCi) of Tc-MDP, and imaged 90 min after injection. CA imaging was done over the pelvic area for a total of 30 min (split into 15 + 15 min of mask and antimask acquisition) yielding 62 million counts in all, while collimator imaging was performed for 30 min yielding 6.2 million counts. Imaging was done with the photopeak set to 140 keV with a 15% window width.
Viral Vector and Microsphere Distribution Study. Two 220-g Sprague–Dawley rats were anaesthetized and the external carotid artery surgically cannulated as previously described [5]. All external carotid branches were ligated, and a vascular clamp was placed on the pterygopalatine artery (PPA). A first injection of 2.96 MBq (80 μCi) of 99mTc-Macro-Aggregated Albumin (99mTc-MAA, Syncor, Woburn, MA) was performed into the carotid catheter. CA imaging of the animal was performed at this point, with a 10-min acquisition (split as 5 + 5 min mask and antimask) at a 15% window centered at 140 keV for a total count of 2.27 × 10⁶. he PPA was unclamped and a second injection of 6.99 MBq (189 μCi) of 99mTc-MAA was administered into the carotid. CA imaging was again performed as before, with a total count of 6.92 × 10⁶. Conventional collimator imaging was also performed at this point, with a 5-min acquisition for a total image count of 290 × 103. A third injection was now performed with 2.89 MBq (78 μCi) of 111Indium-oxine labeled HSV administered into the carotid. CA imaging was performed for 5 + 5 min and collimator imaging for 5 min utilizing a medium-energy collimator and 15% window centered at 247 keV, settings appropriate for Indium. Image counts of 2.15 × 10⁶ and 108.6 × 10³ were obtained for the CA and collimator images, respectively.
Radioangiogram in a Mouse. Three 30-g BalbC mice were injected with 56 MBq (1.5 mCi) of 99mTc-MPEG-Polylysine [6], a radiopharmaceutical designed for blood pool imaging and imaged immediately. Imaging was focused to the head and neck region, with part of the body shielded. A total of 40 million counts were recorded over 6 min 30 sec as a split exposure (20 + 20 million counts, 3.25 + 3.25 min mask and antimask exposures, respectively). Imaging was done with the photopeak set to 140 keV and a 15% window width.
Thyroid Imaging. Three Sprague–Dawley rats were injected with 1.85 MBq (50 μCi) of 125I intraperitoneally and imaged 90 min later. The photopeak settings for the gamma camera were adjusted to 51 keV and lower to enable the detection of the low-energy gamma rays of 125I. Collimator imaging with a conventional low-energy, high-sensitivity collimator was done for 5 min, yielding 210 thousand counts. CA imaging was also performed for 5 + 5 min, yielding 1.0 million counts.
The same mask, which was originally designed for 140 keV photons, was used for all these studies.
Results
System Performance
CA reconstructions took about 10–12 sec of computer processing time on a desktop PC. In general, the counts obtained for a CA image is higher than for a collimator image of equivalent time. For 99mTc, this sensitivity increase was approximately 10-fold, with 4.2 × 10⁻³ cps/Bq (9400 cpm/μCi) for the masked imaging system, and 4.4 × 10⁻⁴ cps/Bq (990 cpm/μCi) for the conventional collimator system. This rough relationship appeared to hold for the other isotopes used (111In and 125I) also. The system resolution of the CA system is 1.7 mm, as compared to 4-6 mm for the conventional high-sensitivity low-energy collimator used in our studies. Figure 3 demonstrates the resolving power of the CA system by distinguishing clearly between two closely spaced tracer filled capillaries.
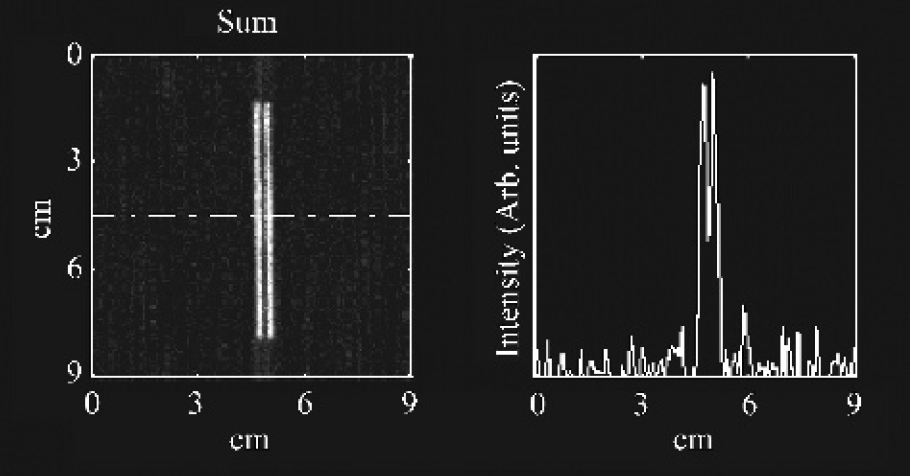
Experimental verification of the CA system resolution. Two capillary tubes were filled with 99mTc-pertechnetate and positioned with an empty capillary interspaced between them. These were imaged for 80 + 80 sec, yielding 2 + 2 million counts. The tube internal diameter was 1.15 mm with a wall thickness of 0.2 mm. The edge-to-edge distance between the radioactive liquid was 1.95 mm with a center-to-center distance of 2.9 mm. The image (left) shows the two capillaries resolved, as confirmed by the profile plot (right).

Bone scan of a rat. 99mTc-MDP (333 MBq, 9 mCi) was injected intravenously, and the animal imaged at 90 min. A 30-min collimator image (left, 6.2 million counts) is compared to a 15 + 15-min CA image (right, 62 million counts) done sequentially on the same animal. Notice how the femoral and tibial physes around the knee are resolved with CA, but not with the collimator image. Similarly, the vertebrae are well resolved on the CA image, but not on the collimator image. Scale bars are 1 cm.
High-Resolution Bone Scan. Figure 4 shows the images obtained of the pelvic area a rat. The proximal and distal physes around the knee joint are shown to be clearly resolved in the CA image, but not in the collimator image. Individual vertebrae can also easily be discriminated in the CA image, while this is only possible for some of the tail vertebrae in the collimator image.
Viral Vector and Microsphere Distribution. Figure 5 shows the distribution of microspheres and contrasts it to the distribution of radiolabeled viral particles in an intracarotid injection model in a rat. The first image shows microspheres distributing to the left cerebral hemisphere using CA imaging after an injection into the carotid artery. During this injection, the internal carotid was the only vessel open, providing direct access to the brain. The second image was done after a repeat injection of microspheres, but with the PPA unclamped, thus allowing microspheres to distribute to both the left hemisphere through the internal carotid artery and to the extracranial structures in the supply territory of the PPA (eye and nose). This second image was a CA image, and should be compared to the third image, which is a conventional collimator image of the same animal showing the same microsphere distribution. Notice the ease with which the eye, brain, and nose can be distinguished in the CA image, while these structures blur together on the conventional collimator image. Also note some activity in the left neck, representing extravasation at the injection site in the neck on both the images. The fourth image was performed after the injection of 111Indium-oxine labeled Herpes Simplex viral particles using conventional collimator imaging. This image clearly shows the dramatic difference between the near-universal distribution of the viral particles, versus the very specific distribution of the microspheres after an identical method of delivery.
Vascular Mapping in a Mouse. Figure 6 demonstrates a radioangiogram of the head and neck region of a mouse. Notice that the left and right neurovascular bundles are easily distinguished in the neck, even though they are separated by only about 6 mm of distance. One even gains an impression of the anatomy of the circle of Willis, with the major intracranial vessels emanating from it. High activity in the region of the nose is likely due to blood pool tracer in the rich vascular beds of the nasal mucosa. Notice that the features in the nose are more diffuse, unlike the vessels noted previously, consistent with rich capillary beds rather than large vessels. A faint anatomic outline is still present, due to diffuse capillary presence of the tracer in all parts of the body. It should be noted that the vascular structures of a mouse are very delicate, with sizes at dissection on the order of 0.1–0.2 mm, and yet these are easily imaged with the appropriate tracer-imaging system combination.

Microsphere and viral vector distributions. Dual tracer study contrasting the biodistribution of 99mTc-MAA microspheres to 111In-oxine labeled HSV virions in a rat. On each of the above images, the outline of the animal was traced in by hand to facilitate interpretation, this is not perfectly symmetrical, because the left paw (reader's right) was folded in and superimposed on the body. Left: CA image at 140 keV showing the distribution of microspheres (2.96 MBq/80 μCi activity, 5 + 5 min exposure, 2.3 million counts) to the left hemisphere only, after injection into the common carotid artery with the external carotid artery territory excluded with a vascular clamp. Microspheres distribute to the left hemisphere only. Center left: CA image at 140 keV after a second injection of microspheres (6.99 MBq/189 μCi activity, 5 + 5 min exposure, 6.9 million counts) with the clamp excluding the external circulation removed. Microspheres now distribute to both the internal and external carotid territories, with activity both in the brain and extracranial structures; notice distribution to the eye (arrowhead) and nose. Center right: collimator image at 140 keV (5 min exposure, 290 thousand counts) demonstrating the same findings as the previous image. Notice the stark differences in resolution between this (center right) and the previous image (center left). The brain and the eye cannot easily be resolved on the collimator image, but are clearly separated on the CA image. Activity in the neck is extravasation related to the surgical vascular access. Right: Collimator image at 247 keV after a third injection of 111In-oxine labeled HSV (2.98 MBq/78 μCi activity, 5 min exposure, 109 thousand counts) into the carotid artery (clamp remains removed). Notice the slight left – right difference on this image due to preferential distribution of virus to the side of the injection, compared to the stark left–right differences seen in microsphere distribution. Scale bars are 1 cm.
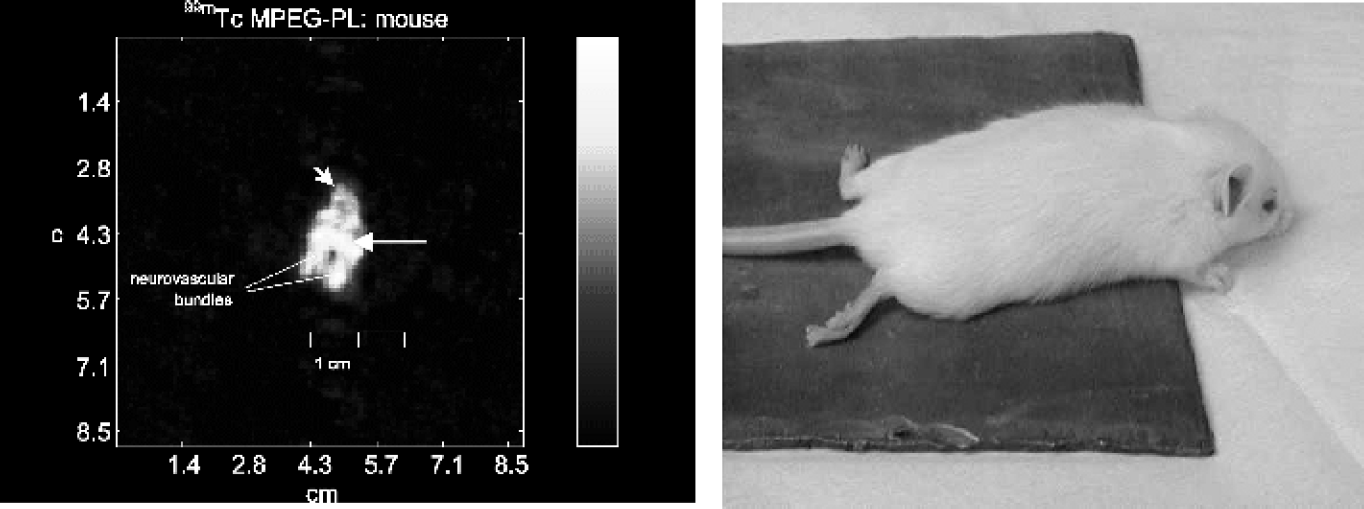
Vascular imaging in a mouse. After intravenous injection of a blood pool agent (99mTc-MPEG-PL, 56 MBq/1.5 mCi), images were obtained focused to the head and neck region of a mouse for 195 + 195 sec, equivalent to 20 + 20 million counts. Left: The CA nuclear image demonstrates the blood vessels in the head and neck, and very nicely resolves the two neurovascular bundles in the mouse neck and also shows the circle of Willis (long arrow). The hypervascularity of the nasal mucosa is also in evidence as shown by its high activity in the nose (short arrow). Right: The experimental setup, showing the positioning of the mouse on lead shielding used to obtain the image of the head and neck area.

125I thyroid imaging with coded aperture imaging. The animal was injected with 1.85 MBq (50 μCi) of activity and imaged at 90 min after intraperitoneal injection. Bottom left: Collimator image (10 min acquisition, 210 K counts) shows the thyroid gland as a diffuse area of uptake in the neck of the rat. Activity at the bottom of the image is stomach uptake. Top: CA reconstruction series shows a “laminographic” view at multiple focusing levels through the animal. The thyroid is shown to be unusual in its imaging appearance, with an eccentric photopenic area to the inferior right of the gland. These findings were interpreted as being consistent with a thyroid cyst or nodule. Notice the very high resolution of the CA images, as compared to the collimator image. Notice also, that CA was well able to produce reasonable images using a traditionally nonimagable radionuclide. Bottom center: Composite image superimposing the CA image on the collimator image, combining the benefits of the high-resolution CA image with the anatomic outline of the collimator image. Bottom right: Postmortem neck dissection confirms the presence of a thyroid cyst (arrow).
High-Resolution Thyroid Imaging with 125 I. Figure 7 contrasts the collimator appearance of the rat thyroid with the CA reconstruction series of the same area using 125I as radiopharmaceutical. We found that it was possible to image even this traditionally “nonimagable” radionuclide with CA imaging. It should be noted that further optimizations of both the CA and collimator images are possible for this isotope. The figure shows a reconstruction series of images (top) typical for CA image reconstructions. These images result from decoding the raw data at different depths. The computer does a reconstruction at different points in the z-direction, selected by the user, taking the given mask–antimask datasets acquired, and provides an image for each depth. In each reconstructed image, features at the selected depths are sharply defined and free of artifacts, while parts of the object at other depths are blurred and show as background noise and artifact. In this way, the reconstruction algorithm produces a set of images at differing depths through the animal, “focused” at each selected depth level. In Figure 7, this yielded an interesting 3-D effect, allowing the viewer to imagine seeing the thyroid in multiple slices. While not strictly a tomographic technique, this “laminographic” effect does aid visualization of complex objects by human interpreters. The figure shows the thyroid to have a curious complex structure when examined by CA imaging. The eccentrically located central photopenic area suggested a cystic or nonfunctioning part of the thyroid, with the spherical configuration of this finding, and seeming displacement and stretching of normal thyroid tissue over its surface, favoring a thyroid cyst. This finding, not suspected from our examination of collimator images, was confirmed at autopsy, where a 3–4-mm cyst was demonstrated in the thyroid. A composite of the collimator and CA images (bottom center) demonstrates the benefits of having both imaging techniques in the same merged image.
Discussion
The signal-to-noise advantage of CA imaging allows great flexibility in tradeoffs for time, dose, or resolution. Resolutions previously possible only with pinhole images are now possible at count rates exceeding conventional collimator images. High resolution (1.7 mm) with a near 10-fold increased count rate compared to collimator imaging yields the favorable statistics needed for these tradeoffs to be beneficial.
CA imaging could be superficially thought of as a hybrid of collimator and pinhole imaging. It is similar to collimator imaging because it does make use of a multihole “collimator” to achieve selective absorption of the photons emitted, in the form of a precisely engineered mask, but unlike a conventional collimator, the mask has a mathematically designed pattern of perforations rather than a regular lattice. It is similar to pinhole imaging because it does image diverging gamma rays emitting from the object, but unlike the simple aperture of a pinhole, the mask casts a complex set of overlapping pinhole images on the imaging crystal. Similar to both techniques, the detector is a sodium-iodide gamma camera, but unlike both, the image formed on this surface is not readily interpretable without computer processing.
The CA raw image is formed by photons passing through each of the individual “pinholes” in the mask, leading to much improved image statistics as compared to conventional pinhole imaging, where a single aperture forms a single image. Because the gamma rays are diverging when they are imaged, the image is magnified, and high resolution is achieved with a low-resolution detector. The price to pay for magnification is a smaller FOV and reduced depth of focus.
The increased sensitivity of a CA system in comparison to a pinhole system is expected, but the roughly 10-fold increase in sensitivity observed when compared to collimator systems is initially somewhat surprising. This experimental finding becomes easy to explain once the geometry of the detector surfaces is considered in each case. Count rates in comparison to pinhole imaging should rise in proportion to the total aperture allowing radiation to reach the detector surface; as more pinholes are added to the mask, the open fraction increases, and system sensitivity increases with it. For conventional collimator imaging though, it is best to consider the proportion of the total radiation emitted by the object that interacts with the detector. In conventional collimation, the radiation interacting with the collimator is a projection of the object in one direction; for a “perfect” collimator, a point source would shine down one collimator hole only, limiting count rates to that intercepted by that small area of the detector surface. Consider though that in CA imaging (as in pinhole imaging), the geometry is so established as to allow a wide solid angle of radiation emitting from the object to be intercepted by the detector. It is this increased fraction of the total radiation emitted that is intercepted, giving rise to the observed increased sensitivity of CA imaging. This effect would of course be modulated as a function of the mask open fraction, the collimator it was compared against, and the geometries involved.
This increased sensitivity is of great importance in small animal imaging, as it is currently common practice to administer supraphysiological doses, often full human doses, to rodents with 1/1000th or less the mass of a human. Improved sensitivity will allow investigators to use more physiologic dosing with acceptable imaging results. Our own bias to such large doses is reflected in the relatively high doses we used in initial studies with 99mTc-labeled compounds, with subsequent reductions in dose with other radionuclides used in our study as the benefit of increased sensitivity became clearer.
CA systems have been previously described in astronomy [7–9] and physics applications [10,11]. CA imaging was even reported in medical applications [12,13], with favorable early clinical reports [14,15]. Historically, the technique has been limited by the presence of imaging artifacts and lengthy postprocessing. To address these problems, we have applied the results of some recent developments in the field [4].
CA theory shows that in a far-field geometry (i.e., when all rays coming from the same part of the object have the same incidence angle at the detector), the reconstruction algorithm can produce an exact copy of a planar object. Unfortunately, typical nuclear medicine applications present a near-field geometry, which alters this ideal behavior. Near-field artifacts, then, corrupt the image (Figure 2). These imaging artifacts are the results of near-field distortions, and first arose in the medical imaging scenario, as most previous uses of CA techniques in astronomy were far-field applications. Astronomy applications had dealt with practically infinitely remote point sources, while medical imaging dealt with relatively large objects at short distances. In far-field conditions, the incident rays from a single point are essentially parallel, and impinge on the detector surface with the same angle. Angle of incidence thus encodes position. This is not true in medical imaging, where near-field conditions hold. Gamma rays emitting from the object are not parallel, and impinge on the detector surface at differing angles, and thus, the angular encoding of position is lost. This additional complication gives rise to ambiguity in the decoding of images, and leads to unacceptable artifacts in the reconstructed images.
Recent work [4], however, has shown that near-field artifacts can be eliminated by dividing the image acquisition into equal halves, using a rotationally asymmetric mask to acquire each half image with the mask position interchanged between the two acquisitions. The mask pattern is chosen in such a way that the first position (the mask image) differs from the second position (the antimask image) by having every pinhole aperture previously open interchanged with a closed position. This gives rise to a completely different pattern of overlapping pinhole images on the crystal. In the two images so produced, the object remains the same, but artifacts change sign, so that when the two images are summed, the artifacts cancel out while the object is reinforced. Sample results are presented in Figure 2, which shows the mask and antimask image for a thyroid phantom. Either of these pictures, singularly, would be the endpoint of classic CA imaging. At the bottom left is shown the result of the summation of the two images. Near-field artifacts, whose shape is evident in the subtraction image, are eliminated.
The mask design has an odd symmetry such that a simple 90° rotation produces the open-close interchange desired, as opposed to having two separate masks to achieve this purpose [16]. For 2-D applications, this novel advance provides an alternative less demanding in terms of algorithm complexity and computational speed than nonlinear iterative techniques. A similar antisymmetrical mask rotation was previously described in an unrelated astronomical context [17] to obtain more uniform background counts, however, to our knowledge, this has never before been applied as a near-field imaging artifact reducing strategy.
There is future potential for 3-D imaging using CA technology. Our current setup has an experimentally determined focusing depth of about 1 cm, ideal for small animal imaging, whose thickness typically approaches this measure. Conversely though, whole body imaging on larger animals would not be possible with our current setup. Smaller body parts of such larger animals could still be imaged though, with appropriate shielding. Software processing allows very basic “laminographic” imaging, with the reconstruction of multiple imaging “planes” through the imaged volume at user-specified intervals. This aspect of CA imaging is the subject of further research investigation.
There are some limitations to the use of CA imaging. The technique works best for point-like sources and studies where activity is concentrated in focal areas. The signal-to-noise benefit is less apparent where activity is spread diffusely, and as a result, a poorly defined low count outline may be better demonstrated using conventional collimator imaging. However, most tracers are designed to target a specific tissue or location, with resulting favorable characteristics for CA imaging. This issue is related to the noise distribution of the image. In fact, due to overlap in the projection (multiplexing), counting noise from all sources in the FOV potentially contributes to noise at all locations in the image, including those regions with no activity. The reader interested in the mathematical details of the signal-to-noise ratio in CA imaging is referred to Ref [3]. Here we note that with the mask pattern we chose, activity at one point contributes noise to itself and to every other reconstruction position in the image, both horizontally and vertically. In the background of a point source image, it is therefore possible to see a faint structure in which every other reconstruction position is not completely dark, while all other positions are. This effect, however, is typical of highly structured objects, such as the line sources of Figure 3, and disappears soon when slightly more complex objects are imaged. For example, uniform activity on a 2 × 2 reconstruction position area exactly fills in the gaps, giving a completely uniform distribution of noise equivalent to common background. Thus, in biologically relevant cases, noise is uniformly distributed.
The small FOV (9 × 9 cm) in our setup could also be seen as a limitation of CA imaging. Objects larger than the FOV cannot be imaged, unless the object is scanned, because this would introduce partial encoding artifacts. These arise when activity is placed slightly outside the FOV because only a part of the mask pattern is projected on the detector and takes the shape of aliasing in real space (i.e., objects disappear from the left [top] of the image to appear at its right [bottom]). It should be noted that: First, within the 9 × 9 cm FOV, where we took care to place all our objects, no border artifacts are present. Second, if the object is larger than the FOV, border artifacts are prevented by shielding (typically with lead sheets) those parts of the animal outside the FOV. Finally, masks could be designed to image a larger FOV, but at the expense of resolution, assuming the rest of the system to remain unchanged.
It is important to recognize that coded aperture imaging goes through the complication of producing and separating many projected image copies because using many copies to generate an image is expected to yield better statistics than a single image, as in pinhole imaging. However, superposition of the different copies implies that the different sets of counts are not taken with statistical independence. Therefore, only if super-impositions are limited or interest is mainly in the bright parts of the image, will the increased sensitivity translate into improved signal-to-noise ratio, which is the only true image quality indicator, though difficult to measure. The conditions under which CAs outperform classical methods are found in Accorsi et al. [3]. As a rule of thumb, the best results are obtained when relatively few pixels (roughly one third or less) in the image have activity. As our experiments show, such cases are quite common and occur in many, but certainly not all, biological imaging scenarios. As an example, we estimated the signal-to-noise ratio advantage over a parallel-hole collimator in the case of the side view of a mouse skull bone scan. After direct measurement on the image, the signal-to-noise ratio of the collimator was corrected by a factor equal to the square of the relative resolution for a fair comparison. In this case, theory estimated an advantage of 2 for points of average intensity and 3 for the point of maximum intensity. Direct measurement indicated an advantage of 1.3 and 2, respectively, which would be typical of bone scan images (such as Figure 4).
Future developments in CA imaging will likely deal with a wider range of radiopharmaceuticals. Higher mask penetration causes CA images to lose signal-to-noise ratio but introduces no artifacts. Further development of masks optimized for isotopes emitting gamma rays harder than 99mTc, such as 111In and 18F, as well as for lower energies, such as 125I, is ongoing.
Footnotes
‡
A description of the algorithm starts from the observation that the data recorded by the detector ![]() )
)
This first step is a purely physical process. Its endpoint is the encoded image. The reconstructed image ![]() indicates that the reconstruction of the object is given, as in all linear systems, by the convolution of the original object with a kernel, the point spread function (PSF) of the system, where
indicates that the reconstruction of the object is given, as in all linear systems, by the convolution of the original object with a kernel, the point spread function (PSF) of the system, where
The choice of the pair (![]() , we see that
, we see that
Near-field artifacts arise from the fact that Equation 1 does not hold in near field, which introduces nonlinearities, leading to an integral more complicated than a simple correlation. A complete analysis [![]() ] shows that near-field artifacts are additive (i.e., add an artifact having the same sign of
] shows that near-field artifacts are additive (i.e., add an artifact having the same sign of
When the antimask (1 -
From Equations 5 and ![]() , we can see that adding the two reconstructions cancels near-field artifacts, giving the ideal image.
, we can see that adding the two reconstructions cancels near-field artifacts, giving the ideal image.
Acknowledgments
This research is funded in part by NIH grant P50 CA86355.