
Abstract
This inquiry used ultrasonic waves to uptake paracetamol (PA) by using oak-based activated carbon (ACO). The surface of ACO was explored based on FT-IR, SEM, and XRD before and after the adsorption. The kinetic data for PA adsorption onto ACO corresponds to a pseudo-second-order kinetic model. Isothermal models of the Langmuir, Freundlich, D-R, and Temkin were used. The adsorption of PA onto ACO was found to be a monolayer with 96.03% uptake, which corresponds to Langmuir. The thermodynamic experiments revealed the endothermic nature of PA adsorption onto ACO. Under the investigated optimal conditions, the adsorption capacity of PA onto ACO was found to be 97.1 mg. L-1. ACO could be recycled after six regenerations. Ultimately, sonicating has adequate performance for the uptake of PA by ACO.
1. Introduction
Hazardous material pollution has recently grown into a significant concern throughout the world. Recent research has focused on the efficient removal of such contaminants to reduce the threat that they pose to living organisms [1]. Diverse forms of organic pollutants, such as pharmaceuticals, were detected in a wide range of water supplies. Since pharmaceuticals are essential to preserving human and animal health, their production has grown significantly in recent decades. These pharmaceutical compounds are regularly released in enormous quantities into the environment, mainly through water and soil, from a diversity of sources, including anthropogenic activities, the pharmaceutical industry, and hospitals [2]. Due to its efficacy in relieving pain and fever, paracetamol, also known as acetaminophen (Scheme 1), is one of the most used medications globally. Because of its solubility and hydrophilicity, paracetamol concentrates readily in water. Paracetamol decomposes gradually in the environment since it is not biodegradable [2]. Paracetamol is particularly toxic to the liver, posing a risk of hepatitis development [3]. In the past, significant efforts were made to improve water treatment processes. As a result, many effective techniques for discarding pharmaceutical micropollutants from polluted water were developed.

Paracetamol (acetaminophen) C9H8NO2.
Various techniques were employed for removing pollutants from water, such as filtration, chemical precipitation, coagulation, ion exchange, ozonation, advanced oxidation, reverse osmosis, biodegradation, and adsorption processes [4]. Adsorption is a broadly used technique for removing pollutants from water due to its exceptional efficiency, low toxicity, modesty, environment-friendly, nondestructiveness, and insignificant cost [5]. The most prominent adsorbent for extracting contaminants, specifically from water, is activated carbon due to its adaptability and attractive characteristics, such as its high surface area, porosity, and distinct chemical properties, which enable interaction with various chemical substances [6]. Activated carbon has been prepared using a variety of precursors in frequent studies. Among these precursors is oak fruit. Oak (Quercus calliprinos) is a prevalent plant in the Eastern Mediterranean, growing on rocky hillsides. It is indigenous to Jordan and can be found in Salt, Ajlun, Jerash, Amman, Tafila, and Shobak. The fruit of the oak is a nut called an acorn that grows in a cup-like structure (called a cupule). In many investigations, the uptake of paracetamol from aqueous solutions by adsorption onto activated carbon was performed based on the shaking technique assisted with sonication. Also, numerous studies used modified activated carbon such that modified by aminoterphthalic acid [7]. Sonication boosted the migration of pollutants into activated carbon pores, causing higher efficiency [8].
The aim of this study is to prove the effectiveness of using just sonication in removing paracetamol from an aqueous solution and simulated samples. Numerous variables, including adsorbent dose, initial concentration, contact time, and pH, were examined for their effectiveness. The equilibrium and mechanism of the adsorption process were examined by kinetic and isothermal investigations.
2. Materials and Methods
2.1. Reagents and Instruments
Paracetamol with a purity of >99% (Scheme 1) was acquired from Sigma Aldrich and used without any more cleansing. This analgesic was chosen for its widespread production and consumption around the world. Calculated amounts of powder standards from PA were dissolved in distilled water to prepare stock solutions (250 mg. L-1). The prepared solutions were kept out of the light at 4°C. Operative concentrations (10–100 mg L-1) were prepared from stock solutions by dilution. Solutions of 0.1 M NaOH and 0.1 M HCl were employed for pH adjustment. FT-IR instrument (TENSOR from Bruker) was employed for the functional groups evident on the activated carbon surface and their implications in the adsorption. The LEO 1550 scanning electron microscopy (SEM) was employed to obtain images of the adsorbent surface. X-ray diffraction patterns were obtained from an XRD D5005 diffractometer (Siemens, Munich, Germany).
2.2. Preparation and Characterization of Adsorbent
The abundant oak cupule was collected as waste from the north of Jordan in the summer. Subsequently, the oak cupule was repeatedly rinsed with distilled water, dried at 80°C for 48 hours, and then crushed. The crushed sample was used to prepare activated carbon according to the method [9]. The prepared activated carbon was ground and sieved to obtain particles of 180 μm particle size. Finally, the prepared activated carbon was stored in a desiccator and employed for paracetamol uptake.
2.2.1. Characterization of ACO
The surface morphology of ACO was explored using techniques of scanning electron microscopy (SEM), Fourier transform infrared (FT-IR), and X-ray diffraction (XRD).
2.2.2. Bach Adsorption Experiment
All experiments were performed using a laboratory ultrasonic water bath (Branson 5800, USA). Each experiment was performed three times. A 50.0 mL of PA solution at different concentrations was added to a weighed amount of ACO into a 250 ml of the Erlenmeyer flask. The mixtures were sonicated for a particular time. The mixtures were filtered and subjected to absorbance measurements to determine the concentration. The effects of sonication time, initial PA concentration, adsorbent dose, solution pH, and temperature were investigated. A UV-6100 PC double-beam spectrophotometer was used to investigate the PA concentrations at a wavelength of 244 nm. The adsorbed amount of PA onto the ACO, qe (mg. g-1), was calculated using Equation (1) [10, 11].
The removal percentage was calculated based on Equation (2).
3. Results and Discussion
3.1. Characterization of Adsorbent
3.1.1. FT-IR Analysis
FT-IR analysis (Figure 1) was performed for ACO adsorbent and ACOPA (the coated ACO with paracetamol after the adsorption process). The results revealed the existence of various functional groups. Results were summarized in Table 1 [9]. As a result, there are obvious shifts in absorbance and changes in intensity confirm the adsorption of PA onto ACO.

FT-IR analysis of ACO and ACOPA.
FTIR results.
3.1.2. SEM Analysis of Adsorbent Material
Figures 2(a) and 2(b) show SEM images of the surface morphology of ACO adsorbent and ACOPA after paracetamol adsorption. The distinct difference between the two images, as well as the aggregates recognizable in Figure 2(b), confirm the paracetamol adsorption onto the ACO surface.

SEM analysis of (a) ACO and (b) ACOPA.

3.1.3. XRD Analysis of Adsorbent Material
The crystallographic structure of ACO and ACOPA was determined using XRD analysis. The obtained spectra are depicted in Figure 3. The obvious changes in intensity and peak broadening confirm the accumulation of PA onto the ACO.

XRD analysis of ACO and ACOPA.
3.2. Batch Adsorption
3.2.1. Influence of Adsorbent Dosage
The effectiveness of the adsorption process is strongly affected by the adsorbent dosage. In this study, the dosage of ACO varied from 10 to 100 mg. At
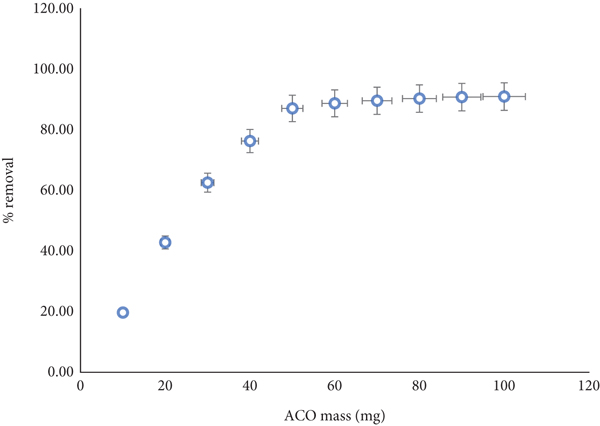
Influence of adsorbent dosage on the adsorption of PA onto ACO (
3.2.2. Influence of Sonication Time
Contact time (sonicating) was one of the factors that had a significant impact on the effectiveness of the adsorption process. The batch adsorption experiments were conducted by sonication of 50 mg ACO with 50 ml of 50 mg, L-1 PA concentration at 7.0 pH, and

Influence of contact time on the adsorption of PA onto ACO (
3.2.3. Influence of PA Initial Concentration
Figure 6 demonstrates how the initial concentration of the adsorbate substantially impacts the adsorption of PA onto ACO. In this study, the initial concentration of PA varied from 10 to 90 mg. L-1. In the first stages, the change in adsorption is likely to be negligible until it reaches 50 mg. L-1 due to the availability of achievable active sites. After the optimal initial concentration (50 mg. L-1), the uptake starts to drop due to the saturation of active sites with PA molecules.

Influence of PA initial concentration on the adsorption onto ACO (
3.2.4. Influence of pH
The pH of the solution is a crucial parameter in the adsorption process. Firstly, the value of pHpzc was determined by shaking 150 mg of ACO adsorbent with 50.0 ml of 0.1 M NaOH solution for 24 hours at a pH of 2, 4, 6, 8, 10, and 12. Figure 7 shows the pHpzc is equal to 6.39. For pH values exceeding pHpzc, the adsorbent surface of ACO becomes negative, whereas, for values beneath pHpzc, it becomes positive [12].

pHpzc for ACO.
In this study, the impact of pH on the adsorption of PA onto ACO was investigated at a temperature of

Paracetamol (acetaminophen) structures in acidic and basic solution.
The optimal adsorption of PA onto ACO was recorded at pH 5.0, as Figure 8 shows. Adsorption was maximal at an acidic pH because the phenols continued to remain undissociated, and the interactions between the ACO adsorbent and the PA were issued. Equilibrium was achieved at pH 7.0, then rapidly deteriorated beyond pH 9.0 as a result of the repulsion between the negatively charged ACO surface and the anionic (deprotonated) paracetamol [13].

Influence of pH on the adsorption of PA onto ACO (
3.3. Adsorption Kinetic and Mechanism
The kinetics and the mechanism of PA adsorption onto ACO were investigated using pseudo-first-order, pseudo-second-order, and intraparticle diffusion kinetics models. Plotting kinetic data according to Equations (3) and (4) [14] determines whether the PA adsorption onto ACO was first or second order. Results in Figure 9 indicate that the process is of pseudo-second order with an

Kinetic studies of PA adsorption onto ACO (
The intraparticle diffusion model represented by Equation (5) was employed for the demonstration of PA adsorption onto the ACO mechanism [15].

Intraparticle Diffusion model for Pa adsorption onto ACO.
Table 2 summarized the
Kinetics constants.
3.4. Adsorption Isotherms
Adsorption isotherms play a crucial role in elucidating the interaction between the adsorbate molecules and the adsorption sites on the surface. Isothermal models Langmuir, Freundlich, Temkin, and Dubinin-Radushkevich (D-R) isothermal models were employed to elucidate the adsorption mechanism of PA onto ACO. Equations (6), (7), (8), and (9) represent the nonlinear form of the Langmuir, Freundlich, Temkin, and Dubinin-Radushkevich (D-R) isotherm models, respectively [10, 11].
Figure 11 demonstrates the results of the fourth isotherms. Correlation coefficients (
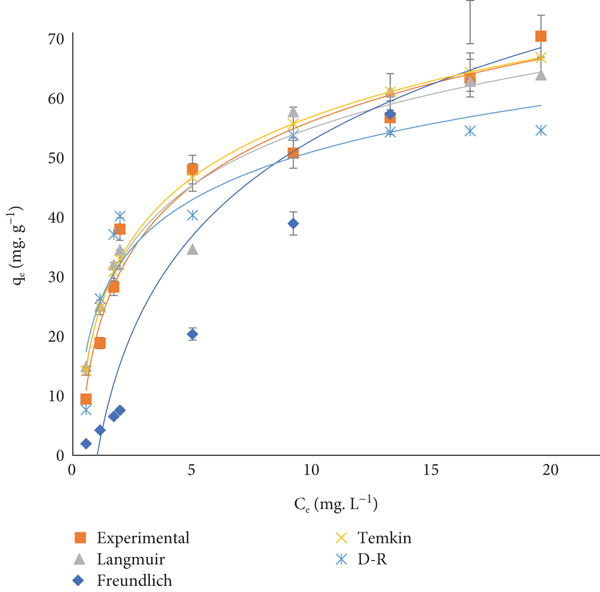
Langmuir, Freundlich, Temkin, and D-R isotherms of PA adsorption onto ACO.
Isotherms model constants.
3.5. Thermodynamics
Thermodynamic parameters ΔG°, ΔH°, and ΔS° were assessed to evaluate the efficiency of PA adsorption onto ACO (Table 4). The slope and intercept of the plot of ln (KL) versus 1/T (K-1) were used to get the enthalpy change ΔHo (kJ mol-1) and entropy change ΔSo (J/mol-1 K-1) of PA adsorption, respectively. The Gibbs free energy, ΔG°, was calculated using Equation (12), enthalpy, ΔH°, and entropy, ΔS° was possible to calculate using Equation (13) (Van’t Hoff’s).
Thermodynamic parameters of PA adsorption onto ACO.
3.6. Simulated Sample
A tablet of three commercial medicines containing PA was dissolved in tap water and sonicated with 50 mg ACO for 60.0 min under optimal conditions. The PA uptake was found to be 81.78%, 84.27%, and 83.12%, confirming the effectiveness of ACO in the uptake of PA by sonication.
4. Comparison with Other Activated Carbon Adsorbents
The maximum PA uptake capacities by ACO based on sonication was compared to other activated carbon adsorbent based on the shaking technique (Table 5). The comparison shows that ACO has an adsorption capacity of 97.91 mg g-1 near to many of the other reported adsorbents.
Comparison of PA adsorption onto ACO with other reported adsorbents.
5. Desorption and Regeneration Study
Sodium hydroxide is found to be the best for the regeneration of PA adsorbed [28]. 1.0 M of NOH was used for the elution of PA from the ACO surface. The percentage of desorption was calculated using Equation (14).
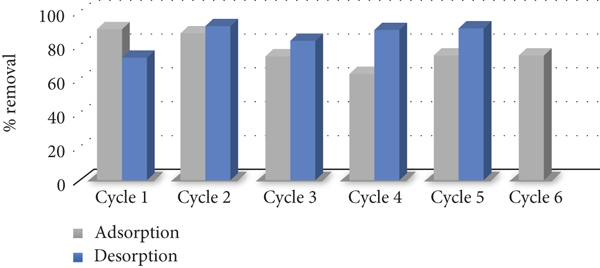
Regeneration of ACO adsorbent.
6. Conclusion
This study revealed that the PA is successfully uptake from an aqueous solution and simulated sample by activated carbon prepared from an oak cupule (ACO) by solely sonication. The experimental results demonstrated that the adsorption potential of PA onto ACO adsorbent is adversely impacted by operative factors such as sonication time, pH, adsorbent dose, temperature, and PA initial concentration. Maximum uptake (96.03%) of 50 mg g-1 PA was achieved after 60 minutes of sonication with 50 mg ACO at 45°C and 5.0 pH. The adsorption isotherm data best fit the Langmuir model. Information from the kinetic studies indicated that the pseudo-second-order kinetic model was in better agreement compared to the pseudo-first-order kinetic. Thermodynamically, the adsorption of PA onto ACO was found to be endothermic and nonspontaneous. ACO could be reused after six cycles with decrease in efficiency by 14.89%.
Footnotes
Data Availability
The data that support the findings of this study are available from the corresponding author upon reasonable request.
Conflicts of Interest
The authors declare that they have no known competing financial interests or personal relationships that could have appeared to influence the work reported in this paper.
Authors’ Contributions
All authors contributed to the study conception and design. Material preparation, data collection, and analysis were performed by all authors (Alaa Mahmoud Al-Ma’abreh, Gada Idris, and Mike Haddad). The first draft of the manuscript was written by Alaa Mahmoud Al-Ma’abreh, and all authors commented on previous versions of the manuscript. All authors read and approved the final manuscript.