
Abstract
Local natural clay from Sulaimani zone-Takiya (TKC), Kurdistan Region of Iraq, was characterized and used for the removal of basic fuchsin (BF) dye from laboratory bacterial wastewater. The characterization of the adsorbent was carried out with XRD, XRF, and FT-IR. The clay sample was dominated by vermiculite. Adsorption tests under different conditions of contact time, pH of the solution, temperature, initial dye concentration, and adsorbent amount were performed to analyze the effect of various experimental parameters. Equilibrium time was reached within 180 minutes, and maximum BF adsorption was achieved at pH 6.8 at a temperature ranging from 20 to 50°C. The experimental data fitted the pseudo-second-order kinetic model, with the activation energy of 22.68 kJ·mol-1. Adsorption isotherms could be well-fitted by the Langmuir isotherm model. The thermodynamic parameters such as
1. Introduction
Basic fuchsin (BF) is a fluorescent dye-containing mixture of rosaniline, pararosaniline, new fuchsine, and magenta II. The molecular formula is C19H17N3 • HCl, and the maximum absorption wavelength is λ-max. UV-spectrophotometry is at 546 nm. BF is used for the detection of acid-fast bacilli and is commonly used in gram staining and a mixture with phenol for acid-fast staining of mycobacterium (tuberculosis and leprosy) in the procedure described by Ziehl-Neelsen [1]. Also, BF is used as a coloring agent in the industry for textile and leather materials [2].
Wastewater contaminated by BF could be released into the environment from the sewage of the medical laboratories or the textile and leather industry. Because of their low biodegradability, some of these dyes have been reported to accumulate in surface water and sediments which may be environmentally hazardous [3]. Repeated exposure to this dye may cause toxicity and carcinogenic and mutagenic effects. In addition, its effect on the nervous system like headache, dizziness, muscle contraction, and ingestion system may cause gastrointestinal irritation with nausea and vomiting [4].
Various biological, chemical, and physical methods such as biodegradation, Fenton-biological treatment scheme, chemical oxidation, ozonolysis, filtration, ionic exchange, photodegradation, membrane technologies, coagulation/flocculation, and adsorption were tested for removing wastewater dye [5]. Although these are very efficient techniques, most of them present several drawbacks like high cost, incomplete elimination of the contaminants, and generation of sludge or by-products. Biodegradation is a low-cost method, but the bacterial strain was usually feasible for special dyes only and toxicity also posed problems for bacteria. Also, a few biosorbents have been employed recently for the removal of BF in aqueous solutions [4, 6].
There is not much research involving the use of clay minerals for the adsorption and removal of BF from wastewater. However, related materials were tested such as modified red mud [7], natural clinoptilolite modified with apolaccase [8], and alkali-activated diatomite [9]. For these materials, the maximum adsorption capacity was 333 mg·g-1 (
Among adsorbents such as fly ash [10], silica gel [11], wood [12], biogas slurry [13], activated carbon, and clay materials, clay-based materials can be considered as the most abundant and cheap raw materials which showed high adsorption capacity for colored compounds in wastewater [14, 15].
Vermiculite clay minerals are naturally occurring trioctahedral 2 : 1 phyllosilicate. They possess permanent negative charges and only partly exchangeable and hydrated interlayer ions like Ca2+, Mg2+, and Na+. Vermiculite is a natural and modified material that was used for the adsorption and removal of many types of textile dyes from wastewater [16]. Vermiculite adsorbed 107 mg·g-1 of basic blue [17] and 2.2 mg·g-1 of pyronine Y [18]. Also, methylene blue and crystal violet onto natural vermiculite were investigated. Maximum dye loading was 0.083 and 0.103 mmol·L-1, respectively [19]. Vermiculite was also used as a composite (AgI-Bi2MoO6/vermiculite) for the adsorptive and photocatalytic degradation of dyes [20]. In the present work, it was tried to test the adsorption and removal of BF from wastewater using locally available vermiculite. The reason for using vermiculite and not smectite is that it has a larger (negative) charge (>0.6 per formula unit), arising mostly from the substitution of Al3+ for Si4+ in tetrahedral sites [21, 22].
The hydrophobic character is a feature of BF molecules when occurs at a higher pH value, but at low pH values, its hydrophilicity and solubility are enhanced because the amino group of BF reaches the ionized state [23].
The present study is aimed at characterizing the TKC local clay and investigating the possible use of this clay as an efficient available and cheap adsorbent for wastewater treatment, due to the wide usage of BF dye and its toxicity in the wastewater.
2. Materials and Methods
2.1. Materials
Basic fuchsin (BF) is a dark green powder that will turn red in solution. Its molecular formula is C19H17N3 • HCl, and its maximum wavelength is 546 nm. Natural clay (TKC) was used in the adsorption process for the removal of basic fuchsin dye from wastewater.
2.2. Characterizations of Adsorbent
The chemical composition of the powdered TKC was determined by XRF with a PANalytical Axios spectrometer (ALMELO, Netherlands). The clay samples were prepared by mixing with a flux material (lithium metaborate Spectroflux, Flux No. 100A, Alfa Aesar) and melting into glass beads. The beads were analyzed by wavelength dispersive XRF. To determine loss on ignition (LOI), 1000 mg of sample material was heated to 1030°C for 10 min. XRD pattern was recorded using a PANalytical X’Pert PRO MPD θ-θ diffractometer (Cu-Kα radiation generated at 40 kV and 30 mA), equipped with a variable divergence slit (20 mm irradiated length), primary and secondary soller, Scientific X’Celerator detector (active length 0.59°), and a sample changer (sample diameter 28 mm). The samples were investigated from 2° to 85° 2θ with a step size of 0.0167° 2θ and a measuring time of 10 s per step. For specimen preparation, the top-loading technique was used. For the detailed clay mineralogical investigation, a texture slide of the <2 μm fraction was prepared. 15 mg per cm2 clay was used to record an XRD scan. An aliquot of 1.5 mL of suspension was deposited on the circular (
2.3. Adsorption Studies
Adsorption experiments were carried out in batch systems to achieve the optimum operating conditions for the removal of the selected dye 0.1 g of clay mixed with 50 mL BF dye solutions of the desired concentration in 100 mL polyethylene dark bottles in a thermostatic shaker bath (GFL 1083) at the desired temperatures (20–50°C). After 5–300 min, the dispersion was centrifuged at 4000 rpm for 5 minutes to remove the clay from the solution which was spectroscopically investigated concerning its dye concentration. A Cary 60 UV-Vis spectrophotometer adjusted to 546 nm was used. The adsorption capacity (
The impact of the contact time was first evaluated by varying the contact time (0 to 300 min) at room temperature. The initial pH effect of the BF solution was investigated in the range from 2.0 to 11.0. Different BF concentrations (10 to 400 mg·L-1) were utilized to study the impact of the initial BF concentration. The weight of the clay was varied from 0.025 to 0.25 g.
2.4. Desorption of BF from the TKC
To conduct the desorption experiments, the adsorption procedure was carried out using 0.1 g TKC with 50 mL of 150 mg·L-1 BF shaking for 180 minutes at 30°C. The adsorbed BF onto TKC was separated from the solutions and allowed to air-dry until it had reached a constant mass. By accounting for the dye concentrations in the solution that remained after the treatment, the amount of dye that had been absorbed was calculated. Following that, 2.00 g of dry, BF-adsorbed TKC was mixed for 1 hour with 50.0 mL of pH-adjusted water and then left to stand for 1 hour. The amount of desorption was estimated, and the concentration of BF that was leached out was calculated. For various beginning pH ranges (2-12), the desorption experiment was repeated.
3. Results and Discussion
3.1. Characterizations of Adsorbent
X-ray diffraction patterns of TKC are shown in Figure 1 for random powder, air-dried, and ethylene glycol (EG) saturated mounts. The peak observed at 14.2 Å was almost entirely shifted to 16.3 Å with EG saturated pointing towards the dominance of vermiculite [24] because smectite would shift to higher values. The powder pattern (randomly oriented mounts) proved the presence of calcite 3 Å, quartz 3.4 Å, muscovite 9 Å, and chlorite (mainly based on the (002) basal reflection at 7.1 Å and the remaining intensity at 14 Å after EG solvation).

XRD pattern of random powder, air-dried, and EG saturated.
The FTIR spectra of the TKC clay sample are dominated by a trioctahedral 2 : 1 clay mineral (vermiculite) as indicated by XRD (Figure 2). The spectra at 3622 and 3420 cm−1 and 3547 cm−1 were assigned to the OH-stretching of vermiculite and Fe-chlorite, respectively [25, 26]. OH-bending of water was determined by the bands at 1796 and 1637 cm−1, while the bands at 2412, 1900, 1431, and 712 cm−1 were due to calcite [27]. The identification of quartz was characterized by the doublet spectra of 792 cm−1 and 800 cm−1. The main spectral feature at about 1027 cm−1 was related to the Si-O stretching of all silicates present in the sample. Infrared spectroscopy confirmed the qualitative mineral composition determined by XRD. However, X-ray fluorescence (XRF) was used for determining the chemical composition of TKC, which is following XRD and IR data. The XRF values were 46.4, 0.7, 13.3, 6.4, 0.1, 4.6, 10.6, 0.7, 2.1, 14.7, and 99.8 mass% for SiO2, TiO2, Al2O3, Fe2O3, MnO, MgO, CaO, Na2O, K2O, LOI, and the sum of elements.

FTIR spectra of the TKC clay.
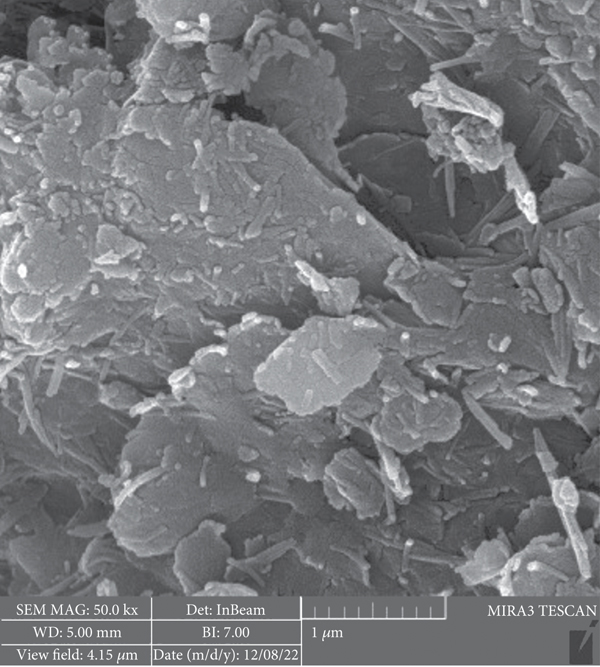
The morphological properties of TKC before and after BF adsorption were analyzed by using scanning electron microscopy (SEM) which is a valuable tool for precise measurement and analysis of very small features and the morphology of the sample. A flake-like TKC adsorbent particle’s surface is shown in Figure 3, both before (Figure 3(a)) and after (Figure 3(b)) BF adsorption. As can be observed in Figure 3(a), TKC has a rough surface with pores that can be identified as dark spots. These pores are then filled with BF dye molecules following adsorption as shown in Figure 3(b). It was possible to see the pores becoming blocked and the material shrinking as a result of BF adsorption.

SEM of the TKC: (a) before BF adsorption; (b) after BF adsorption.
3.2. Adsorption Studies
3.2.1. Study the Effect of Contact Time
The study of the contact time effect on the adsorption of BF dye was carried out at different temperatures (Figure 4). The quick absorption of the dye can be noticed in the first 50th minutes of the adsorption process, which is due to the presence of a high number of empty adsorbent sites and the high affinity of solute concentration to the surface. The adsorption rate becomes slower after a period (>2 hours), and equilibrium was reached after 180 min of shaking the solution of the BF dye and TKC adsorbent at different temperatures. A 240-minute reaction time was used as a reference to ensure that equilibrium was reached and approached the constant values 72.75, 72.91, 73.5, and 73.8 mg·g-1 at 20, 30, 40, and 50°C. The rate of dye adsorption onto the interior sites of the adsorbent particles in batch adsorption was controlled by the adsorption of dye molecules in the bulk solution onto the interior sites of the adsorbent particles [28].

Effect of contact time on the adsorption of 150 mg·L-1 of BF dye on TKC at different temperatures.
The results (Figure 4) illustrate that increasing temperature may enhance the diffusion rate of the BF molecules from the bulk solution to the adsorbent surface, which means that there is a directly proportional relationship between temperature and the adsorption capacity of BF by TKC.
3.2.2. Study the Effect of the pH of the Solution
To investigate the effect of pH on TKC adsorption capability, the study was carried out with various initial pH levels ranging from 2 to 11. The removal efficiency (percent) and adsorption capacity (mg·g-1) were shown versus the various initial pH. The adsorption is found to be strongly reliant on the pH of the solution, which influences the adsorbent’s surface charge, degree of ionization, and dissociation of various functional groups on the active sites [29]. The dye’s highest uptake occurs at pH values greater than 4, as seen in Figure 5, which is likely due to the hydrophobic nature of BF at higher pH values.
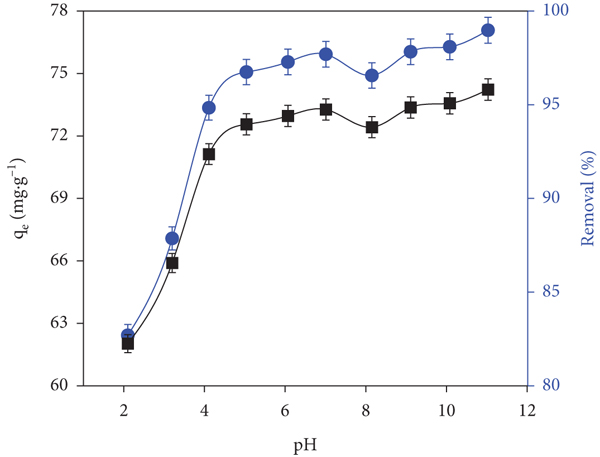
Effect of pH on the adsorption of 150 mg·L-1 of BF on TKC at 30°C.
Therefore, all the subsequent studies were performed at the normal pH of the dye which was 6.8. The clay, however, is trioctahedral, and as a result, variable charge effects are supposed to be restricted to higher pH values.
3.2.3. Point-Zero Charge (PZC) of Adsorbent
The PZC of the clay was measured using the pH drift method (Khan and Sarwar 2007). Series solutions of different pH were prepared by using HCl and NaOH; 0.1 g of the TKC was added to 50 mL of each adjusted solution in a sealed vial and equilibrated for 24 hours. The final pH was measured and plotted against the original pH; the PZC was determined as the pH at which the curve crossed the
PZC of TKC (Figure 6) also explains the reason for the high adsorption of BF around neutral pH. The TKC adsorbent surface becomes negatively charged at pH values higher than 8.2, whereas it is within the opposite state for
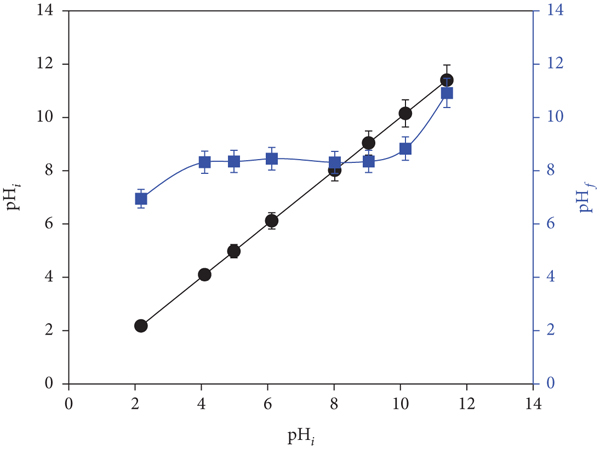
Determination of point of zero charges (
3.2.4. Study the Effect of Adsorbent Dosage
Applying varying concentrations (0.025 to 0.25 g) of adsorbent while maintaining all other experimental conditions constant (50 mL BF dye Co =150 mg·L-1, pH =6.8, temperature =30°C, and 240 min equilibrium time shaking) was used to determine the adsorbent dosage influence. As shown in Figure 7, the adsorption capacity (mg·g-1) and removal efficiency (percent) were plotted versus the clay weight dosage. When the overall surface area of the adsorbent (the number of adsorption sites) grows, as does the amount of the adsorbent, the percentual absorption removal of BF dye increases, until it reaches an equilibrium to approach the constant value of 74.38 mg·g-1 adsorption capacity, or 99.17% removal. As a result, TKC is considered a more effective adsorbent when compared to other adsorbents, such as the adsorption performance of BF on alkali-activated diatomite [9] and the use of HCl-treated malted sorghum mash [30].

Effect of dosage on the adsorption of 150 mg·L-1 BF on TKC at 30°C.
3.2.5. Study the Effect of the Initial Concentration of BF Dye
The effect of the dye’s initial concentration was investigated in the range of 10 to 400 mg·L-1, while maintaining all other experimental conditions constant. Figure 8 shows that there is a direct proportion between the equilibrium adsorption capacity (

Effect of initial concentration on the adsorption of BF on 0.1 g of TKC at 30°C.
3.2.6. Kinetic of Adsorption
The study of adsorption kinetics is significant to explore kinetic parameters (solute uptake rate determination and governs residence time or efficiency for sorption) because they can provide valuable information on the mechanism of the adsorption process. Preliminary investigations show that the adsorption kinetics at different temperatures increase with increasing contact time (Figure 9). The kinetic studies further suggest that the adsorption equilibrium was attained within about 180 min.

Nonlinear regression plots of pseudo-first-order and pseudo-second-order kinetics for the adsorption of BF dye on TKC at different temperatures.
The two most common kinetic models, pseudo-first-order and pseudo-second-order models, were applied for adsorption kinetics.
(1) The Pseudo-First-Order Equation. Lagergren proposed this equation, which is the most common kinetics equation, and it was most significant over the initial stage of the adsorption processes [32].
The pseudo-first-order equation describes the adsorption of solid/liquid systems given as
The linearized form is
The Lagergren pseudo-first-order kinetic plots for the adsorption of BF dye on TKC were studied at different temperatures (Figure 9).
(2) The Pseudo-Second-Order. Both Ho and Mckay proposed this model depending on the hypothesis that the adsorption follows second-order chemisorption [33, 34].
The pseudo-second-order is assumed that the adsorption capacity is proportional to the number of binding sites occupied on the adsorbent. It is more likely to predict the behavior over the whole range of adsorption and agrees with the chemisorption mechanism being the rate-controlling step [35]. The linear form of the pseudo-second-order model is as follows:
The pseudo-first and second-order kinetic plots for the adsorption of BF dye on TKC were calculated at different temperatures as illustrated in Figure 9. Table 1 shows that the corresponding kinetic parameters were evaluated from nonlinear regression fittings, and the kinetic parameters (rate constants
Kinetic model parameters for the adsorption of BF on TKC.
The experimental higher value of
The study of the temperature effect on the rate at which BF is adsorbed from solution also allows for an evaluation of the activation energy (Ea) for the sorption reaction; the Ea can be calculated from the Arrhenius equation:
The

Plot of LnK2 versus
Low activation energies (<40 kJ·mol-1) indicate the physical nature of the adsorption process, while the value of
3.2.7. Adsorption Isotherms
Investigating the mechanism of the adsorption process depends on the distribution of the adsorbate between solution and adsorbent at equilibrium conditions when the dynamic balancing between the concentrations of adsorbate in bulk solution with that of the interface is established. The data obtained from the sorption equilibrium can be used to acquire the adsorption capacity and certain constants whose values express the surface properties and affinity of a sorbent.
In the present study, Langmuir and Freundlich’s isotherm parameters were used for the interpretation of the equilibrium adsorption data.
The Langmuir isotherm model assumes that monolayer adsorption of the adsorbate over specific homogenous sites on the adsorbent surface occurs due to the certain number of fixed adsorption sites with equivalent properties [36].
The Langmuir isotherm can be expressed in the following equation (Equation (7)):
The values of

The Langmuir and Freundlich isotherm models for the adsorption of BF dye on TKC at different temperatures (0.1 g TC, initial
Isotherm parameters for the adsorption of BF dye onto TKC adsorbent.
The essential feature of the Langmuir isotherm can be expressed in terms of a dimensionless factor called separation factor also called equilibrium parameter (
The Freundlich equation is an empirical equation that describes multilayer adsorption of the adsorbate on a heterogeneous adsorbent surface. Equation (9) represents the linearized Freundlich isotherm [38].
The adsorption capacity
Based on the high correlation coefficient
3.2.8. Thermodynamic Studies
The effect of temperature on the adsorption is important to estimate the thermodynamic parameters such as
The Gibbs free energy
Standard entropy change
The values of the thermodynamic parameters are presented in Table 3. The negative value of
Thermodynamic parameters for the adsorption of BF dye onto TKC.
The positive value of
4. Desorption Study
A desorption study was conducted by altering the starting solution pH to examine the ability of adsorbed BF dye to leach into the solution under various conditions. Figure 12 displays the concentrations for samples desorbed with distilled water at various medium pH levels following preadsorption of a mixture of synthetic dye effluents with a concentration of 150 mg·L-1. The results show that the desorption considerably increases at pH values below 2.5 and decreases with increasing medium pH. The reason why BF dye adsorbed on TKC is probably that BF is hydrophobic at higher pH values, as mentioned in the adsorption of dye with increasing pH of the medium, confirming the research’s results. Therefore, highly acidic media are preferred for desorption. However, the reusability of the TKC is somewhat problematic, and further research is required. More importantly, desorption experiments show that the BF dye adsorbed on the TKC adsorbent will not leach to the environment under normal conditions.

Concentrations obtained for desorbed BF dye at different initial solution pH values.
5. Applications on Real Samples
The BF-containing wastewater samples (laboratory wastewater) were taken from the Medical Laboratory Science (MLS) Department of Komar University, as a true sample for the remediation application of wastewater through the use of TKC natural clay. The real samples include detectable (BF) with a noticeable amount (160 mg·L-1) of BF depending on whether the used amount of distilled water was for washing and liberating the excess of the BF that was used in excess for coloring the bacteria species. The pH of the wastewater (real) samples was measured and was found in the range of 7.2–7.7. Adsorption tests were carried out using the TKC described in the current work. The final concentration following adsorption of BF after adsorption onto TKC was 4.76 mg·L-1. These results showed that the adsorbent was capable to eliminate BF from wastewater (real samples) at a rate of greater than 97%.
6. Conclusion
The surface of natural local clay (TKC) is a more effective adsorbent for the removal of hydrophilic organic compounds such as basic fuchsin dye from aqueous solution; this is due to the electrically charged and hydrophilic characteristics of the surface. The parameters that affected the adsorption such as pH, contact time, temperature, adsorbent dose, and initial dye concentration were determined. The influence of the initial pH of the solution on the adsorption showed a significant effect, and the efficient pH was obtained at the normal pH of the BF dye (
Footnotes
Data Availability
The authors confirm that the data supporting the findings of this study are available within the article.
Conflicts of Interest
The authors declare that they have no conflicts of interest.
Authors’ Contributions
F. Radha, D. Shwan, and S. Kaufhold were responsible for the conceptualization. D. Shwan was responsible for the methodology. D. Shwan and S. Kaufhold were responsible for the software. D. Shwan and S. Kaufhold were responsible for the validation. F. Radha and D. Shwan were responsible for the formal analysis. D. Shwan and S. Kaufhold were responsible for the investigation. F. Radha and D. Shwan were responsible for the resources. F. Radha, D. Shwan, and S. Kaufhold were responsible for the data curation. F. Radha and D. Shwan were responsible for the writing—original draft preparation. D. Shwan and S. Kaufhold were responsible for the writing—review and editing. F. Radha and D. Shwan were responsible for the visualization. D. Shwan and S. Kaufhold were responsible for the supervision. All of the authors worked on the manuscript, read the final version, and approved it.
Acknowledgments
We gratefully acknowledge the Komar University, MLS Department, for providing the real sample for the application of the present study and all who contributed to the conduction of this study especially Mr. Karokh B. Ali, Hassan H. Amin, and Dlzar D. Ghafoor.