
Abstract
Boron chloride in the chlorosilane is hard to remove and directly impacts the quality of polysilicon produced by improved Siemens method. Silicon dioxide functionalized with mannitol and citric acid successfully removed boron chloride in organic solution. The effects of immersion concentration and drying temperature were studied to attain the best adsorption performance. The sorption phenomenon was described well by pseudo-second-order kinetic model and Langmuir adsorption isotherm; particle diffusion model proved that the adsorption on the active adsorption site was the rate determining step, with the formation of boronic esters. Thermal stability and degradation kinetic of the adsorbents were investigated by thermogravimetric analysis. The characterization results of Fourier transform infrared spectroscopy, thermogravimetric analysis, X-ray energy spectrometry, and BET showed the silicon dioxide was successfully functionalized by oxygen-containing functional groups, leading to be a better and safer substitute to traditional boron-selective chelating resin.
1. Introduction
In the face of an energy crisis and environmental degradation and growing demand for low carbon emission reduction, the unlimited, nonpolluting, and extremely abundant solar power is seen as an effective decarbonization scenario [1], and the market of photovoltaic technology is rapidly evolving with a compound annual growth rate (CAGR) equal to 34% between 2010 and 2020 [2]. Silicon-based solar cells account for more than 94% of the PV market due to the low cost, high photoelectric conversion efficiency, and stability [3]. The quality of polysilicon products greatly affects the photoelectric conversion efficiency and stability.
At present, improved Siemens method [4] is the main production process of polysilicon. Trichlorosilane is prepared by hydrogenation of silicon tetrachloride, and then trichlorosilane is reduced by hydrogen and deposited on the silicon core heater to produce the polysilicon. As the typical acceptor impurity, the trace boron impurities in the raw material of trichlorosilane directly affect the quality and conduction type of polysilicon products. The tolerance limit of boron impurity in solar-grade polycrystalline silicon required by China [5] is below
Compared with other methods, the adsorption method is currently the most widely used in the industry, and the commonly used adsorption material includes activated carbon [15], ion-exchange resin [16, 17], or boron-selective chelating resin (e.g., Amberlite RA-743, Dowex BSA-1, and D564) [18, 19], which has a macroporous polystyrene backbone to which the functional group (glucosamine) is attached. Glucosamine can bond covalently to boron impurities, resulting an excellent boron removal performance. However, the chlorosilane is flammable and explosive. The large amount of flammable chelating resin will pose a huge hidden hazard in case of leakage accidents, resulting in the need for the safe and cheap boron adsorption agent.
The boron impurities like BCl3 in chlorosilane exhibit similar electron deficiency to the H3BO3 in aqueous solution, which has been well studied, and some mentioned commercial boron-selective chelating resin has been developed and widely used in seawater desalination, boron halogenation, and other fields [19]. Further researches focus on material with higher selectivity and easier separation, and Oladipo and Gazi [20, 21] developed hydroxyl-enhanced magnetic material that performed better and can be easily separated from the suspensions by an external magnet, leading to be a techno-economic substitute to the existing boron adsorbents [22]. It is concluded that most reported boron adsorbents for H3BO3 in aqueous solution have electron-rich group that plays a key role in the boron removal, leading to the electron-rich oxygen-containing inorganic adsorbent for BCl3 in this study.
As the inorganic and nonflammable material, the surface of silicon dioxide is covered with the large number of electron-rich hydroxyl groups [23], so it was applied in the removal of boron impurities [24]. Besides, it possesses the advantages of being easily modified, the stable physical and chemical properties, good mechanical strength, high specific surface area, and pore capacity [25].
The study is aimed at investigating boron chloride adsorption on silicon dioxide impregnated with different functional groups and attaining better removal performance, which was evaluated using equilibrium, kinetic, and thermodynamic studies.
2. Materials and Methods
2.1. Reagent and Instrument
All chemicals, silicon dioxide (CP, purchased from Tianjin Guangfu Technology Development Co., Ltd.), boron chloride in hexane (CP, provided by Aladding), methylamine-H, L-ascorbic acid, ammonium acetate, acetic acid, disodium EDTA dihydrate, tartaric acid, (CP, provided by Macklin), meglumine, mannitol, citric acid, salicylic acid (CP, bought from Heowns), and boron-selective chelating resin (D564) (provided by Shanghai Yuanye Bio-Technology Co., Ltd.), were directly used and without further purification.
Ultrasonic cleaner (SK7200B), Shanghai KD Ultrasonic Instrument Co., Ltd; UV-Visible spectropho-tometer (754 N), Shanghai Yidian Analytical Instrument Co., Ltd.
Fourier transform infrared (FT-IR) spectrum was collected on a Thermo Fisher Nicolet iZ10 using KBr as standard reference in the range of 400–4000 cm-1. The thermogravimetric analyses (TGA) were performed on a NETZSCH 209F3 derivatograph. The data recording occurred in 250 ml∙min-1 outflow air, within the 30–950°C temperature range and at the 20 K∙min-1 rates of heating. The specific surface area was tested and calculated by Micromeritics.
2.2. Silicon Dioxide Impregnation
The process of impregnation was described in Figure 1, and about 5 g of silicon dioxide was impregnated in the 100 cm3 impregnating solution (weight concentration range of 0.2–3%) for 12 h at 90°C. The impregnated silicon dioxide was collected by filtration, washed by hexane, and vacuum dried at 70, 90, 110, 130, 150, and 170°C to constant weight. The impregnating substance used was meglumine (ME), mannitol (MA), citric acid (CA), tartaric acid (TA), and salicylic acid (SA).

Schematic illustration of the process of silicon dioxide impregnation.
2.3. Static Adsorption
Due to the flammable and explosive property of chlorosilane, the boron chloride in chlorosilane was replaced by the boron chloride in hexane in the study. The tests were carried in the screw capped bottles with polyethylene gaskets filled with N2, which prevents the boron chloride from water steam.
During static experiments, adsorbent (0.1, 0.2, or 0.5 g) was put into the 15 or 30 ml hexane solution of boron chloride at the concentration of 585 ppm at room temperature for 2 h.
In kinetic experiments, the boron concentration was measured by sampling at regular intervals until the concentration remained constant, which means the adsorption equilibrium reached.
In order to investigate the dependence on the initial boron concentration, the concentration of the solution varied between 234 ppm and 23400 ppm, while the 0.1 g of adsorbents was weighted into the 15 ml of the hexane solution of boron chloride.
The adsorption capacity (
Boron chloride in hexane was hydrolysed to form boric acid solution [26], then it was measured spectrophotometrically using azomethine-H, which will form yellow complex with boric acid after 6 h of waiting time, and then the absorbance value was tested at 415 nm, with a 1 cm cuvette against the blank test [27].
3. Results and Discussion
3.1. Static Adsorption Experiments of Adsorbent
As polyols and organic acids have typical oxygen–containing functional groups that definitely enhance the boron adsorption as reported [28, 29], the adsorption ability of boron chloride on impregnated silicon dioxide showed different increase with different impregnating agent in Figure 2. The result points to silicon dioxide impregnated with mannitol (SD + MA) and citric acid (SD + CA) as the best adsorbents of boron chloride in this study, which can be attributed to the structure and number of oxygen-containing functional groups. The structure of impregnating agent is shown in Figure 3, MA and ME are both polyols, and MA has more hydroxy than ME, resulting little better performance than ME. Compared with CA and TA, SA has less hydroxy and carboxy, leading to a lower adsorption capacity.

Comparison of boron adsorption capacity on SD, SD + ME, SD + MA, SD + CA, SD + TA, SD + SA, and D564.
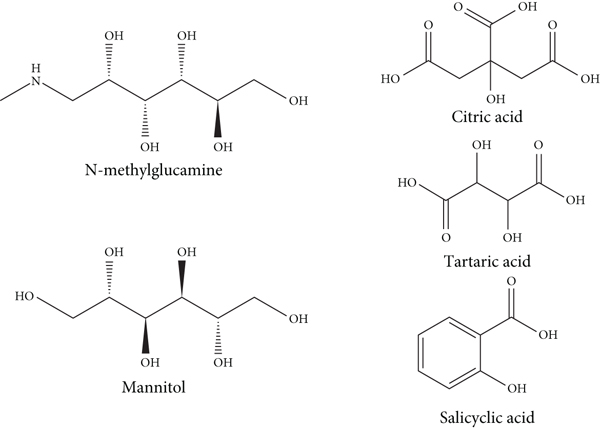
Structure of impregnating agent (ME, MA, CA, TA, and SA).
3.2. The Effect of Impregnating Concentration
Figure 4 presents the adsorption capacity of boron chloride on impregnated silicon dioxide prepared with different impregnating solution concentration, and the adsorption capacity of boron chloride on impregnated silicon dioxide increased at early stage and then decreased with increasing impregnating solution concentration. The maximum adsorption capacity of SD + CA is 44.37 mg∙g-1at 1.2% of impregnating solution, and the maximum adsorption capacity of SD + MA is 40.49 mg∙g-1 at 1% of impregnating solution, which is attributed to the increasing loading of the oxygen-containing active sites on the surface of silicon dioxide with the increasing concentration of impregnating solution. However, with further increase in concentration, as shown in Table 1, some functional groups may agglomerate and block the limited loading sites of silicon dioxide, resulting in the decrease in the pore size, pore volume, and decrease in adsorption capacity of impregnated silicon dioxide. When the concentration of mannitol impregnation solution reached 3%, the pore channels may be blocked or even disappeared, the internal diffusion of boron chloride mainly control the adsorption, and boron chloride cannot enter the pore channels of impregnated silicon dioxide, which caused the adsorption capacity of SD + MA to drop sharply, even lower than that of blank silicon dioxide.
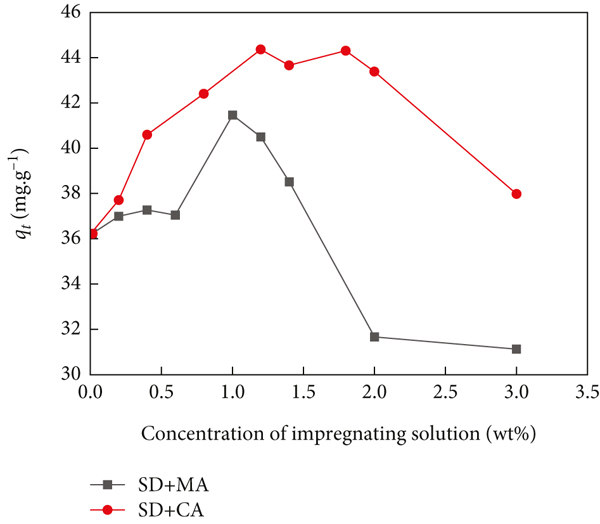
The effect of concentration of impregnating solution on boron adsorption capacity on SD + MA and SD + CA.
The pore size of different adsorbents impregnated by solution of different concentration.
3.3. The Effect of Drying Temperature
As can be shown in Figure 5, with the increase of the drying temperature, little change in adsorption capacity indicates that the drying temperature had little effect on the increase of active oxygen-containing group sites. But the increasing temperature may promote the bonding of mannitol to the hydroxyl groups on the surface of silicon dioxide.

The effect of drying temperature on boron adsorption capacity on SD + MA and SD + CA.
3.4. Characterization
Functional groups identified by FT-IR spectra in Figure 6 confirm the successful functionalization of mannitol and citric acid on the surface of silicon dioxide, and the FT-IR spectra of impregnated adsorbents show the increase in the band at 3400 cm-1 (ν-OH) [30] and the appearance of new peak at 2904 cm-1 and 2844 cm-1 (ν-CH) [31], suggesting the successful grafting of polyol groups on the silicon dioxide supports. The appearance of a new peak at 1760 cm-1 (ν-C=O) and 1410 cm-1 (δ-C-OH) [30] and the wide and scattered peak at the range of 3200 cm-1–2500 cm-1 [30] suggest the loading of carboxylic acid on the silicon dioxide.
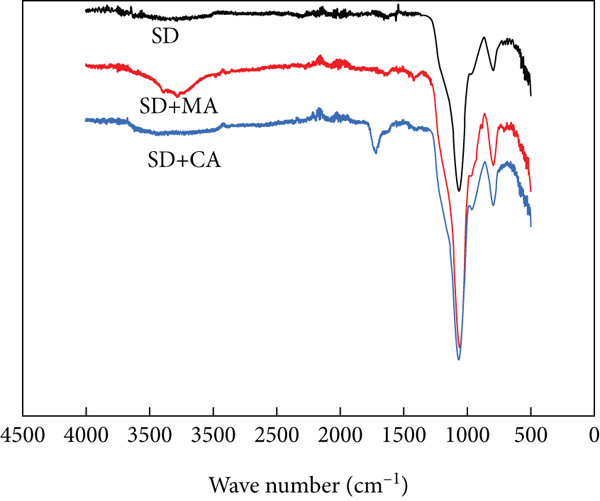
FT-IR spectra of SD, SD + MA, and SD + CA.
Active silicon dioxide and impregnated silicon dioxide were analyzed by X-ray energy spectrometry (EDS). It was found in Table 2 that the proportion of elemental Si on the surface of the impregnated silicon dioxide decreased, and the content of elemental C increased significantly compared to the activated silicon dioxide, which was attributed to the loading of polyhydroxy organic compounds on the surface of silicon dioxide.
The relative percentage of C, O, and Si in adsorbents determined by EDS.
Figure 7 shows the TGA curves of the studied adsorbents from ambient temperature to 950°C at heating rates of 20°C∙min-1. In these curves, the mass loss of all adsorbents started at about 95°C and ended around 500°C. The mass residue was mainly SiO2, the product of inorganic silicon combustion, and the thermal decomposition of analyzed polymers occurred in two or three well-defined stages.
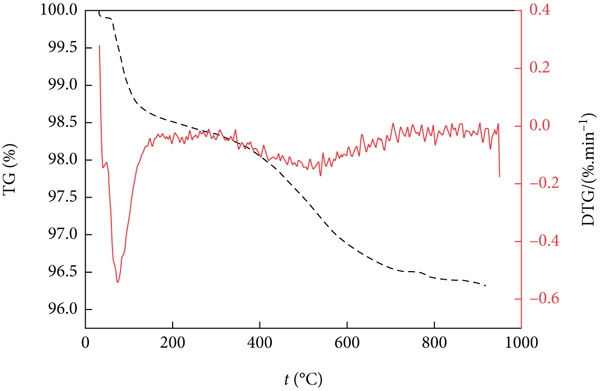
TGA and DTG curves for (a) SD, (b) SD + MA, and (c) SD + CA.


Thus, in the case of silicon dioxide, the first stage began at about 40°C and ended at about 97.5°C, characterized by weak DTG peak at 74.8°C, which can be mainly attributed to the adsorbed water. This stage involved maximum 0.98% weight loss and can be considered nondegradable. The second stage, which began at around 360°C and ended at about 630°C, can be attributed to the decomposition of hydroxyl groups on the surface of silicon dioxide.
The SD + MA exhibits two distinct stages of decomposition. Thus, the first stage began at 69.6°C and ended at about 122°C, with DTG peak at about 103.1°C, which can be mainly attributed to the residual solvent, and this step involved 4.23% mass loss. The second stage started at around 311.7°C and ended at around 494.5°C with DTG peaking at 397.4°C, mainly due to the thermal decomposition of mannitol, which involved 11.25% mass loss.
The steady mass loss in SD + CA started at about 92.8°C, ended at 950°C, and was characterized by a DTG peak of 249.6°C, which was due to the mass loss of the citric acid on the silicon dioxide, and the weight loss rate was 15.17%. The difference between silicon dioxide and impregnated adsorbents shows that mannitol and citric acid are indeed loaded onto the surface of the silicon dioxide.
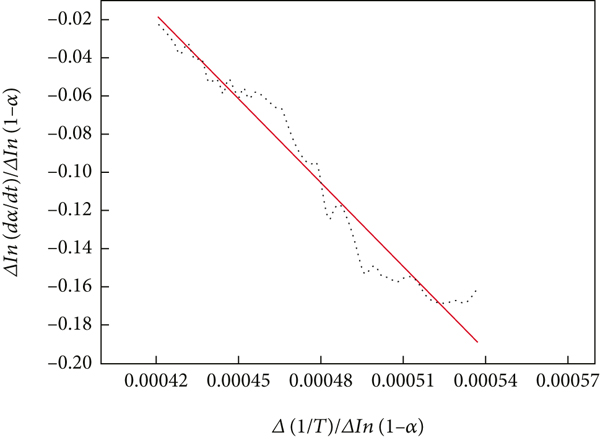
3.5. Thermal Degradation Kinetic of Adsorbents
In order to explain the thermal degradation of synthesized adsorbents, it is necessary to know the whole kinetic triplet [32, 33]. At each stage of the beginning and end of decomposition, kinetic analysis was performed using Freeman-Carroll method [34] to calculate the activating energy, pre-exponential factor, and reaction order from a single TGA curve based on the following equations:
The results of the thermal degradation kinetic were shown in Figures 8 and 9.

Thermal degradation kinetic curves of (a) SD + MA in 69.6–103.1°C and (b) SD + MA in 311.7–397.4°C.

Thermal degradation kinetic curves of SD + CA in 92.8–249.6°C.
The kinetic parameters corresponding to the degradation of impregnated adsorbents are presented in Table 3.
Kinetic properties for adsorbents using Freeman-Carroll method.
As can be seen from the data in Table 3 that the activation energy and the order of reaction are not always a constant value, proving that the thermal degradation of mannitol-modified silica is a complex reaction.
3.6. Adsorption Kinetics Experiments of Adsorbents
Adsorption equilibrium curves described in Figure 10 show that the adsorption rate of boron chloride in solution is fast. The adsorption capacity increased rapidly with the increase of adsorption time in the first 10 minutes, after which, it slowed down as the adsorption equilibrium was reached. This is a typical development rule in adsorption process. As the adsorption progresses, the diffusion rate of solute to adsorbent slows due to the decrease of adsorption concentration [35]. The experimental results obtained were used to study the rate-limiting step.

Effect of reaction time on removal of boron chloride on SD, SD + MA, and SD + CA.
The adsorption kinetics curves were analyzed using the pseudo-first-order kinetic equation as follows [30]:
The pseudo-second-order adsorption kinetic equation can be expressed as follows [36]:
The correlation coefficients and the rate constants for the pseudo-first-order kinetic model and pseudo-second-order kinetic model are shown in Figure 11, Figure 12, and Table 4, respectively.

The pseudo-first-order kinetic model fitting of adsorption kinetics curves of SD, SD + MA, and SD + CA.

The pseudo-second-order kinetic model fitting of adsorption kinetics curves of SD, SD + MA, and SD + CA.
Kinetic parameters of adsorption of boron chloride on SD, SD + MA, and SD + CA.
Note:
The control steps of the speed of adsorption process are usually investigated using the diffusion model in the particle [37], and the formula is as follows:
Typically, the particle diffusion model is three-stage linear, including boundary layer diffusion, internal diffusion, and adsorption site adsorption. Because the first stage reaction speed is very fast, it will not be the control step of adsorption reaction, so the adsorption data were fitted in two stages and shown in Figure 13.

Multisegment fitting curve of the intraparticle diffusion model of adsorption of boron chloride on SD, SD + MA, and SD + CA.
As can be seen from the Table 5, the
Diffusion parameters in particles of adsorption of boron chloride on SD, SD + MA, and SD + CA.
3.7. Determination of Adsorption Isotherm
The distribution of boron between the liquid phase and the solid phase is an index of equilibrium position during the adsorption.
Adsorption isotherm was shown in Figure 14, silicon oxide adsorption of boron chloride can be roughly divided into several stages at concentrations of boron chloride ranging from 234 ppm to 2340 ppm, the adsorption capacity increased with the increase of the concentration of boron chloride solution, the increasing trend slowed down within 2340 ppm to 9360 ppm, and the adsorption capacity basically remained unchanged within 9360 ppm to 23400 ppm.

Adsorption isotherms of removal of boron chloride on SD, SD + MA, and SD + CA.
The adsorption isotherms were analyzed by two-parameter models: Langmuir, Freundlich, Temkin, and Dubinin-Radushkevich and three-parameter models: Redlich-Peterson, Sips, Toth, etc. [38].
Langmuir equation assumes that the maximum adsorption occurs when the surface is covered by a monolayer of adsorbate, which is effective for monolayer sorption onto a surface with a finite number of identical sites [36], as shown below:
Freundlich equation is a purely empirical model, which is indicative of the surface heterogeneity of the sorbent, and is given by the following equation:
Temkin equation:
Dubinin-Radushkevich isotherm model is used to describe sorption on both homogeneous and heterogeneous surfaces [39]. It can be expressed as follows:
The linear correlation coefficient shown in Table 6 indicates that the adsorption process is most consistent with the Langmuir equation, indicating that monolayer adsorption occurs on the surface of adsorbents. The
Two parameters adsorption isotherm parameters of boron chloride on SD, SD + MA, and SD + CA.
The adsorption isotherms were analyzed by three-parameter models as follows:
Redlich-Peterson equation:
Sips model:
Toth equation:
The
Three parameters adsorption isotherm parameters of boron chloride on SD, SD + MA, and SD + CA.
3.8. Chemisorption Mechanism
After completing adsorption, FT-IR spectra of adsorbents in Figure 15 show the appearance of new peak at 1400 cm-1 (as-B-O) [41], suggesting the chemisorption of boron chloride on the adsorbents.

FT-IR spectra of SD, SD + MA after adsorption, and SD + CA after adsorption.
Due to the significant electron deficiency of the boron, it can form typical covalent coordination bonds with electron donor, and the following mechanism of nucleophilic addition reactions is proposed in Figure 16 for the chemisorption of boron chloride on modified adsorbents.
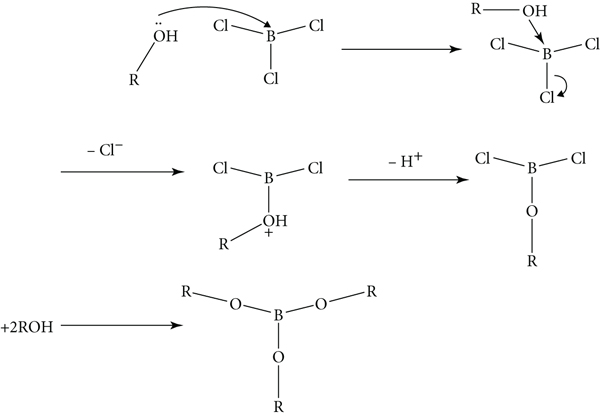
The mechanism of chemisorption of boron chloride on adsorbents.
The lone pair of electrons of polyhydric alcohols was coordinated to the electron deficient boron, and after accepting electrons, the Cl- left with a pair of electrons, due to the strong polarity of the B-Cl bond, followed by the leaving of proton on the methanol. The total reaction is
4. Conclusions
In this study, the silicon dioxide modified by oxygen–containing functional groups (–OH and –COO–) shows a better performance of the boron chloride removal in polysilicon production than that of chelating resign under the test conditions. The adsorption performance and adsorption mechanism of boron chloride are firstly discussed and described in detail, which are the relative lack in the previous industrial methods.
This study has given encouraging results, and organic-inorganic hybrid materials could be applied to reduce boron chloride. We wish to carry out the adsorption tests in the condition of flammable and explosive chlorosilane, which is closer to the industrial production, and this part has been left for future research.
Footnotes
Data Availability
The data used to support the findings of this study are available from the corresponding author upon request.
Conflicts of Interest
The authors declared no potential conflicts of interest with respect to the research, authorship, and/or publication of this article.
Acknowledgments
Our research was supported by Tianjin University and Zhejiang Shaoxing Institute of Tianjin University.