
Abstract
In this work, biochar produced from breadfruit leaves was utilized to remove the toxic Congo red dye. XRD, FTIR, and FESEM-EDX were implemented to characterize the biochar. Response surface methodology (RSM) and the Box-Behnken design (BBD) techniques were used to evaluate Congo red’s optimum adsorption efficiency. The adsorption of Congo red was studied by varying dye concentrations (5–50 mg/L), times (30–240 min), pH (6–9), and dosages (0.5–2 g/100 mL). X-ray diffractometer results show that the structure of biochar is amorphous. The biochar exhibited unbounded OH, aliphatic CH group, and C=O stretch, as shown by the band peaks at 3340 cm−1, 2924 cm−1, and 1625 cm−1 intensities. RSM-BBD design results showed maximum removal efficiency of 99.96% for Congo red at pH 6.37, dye concentration 45 mg/L, time 105 min, and dosage 1.92 g, respectively. The adsorption of Congo red by biochar was successfully modeled using the Langmuir model and pseudo-second-order model. The biochar produced from breadfruit leaves exhibited a high adsorption capacity of 17.81 mg/g for Congo red adsorption. It suggests that the adsorption is both homogenous monolayer and physicochemical.
1. Introduction
The usage of dyes by several sectors harms the environment since these substances are extremely hazardous and nonbiodegradable [1]. In the dyeing industry worldwide, 30–60 liters of water are used for every kilogram of fabric colored, and enormous volumes of wastewater are discharged during the process [2]. Many pollutants and toxins from industrial wastewater contribute to global warming. Additionally, because the industrial sector requires vast amounts of water, it produces wastewater that contains both mineral and organic toxins. It is now one of the most polluting industries, even though there have been a lot of efforts to clean up the processes over the last 30 years [3, 4]. Water scarcity, rising effluent disposal expenses, and tighter discharge laws have made wastewater treatment necessary. The wide range of contaminants in water needs a variety of treatment procedures to remove them from the water that is both successful and technologically and economically viable [5].
At present, the main methods utilized for the treatment of wastewater containing dyes are carried out by chemical (chemical oxidation, coagulation, photolysis, zero-valent metal reduction, and so on), physical (membrane filtration, sedimentation, flocculation, adsorption, filtration, ion exchange, and so on), or biological approaches [6, 7]. On the other hand, the chemical approach may degrade colors into tiny compounds with increased carcinogenic or poisonous properties by dissolving the bivalent bond of dye chromophores. While bacteria degrade biodegradable substances in biological techniques, residues of microorganisms in nonbiodegradable waste sludge are discharged into the environment and cause additional difficulties. Physical adsorption is the most effective method for removing dyes from wastewater since it produces few harmful by-products and has a wide range of material sources, while also having cheap cost, quick kinetics, and easy operation and being recyclable [8, 9]. Adsorption is the process of eliminating and recovering hazardous substances from liquids or gases by adsorbing them onto a solid surface [10–12]. Because of their great effectiveness and versatility in separating a broad variety of chemical components, adsorption methods offer the potential to remove organics from water [13]. Many studies have shown the usage of materials like walnut husk [14], composites [15], biochars from crop residues [16], natural clinoptilolite [17], sesame hull [18], the biomass of penicillium YWO1 [19], natural zeolite [20], cross-linked succinyl chitosan [21], modified bentonite [22], eucalyptus barks [23], modified attapulgite [24], clay material [25, 26], activated carbon [27], dehydrated beet pulp carbon [28], and polyurethane foam [29] as adsorbent for removal of dyes from the effluent. In addition to the above, there are a variety of man-made and naturally occurring materials that can be used in the development of sorbents, including polymeric resins, zeolites, agricultural solid waste such as date pits and fly ash, and biodegradable materials like chitosan and fungi or bacterial biomass.
Particularly, biomass-activated carbon is advised as a powerful and affordable adsorbent. This is because of its ease of use, efficacy, and capacity to remove any type of color from wastewater [30, 31]. Some of the qualities that have biomass-activated carbon an ideal adsorbent for the treatment of dye-contaminated wastewater are good size distribution, abundant functional groups, and wide internal and exterior surface areas [32].
In the present study, leaf powder of breadfruit (Artocarpus altilis) leaf biochar was employed as an adsorbent to successfully remove the anionic dye Congo red (CR) dye from an aq. solution. The breadfruit biochar is being prepared at a low temperature in the air atmosphere avoiding conventional methods of biochar preparation such as high-temperature pyrolysis which takes place between 300°C and 700°C and hydrothermal carbonization between the temperatures 200°C and 350°C. The main disadvantages of the conventional method are the high-temperature burden on the environment and electricity consumption. Very few pieces of literature have reported on the preparation of biochar less than 200°C. Breadfruit is one of the rare fruits in India and is found in the Konkan range and coastal plains of Kerala. The impact of several factors such as time, dye concentration, pH, and adsorbent dose on dye removal from an aqueous solution was also examined. The response surface methodology (RSM) approach was employed to optimize the sorption process variables. Using equilibrium and kinetics, adsorption capacity and rate equation were investigated.
2. Materials and Methods
2.1. Materials
Breadfruit leaves were collected from Sulthan Bathery, India, in January and February 2022. HCl and NaOH pellets are purchased from Isochem Laboratories Angamaly, Kochi, India. Nice Chemicals (P) Ltd., Kochi, India, sold the Congo red dye that was acquired.
2.2. Preparation of Breadfruit Biochar
The leaves of breadfruit were washed and rinsed with deionized water to remove dust and soluble toxins. The leaves were kept in an oven for drying at 50°C for 24 h until their color turned yellow. Then, the leaves were crushed in a pestle and mortar and sieved with 45-mesh screens. Subsequently, 5 g of dry breadfruit leaves was added to 50 mL of 42% HCl and then stirred in the beaker. The mixture was carbonized in the hot air oven for one hour at 150°C. Then, it was filtered, dried at 90°C for 4 h, and then ground into a powder [33].
2.3. Adsorption Experiments
The parameters, initial Congo red concentration, breadfruit leaf biochar dose, pH, and time, were optimized through response surface methodology. An experimental model of the process variables was done using the Box-Behnken design (BBD). The adsorption equilibrium studies were carried out with pH 6.37, time 105 min, dye concentration of 45 mg/L, and biochar dosage in the range from 0.3 to 2 g/100 mL. The batch kinetic studies were performed in a three-neck flask and Teflon stirrer of 500 mL capacity. Different dosage amounts of 2 g and 4 g biochar were added to 450 mL of 45 mg/L of dye concentration pH 6.37. The rate of dye adsorption on biochar was evaluated by monitoring concentration over time.
Using Equations (1) and (2), we computed the dye removal and adsorption capacities [34]
2.4. Optimization of Process Parameters
To find the optimal values for the starting dye concentration, adsorbent dose, solution pH, and temperature, this work employs a four-level Box-Behnken design (BBD) within the RSM framework. Statistical analysis software (Design-Expert software version 6.0 Stat-Ease) was used to calculate the significance of each factor, interaction, and quadratic term in the optimization process. Each variable had three distinct levels: −1, 0, and +1, representing low, medium, and high values, respectively. Table 1 depicts the arrangement of the factorial design.
Levels of the four variables of adsorption process.
The BBD method with four factors needs 29 runs, and there should be five replicates of the center points. It is possible to increase the precision of estimates of effects through the use of replication, as well as to obtain additional information on the background process variation. By including center points in the analysis, it is possible to verify whether or not the predicted equations are accurate [35]. The BBD approach is used to establish quadratic regression equations (3) in terms of both the experimental data and the statistical parameters.
2.5. Characterization
The crystallographic structure of biochar can be determined using X-ray diffraction analysis (XRD), which can be conducted on a Rigaku Ultima X-ray diffractometer. FTIR identifies functional groups in biochar adsorbent and is performed in PerkinElmer (Spectrum Version 10.4.00). The surface structure and content of the biochar adsorbent were examined using Gemini 300 SEM.
3. Results and Discussion
3.1. Biochar Characterization
XRD is a method that entails irradiating a material with inbound X-rays and then measuring both their intensity and scattering angles as they depart the material. Materials are identified through XRD analysis based on their diffraction pattern. X-ray diffractometer results show that the structure of biochar is amorphous. Figure 1(a) illustrates the XRD spectrum before and after adsorption. Before adsorption shows relatively high 2-theta diffraction peaks at 22°, 26°, and 38°. After Congo red adsorption on biochar adsorbent, there was the appearance of more peaks compared to fresh biochar absorbent. Congo red adsorbed on biochar produced a new peak at 23°, 27°, and 33°.

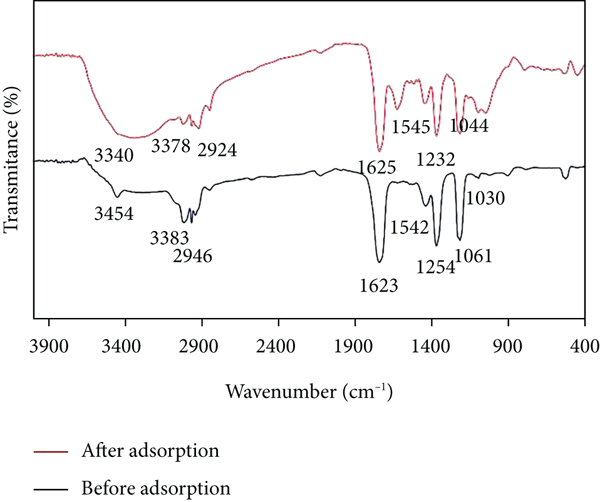
Breadfruit leaf biochar characterization: (a) XRD analysis, (b) FTIR analysis, (c, d) SEM images, and (e, f) EDX spectra of before and after adsorption of Congo red dye, respectively.


Scherer’s equation [34] was utilized to determine the differential in average size between the biochar adsorbent before and after adsorption. The average size of the biochar was determined, and it is 190.47 nm. After adsorption, the average size of the biochar increased significantly. After Congo red adsorption, the average size was 460 nm.
FTIR was used to identify and characterize unknown components, locate additives, and detect decomposition and oxidation in biochar. Before and after adsorption, band intensity and vibration shifted as a result of the change in FTIR. The presence of carbonyl (–C=O), hydroxyl alcoholic (–OH), and amino (–NH2) functional groups on the biochar surfaces during the adsorption process, as well as the possibility of associations with the (–SO3H) functional groups of Congo red dye molecules during the sorption process, can be seen in adsorbent spectral differences before and after adsorption [35, 36]. Table 2 gives the FTIR band adsorption frequencies before and after adsorption. The biochar reported in the intensities of the peak at 3340 cm−1, 2924 cm−1, and 1625 cm−1 reveals unbound −OH, aliphatic C−H group, and C=O group as reported similar by acid-modified pine cone powder [37].
FTIR band absorption frequencies of breadfruit leaf biochar adsorbent before and after adsorption of Congo red dye.
The region under 1000 cm−1 implies the complex interacting vibration and represents no functional group (fingerprint region) [38]. Peaks at 1625 cm−1 and 1545 cm−1 are characteristic of red azo dyes [39]. The band at 3454 cm−1 represents hydroxyl (–O–H) stretching vibration of lignin, cellulose, and hemicelluloses [40], and the short band around 2946 cm−1 is associated with (–C–H) stretching [41, 42], and the bands at 1623 cm−1 and 1542 cm−1 reflect stretching vibrations of –C=O of esters and acids [43] and aliphatic (–C–O) stretching [44, 45], respectively. The FTIR analysis of breadfruit leaf biochar adsorbent before and after adsorption of Congo red dye is shown in Figure 1(b).
FESEM–EDX (field emission scanning electron microscopy with energy-dispersive X-ray spectroscopy) is a strong device for evaluating objects’ morphology and elemental composition [46]. An SEM image (Figures 1(c) and 1(d)) clearly shows the lumpy and porous surface morphology. The average size of the breadfruit biochar was determined and was 145 nm. The dye molecules filled the pores of the biochar after being adsorbent to Congo red, demonstrating the adhesion on the surface of the adsorbent. The existence of a large volume of pores suggests that the biochar has a significant availability of dye for adsorption and trapping. High temperatures cause the breakdown of lignocellulosic material, followed by the evaporation of volatile substances, resulting in a significant pore structure forming on the surface of the adsorbents, resulting in samples with well-developed pores. These pores allowed a reasonable surface area for Congo red dye to be trapped and absorbed into the biochar [47]. Sarkar et al. [48] reported similar SEM analysis results in preparing adsorbent from rice husk ash. From Figures 1(e) and 1(f), EDX spectra, the carbon content of the biochar was found to have risen when the adsorbent was activated [49, 50].
3.2. Optimization of Sorption Variable RSM-BBD
The modeling was carried out by adjusting the first- or second-order polynomial equation to the experimental results of the response. Analysis of variance (ANOVA) was performed to confirm the adequacy of the predicted model by assessing the lack of fit, regression coefficient (
The effect of operational parameters such as concentration, dosage pH, and time on the adsorption capacity of biochar for the removal of Congo red was investigated using the Box-Behnken design (BBD). The Box-Behnken design (BBD) was used to optimize the parameters and suggest viable models with fewer experimental runs, hence reducing both the labor and operational costs. Equation (4) is the empirical model describing the relationship between adsorption efficiency and independent variables.
where
Table 3 shows the observed and predicted Congo red dye removal efficiency, whereas the analysis of variance (ANOVA) for Congo red dye sorption is given in Table 4.
Box-Behnken design (BBD) for adsorption of Congo red dye on breadfruit leaf biochar adsorbent.
Response surface quadratic model for adsorption of Congo red dye on breadfruit leaf biochar adsorbent: ANOVA results.
Quadratic model for adsorption of Congo red dye on breadfruit leaf biochar adsorbent: standard fit statistics.
Table 6 summarizes and shows the findings of the lack-of-fit (LOF) tests. LOF is a diagnostic method for model suitability that analyzes the pure error, which relied on duplicate measurements, to the LOF, which is based on model performance and is used to determine if a model is adequate [52, 53]. When the
Quadratic model for adsorption of Congo red dye on breadfruit leaf biochar adsorbent: lack-of-fit statistics.
The “lack-of-fit
Figure 2(a) shows the predicted vs. actual Congo red removal efficiency graph. The values for both cases are clustered around a straight line, as shown by the graph (Figure 2(a)), which also shows that the actual values and the predicted values are very close to one another and that the experimental responses and the statistically predicted responses are unambiguously correlated [34, 56, 57].

(a) Predicted vs. actual plots; (b) Box-Cox plots; (c) perturbation plot for adsorption of Congo red dye on breadfruit leaf biochar adsorbent.


If the data are not normally distributed, the typical Box-Cox plot (Figure 2(b)) is employed to verify their normal distribution and calculate the power transformation amount needed to be integrated into the response data [34]. The Box-Cox plot in Figure 2(b) for the Congo red removal reported that the best
3.3. Influence of Parameters on Sorption
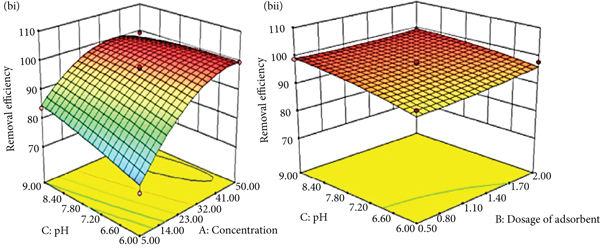
The impact of each of the factors on the dye sorption process is depicted using a three-dimensional (3D) plot. The curvatures of the plots show the interaction between the factors [59]. The 3D plots were drawn between the amount of biochar dose and initial concentration of the dye, pH, and time to analyze their interaction. The created model’s 3D response surface curves shown in Figure 3 depict the mutual interactions of the chosen adsorption process parameters.
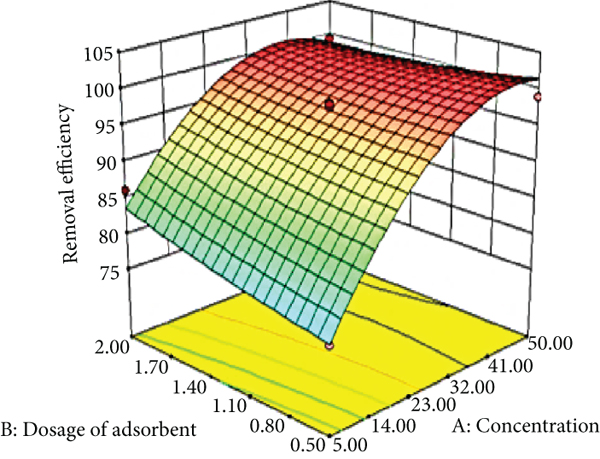
3D surface plots comparing the percentage of Congo red removed with breadfruit leaf biochar vs. (a) concentration and dosage of biochar, (b, i) concentration and pH, (b, ii) pH and dosage of biochar, (c, i) time and concentration, (c, ii) time and dosage of biochar, and (c, iii) time and pH.

3.3.1. Influence of Dosage of Adsorbent
We examined the influences of breadfruit leaf biochar dosage on Congo red dye removal from 0.5 to 2 g/100 mL Congo red solution. From Figures 3(a), 3(b, ii), and 3(c, ii), when the amount of biochar that is being utilized for the removal of Congo red is increased, the adsorption also rises [58]. More than 99% of Congo red adsorption took place during the 105 min and reached equilibrium. The optimum dosage given by the model is 1.92 g/100 mL, and equilibrium had been reached at this point. This stage also reflects each adsorbent’s maximal adsorption capacity under specific operating conditions [59]. More adsorption sites are available due to the increased surface area of biochar pores and the higher dose of biochar, which increases adsorption.
3.3.2. Influence of pH
The color of the Congo red solution shifts from red to dark blue when the pH value of the solution drops. The degree and kind of ionic character of the Congo red molecules depend on the pH of the medium [34], as can be seen by the color fluctuations with pH. At pH values in the range from 6 to 9, the effect of the dye solution and initial pH on the sorption capacity of breadfruit biochar at Congo red equilibrium was investigated. Figure 3(b) (i and ii) shows the efficiency of biochar for the removal of dyes along with the initial pH of the solution. The maximum removal efficiency (99.96%) for Congo red was observed at pH 6.37. Likewise, Congo red sorption on Macauba cake and Macauba cake thermally treated was good at pH 6.5 than at pH 10 [60]. Dye adsorption increases when the pH is between 6 and 7 and then decreases as the pH increases. Furthermore, as the initial concentration was increased, the adsorption yields gradually increased. The maximum sorption efficiency was 99.96% at a low initial dye concentration (27.5 mg/L) and a pH of 6.37. The experiment showed that the percentage of adsorption falls as the pH of the dye solution raises. The sorption of an anionic dye reduces when pH rises, and this phenomenon is linked to both the negative charge on the surface of the biochar and the presence of excess OH ions in the solution, which compete for sorption sites [61]. The pHzpc value for breadfruit biochar was found to be 6.8 (Figure 4) which is more than the pH at which the removal efficiency is maximum. When
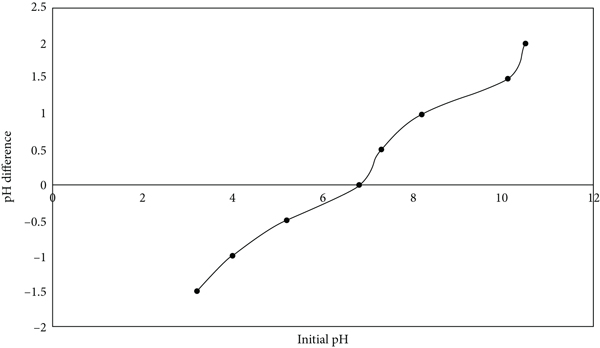
The graph determining pHzpc of breadfruit leaf biochar adsorbent.
3.3.3. Influence of Initial Congo Red Concentration
To investigate the influence that dye concentration has on Congo red dye removal, the initial concentrations of the dye solution were varied throughout a wide range, from 5 to 50 mg/L. Figure 3(a) illustrates the influence of biochar and Congo red concentration on Congo red removal from biochar. At higher concentrations of dye solution, the adsorption was unaffected. Because many dye molecules occupy the adsorbent surface [33], the equilibrium (
3.3.4. Influence of Time
The role of time in dye adsorption was examined by doing trials from 30 min to 240 min. The removal rate increased with the initial Congo red concentration; the removal rate (percent) increased as the reaction time increased. Figure 3(c) (i and ii) shows the combined effect of the biochar and the concentration of Congo red on removal at varying time intervals (30–240 min). The findings revealed that the adsorption of dye started rising with an increase in time and effectiveness up to 105 min and that, after 105 min, no significant adsorption was observed, and removal efficiency decreased. Large biochar surface area increased the initial adsorption rate. Because there were a significant number of easily accessible active places on the biochar surface, the process started quite quickly. However, as time went on, the active sites were occupied by Congo red molecules, which slowed down the process until it finally reached a saturated state [15, 63].
3.4. Model Confirmation and Validation
An optimization technique called RSM-BBD was used with four variable interactions carried out under various factors to optimize all the responses and runs. The initial dye concentration (5–50 mg/L), biochar dose (0.5–2 g), pH (6–9), and time (30–240 min) were all chosen to maximize dye removal efficiency. Under optimal conditions, with an initial Congo red concentration of 45 mg/L, an amount of biochar of 1.98 g/100 mL, a pH of 6.37, and a contact time of 105 min, the dye removal efficiency was 99.96%.
3.5. Equilibrium Studies on Breadfruit Biochar
Adsorption characteristics and equilibrium parameters give the nature of the biochar-Congo red interaction. The equilibrium data are correlated using Freundlich, Langmuir, and Dubinin–Radushkevich isotherms [64] in this work. These models were utilized to analyze experimental sorption equilibrium parameters to learn more about the surface characteristics of the biochar and its affinity for the Congo red dye.
Langmuir isotherm model
Freundlich isotherm
To identify between physical and chemical adsorption, the Dubinin–Radushkevich (DR) isotherm is used. It is represented by [64]
The parameters of the equilibrium model that were computed are shown in Table 6 and represented in Figure 5. From Table 7, it was observed that the equilibrium data follows the Langmuir isotherm because the

Equilibrium model plots of biochar-Congo red dye adsorption system: (a) Langmuir plot; (b) Freundlich plot; (c) Dubinin–Radushkevich plot.


Calculated various equilibrium model parameters for adsorption of Congo red dye on breadfruit leaf biochar adsorbent.
Comparison of adsorption capacity of breadfruit leaf biochar with other biochar adsorbents for Congo red dye adsorption.
3.6. Kinetics of Breadfruit Biochar
Different samples of the biochar–Congo red solution were taken at varying time intervals, and the concentration of the solution was evaluated to study the adsorption kinetics. To figure out how Congo dye adsorbs on biochar, three kinetic models were used: pseudo-first-order [76, 77], pseudo-second-order [77, 78], and Elovich kinetic model [79], and the intraparticle diffusion kinetic equation [80].
The pseudo-first-order (PFO) model is given in equation nonlinear (10) and linear (11) forms:
The pseudo-second-order (PSO) model is given in equation nonlinear (12) and linear (13) forms:
The Elovich kinetic model is given in
The intraparticle diffusion model (IPD) is given in
The nonlinear forms of the PFO and PSO kinetic models for the adsorption of Congo red ions on breadfruit leaf char husk are presented in Figure 6 by plotting

Nonlinear plots of PFO and PSO kinetic models for the adsorption of Congo red dye on breadfruit leaf biochar.
Kinetic model parameters for the adsorption of Congo red dye on breadfruit leaves biochar.

Linear plots of kinetic models for the adsorption of Congo red dye on breadfruit leaf biochar: (a) pseudo-first-order (PFO), (b) pseudo-second-order (PSO), (c) Elovich model, and (d) intraparticle diffusion.
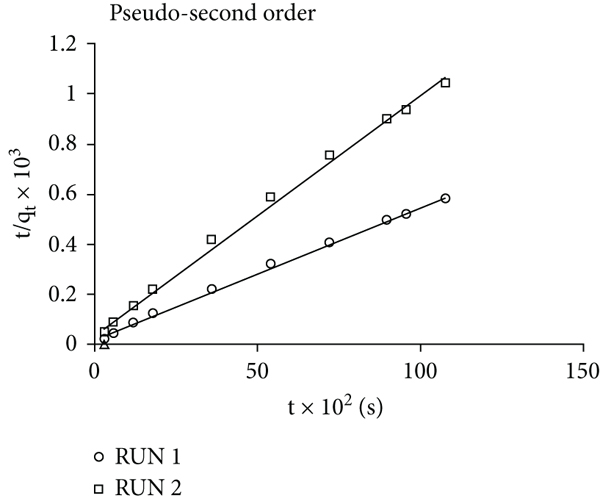


The computed rate constant values for linear and nonlinear variants of PSO (Table 9) were quite similar. The difference in the values generated by different linearized models utilizing the same experimental data might be attributed to the degree of difficulties and challenges involved with the linearization of a nonlinear form [81, 82]. Given these characteristics, it is preferable to use a nonlinear formula to calculate the kinetic parameters since the error distribution does not change throughout execution [82]. The PSO rate constant,
The kinetic data correlated with the Elovich model, and parameters were determined using a linear plot drawn between
The results on the kinetics of dye adsorption were also evaluated with the use of the IPD kinetic equation. The steps controlling the possibilities of intraparticle diffusion during Congo red molecule adsorption are the shape and size of molecules, as well as the pore size and pore size distribution of biochar [36, 87]. There are several adsorption stages, including external surface or film diffusion, pore diffusion, surface diffusion, and/or a combination of one or more processes, such as pore surface adsorption [34]. The intercept depicts the impact of the boundary layer. If the intraparticle is the only rate-determining step, the graph between
3.7. Adsorption Mechanism
The present study gives the value of mean free energy of sorption as 0.099 (<8 kJ mol−1), showing that the sorption is physisorption, according to the Dubinin–Radushkevich isotherm. Physisorption is caused by attractive forces of molecules such as H2 donor-acceptor interactions and van der Waals dispersion forces [93]. Dipole-dipole interactions between both the hydrogen surface of the hydroxyl groups on the biochar and the aromatic rings in Congo red dye occur in the biochar-Congo red system, as do interactions connecting the hydrogen surface of the hydroxyl groups on the biochar and the atoms (oxygen and nitrogen; H-acceptor) of Congo red dye [94]. As previously stated, the removal of Congo by breadfruit leaf biochar supported the Langmuir equilibrium model. This isotherm is assumed to have resulted from the adsorption of adsorbate onto a microporous adsorbent (breadfruit leaf biochar), whose surface was coated in a monolayer of adsorbate (Congo red) [90]. Figure 1(b) depicts the FTIR spectrum of Congo red, and the peak at 3731 cm−1 reveals the presence of hydroxyl (OH) and NH2 groups in the compound. The peaks at 1545, 1443, and 1368 cm−1, respectively, were caused by the amine group, –N–H bending, and –S=O stretching vibrations [58]. These biochar peaks provide strong evidence supporting the hypothesis that the mechanism of dye removal needs a simultaneous combination of adsorption and reduction [58]. Adsorption is often controlled by internal, external, or both types of mass transfer. The reluctance of the plot of
4. Conclusions
The current study examines the efficiency of biochar made from breadfruit leaves to adsorb Congo red from an aqueous solution. To identify the composition of the synthesized biochar, it was subjected to XRD, FTIR, and SEM-EDX analysis. Furthermore, the effect of time, Congo red dye concentration, pH, and breadfruit biochar dosage on dye removal from an aqueous solution was investigated and optimized using the response surface methodology. The adsorption capacity and rate equation were calculated using equilibrium and kinetic investigations. X-ray diffractometer results show that the structure of biochar is amorphous. Biochar’s SEM figure illustrates an uneven, porous surface with an average size of 145 nm. According to the findings of the RSM-BBD design, breadfruit leaf biochar had a maximum adsorption efficiency of 99.96% for Congo red at a pH of 6.37, a dye concentration of 45 mg/L, a time of 105 min, and a dose of 1.92 g/100 mL, respectively. The Langmuir model matched the dye adsorption by breadfruit biochar adsorbent, which had the highest sorption capacity of 17.81 mg/g. The PSO describes the kinetics, implying homogenous, monolayer, and physicochemical adsorption.
Footnotes
Data Availability
The data is available in the manuscript.
Conflicts of Interest
The authors declare that they have no conflict of interest.
Authors’ Contributions
Laxmi Deepak Bhatlu M. was responsible for conceptualization, methodology, and supervision; Athira P.S. was responsible for experimentation, data arrangement, validation, writing, and original draft preparation; Neethu Jayan was responsible for editing and reviewing; Debabrata Barik was responsible for supervision and reviewing; Milon Selvam Dennison was responsible for data analysis, editing, and reviewing.
Acknowledgments
The authors sincerely thank the KPR Institute of Engineering and Technology, Coimbatore, India, and Karpagam Academy of Higher Education (KAHE), Coimbatore, India, for providing the research facilities to carry out this research work.