
Abstract
Methylene blue dye (MB dye) is a harmful contaminant for wastewater streams of industries and is harmful to human and aquatic life. An ecofriendly sugar templating process was used to generate porous bentonite/polydimethylsiloxane (PB) and porous magnetite nanoparticles/bentonite/polydimethylsiloxane (PBNP) composite absorbents to remove MB dye in this study. During the infiltration of PDMS solution into the sugar template in the vacuum chamber, bentonite and magnetite particles were integrated on the surface of the PDMS, and the porous structure was generated during the leaching out of sugar particles in water. The absorbents were characterized using Fourier infrared spectroscopy (FTIR) and scanning electron microscopy (SEM). The absence of the methyl bond at 2924 cm-1 and phenol bond at 3325 cm-1 in the FTIR spectra of the formed membrane proves that the food grade sugar was completely removed. The SEM images confirm that porosity was achieved as well as uniform mixing of the in the formation of composite. MB dye was effectively removed from wastewater using the as-prepared composite as absorbent. The removal efficiencies of the composite PBNP and PB were ~91% and ~85%, respectively. The experimental data was applied to pseudo-first-order (PFO) and pseudo-second-order (PSO) kinetic models as well as the Dubinin-Radushkevich, Harkins-Jura, and Elovich models for the adsorption isotherm. The data was found to fit the pseudo-second-order and Elovich models, respectively. The results show that the presence of magnetite nanoparticles improved MB dye removal significantly.
1. Introduction
The advent of the 21st century saw the adoption of Sustainable Development Goals [1]. Key among these goals is the provision of potable water and sanitation, which is important to the quality of human life across the globe [2, 3]. Water scarcity has become common in these times owing to the increase in population and the limited water resources available to satisfy our needs [4]. Currently, only 0.007% of the 2.5% freshwater sources are available for human activities [5]. Contaminants introduced into freshwater systems must be reduced to acceptable levels by statutory bodies to conserve the limited freshwater resources.
Textile industry wastewater is the most contaminated, with serious implications for freshwater bodies all over the world, including Ghana [6, 7]. The main contaminant in textile industry wastewater are dye, and they are present in concentrations that induce colorization of the effluent [8, 9]. Aside from the textile industry, dyes are used in a variety of industries, including leather tanning, cosmetics, paint, paper, and pulp, and are present in significant quantities in their effluents. Dyes in freshwater bodies are concerning since they are detectable in limited amounts and are difficult to remove. Low sunlight penetration and decreased photochemical activity are common consequences, putting aquatic life at risk [6, 10, 11]. The use of dyes and their related chemicals makes effluents poisonous, carcinogenic, and mutagenic, as well as the biochemical and chemical oxygen demand on aquatic life in freshwater, which is harmful to humans [12–14]. As a result, dye removal for industrial wastewater is needed before disposal into the environment.
Over time, dependable and cost-effective technologies for extracting colors from wastewaters have been developed [15]. Some of the most recent methods for eliminating dye as a contaminant from aqueous media include coagulation, filtering, oxidation, improved oxidation technology, electrochemical, biological treatment, ion exchange, and adsorption [16]. In the last decade, close attention has been given to the removal of methylene dye from aqueous media using the following techniques: enzymatic process, photodegradation reaction, electrochemical removal, chemical coagulation, membrane filtration, and physical adsorption methods [17, 18]. These methods all yield the desired results, that is, the removal of methylene blue dye from aqueous media; however, adsorption is more looked into and has seen work in this area doubled within the last decade under review [19, 20]. The choice of adsorption as an efficient method of methylene blue dye stems from its low cost and energy inputs making it a desired choice in this regard [21, 22]. Also, compared with other methods, it gives a comparable removal efficiency with the formation of secondary contaminants due to oxidation or degradation activities that take place in other methods [23, 24].
A great number of adsorbent materials have been looked and proposed as suitable adsorbents for the removal of methylene blue dye from aqueous media. Among these include bentonite clay which has been extensively investigated and proven to dissolve methylene blue dye from aqueous solution [25–29]. Bentonite offers serval advantages over other adsorbents. These are high sorption capacity, low permeability, high chemical and mechanical stability, and large surface area [30]. However, their primary flaw is the absence of a standardized technique for regeneration and recovery in aqueous systems [31].
Because of their low cost, high surface area, open porous structures, and reusability, polymer membranes are increasingly being used as a matrix to retain powdered adsorbent materials for environmental remediation applications [32]. Polydimethylsiloxane (PDMS) is a desirable material for a multitude of applications, including material engineering and biomedical science [33], due to its unique chemical and physical properties. PDMS is an intriguing material because it is transparent, chemically inert, elastic, nontoxic, nonflammable, hydrophobic in nature, affordable, and very flexible [34]. Porous PDMS structures have recently gained a lot of attention in the oil-water separation sector due to their high oil adsorption capacity and porosity [35–38]. Because bentonite powder has been trapped within the PDMS matrix, we have therefore anticipated that PDMS/bentonite composites with open cell architectures may exhibit high dye removal performances in aqueous solutions. As far as we know, research on preparation and dye removal property of a PDMS including bentonite and magnetite nanoparticle adsorbents has not been carried out until now.
The goal of this research is to create and characterize a polymer-clay composite that can remove methylene blue dye from water. This composite was made using polydimethylsiloxane (PDMS), bentonite clay, and magnetite nanoparticles and then tested for dye removal effectiveness in a batch adsorption test; the adsorption kinetics and equilibrium isotherm were modeled using the pseudo-first-order, pseudo-second-order, Langmuir, and Freundlich isotherm models. The usage of polymer-clay/doped composites for the removal of cationic dyes from water is established, and the adsorption mechanism is explained.
2. Materials and Methods
Without any further purification, bentonite clay powder (<50 nm, Sigma-Aldrich) was used as received. Green synthesis was also utilized to make iron oxide (Fe3O4) nanoparticles. Dow Corning Corporation provided the polydimethylsiloxane (PDMS) prepolymer and curing agent (Sylgard 184). A nearby convenience store provided the sugar particles.
2.1. Preparation of Green Synthesized Iron Oxide (Fe3O4) Nanoparticles
2.1.1. Materials
Ferrous chloride FeCl2.4H2O (M.W 198.81), ferric chloride FeCl3.6H2O, and sodium hydroxide NaOH are the reagents that were employed in the synthesis and were all purchased from Sigma-Aldrich. To ensure the synthesis was a green one, maize leave extracts were used as well. There were prepared according to the procedure laid out by Asimeng et. al [39].
2.1.2. Method
Following the procedures known in the literature, the iron (II and III) oxide nanoparticles were synthesized [40–42]. For this synthesis, the molar ratio of Fe3+: Fe2+ applied was 1.4 : 1. The precursors, ferrous chloride tetrahydrate and ferric chloride hexahydrate, were mixed for 20 minutes while being dissolved in 200 mL of deionized water in a batch. When 40 mL of the maize extract is added to the prepared solution, the mixture transforms from pale yellow to light. A 2 M solution of NaOH was added to the mixture dropwise at a rate of 3 mL/min to get the pH up to 11. This is done to make sure that uniform-sized particles form. At pH 11, the mixture is noticed to have black color as compared to the brown noticed at pH 3 to 4. Black particles were seen as precipitates at the bottom of the vessel. These particles are collected using a magnet, washed thrice with deionized water, and allowed to desiccate for identification and characterization.
2.2. Preparation of Bentonite Clay/PDMS Membranes and Bentonite Clay/Iron Oxide (Fe3O4) Nanoparticle/Polydimethylsiloxane (PDMS) Membranes
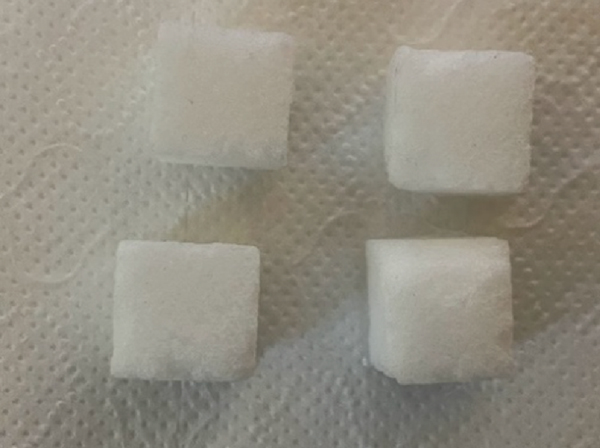
The sugar template approach was used to make pure PDMS membrane, bentonite clay/PDMS membrane (PB), and bentonite clay/iron oxide (Fe3O4) nanoparticle/PDMS (PBNP) membranes. The materials used in the fabrication of the polymer-clay membranes are shown in Figure 1. A sugar template was fabricated by kneading 5.6 g of sugar particles into a

Images of (a) powders used in the preparation of L (left)-R (right): sugar, bentonite, and magnetite nanoparticles, (b) powdered sugar that has been kneaded into cubes, (c) porous PDMS structure, and (d) fabricated membranes.


In a similar experiment to manufacture membranes, PB and PBNP membranes, bentonite clay, and iron oxide (Fe3O4) were mixed uniformly with sugar particles to make sugar/bentonite clay and sugar/bentonite clay/iron oxide (Fe3O4) template. To make the sugar/bentonite clay template, 0.4 g of bentonite clay was combined with 5.6 g of sugar, respectively. 8 mg of iron oxide (Fe3O4) nanoparticles were added to the sugar/bentonite clay template preparation for the sugar/bentonite clay/iron oxide (Fe3O4) template. To make the final PB and PBNP membranes, the other steps were similar. Using an environmentally friendly sugar template approach, three-dimensional porous PDMS, PB, and PBNP composites were created. A Jenway 6705 UV-vis spectrophotometer was used to measure the maximum absorbance value at 668 nm for methylene blue dye solutions with concentrations of 5 mg/L. The wavelength of 668 nm corresponds to methylene blue’s maximum absorption.
2.3. Batch Adsorption Experiment
The adsorption studies were conducted in 250 mL beakers with a 50 mL liquid volume, with an initial methylene blue concentration of 5 mg/L. To prevent photodegradation of the methylene blue solution, wrap the beaker with tin foil and store it in a dark place. Samples of the solution are taken using a syringe after an adsorption time of 1 hour to 5 hours, and the maximum absorbance at 668 nm is evaluated [49, 50]. Adsorption studies were repeated for various adsorption times, and average removal efficiencies were recorded. To explain the dye removal potential, the percentage removal, isotherm, and kinetic modelling parameters were calculated. The experiment was repeated three times for each set of membrane and the average recorded. The experiment was carried out at a constant temperature of
2.4. Characterization
2.4.1. Iron Oxide Nanoparticles
The surface morphology of the samples was investigated using an EDX analysis tool and a Phenom desktop SEM. The Fourier-transform infrared spectroscopy was carried out using a PerkinElmer Fourier-transform infrared spectrometer (PerkinElmer Inc., UK) with a 4000-400 cm-1 scanning range.
2.4.2. Polymer Composite Membrane
Using a Supra 35, scanning electron microscopy (SEM) was used to examine the morphology of PDMS, PB, and PBNP composites (Zeiss, Oberkochen, Germany). The SEM image was supplemented with images from a DVM6 digital microscope and an AxioVision optical microscope (both from ZEISS, Jena, Germany) (Leica). A Fourier-transform infrared spectrometer made by PerkinElmer was used to look at the type of bonds.
3. Results and Discussion
3.1. Characterization
3.1.1. Iron Oxide Nanoparticles
(1) FTIR. The FTIR spectrum results are shown in Figure 2(b). The data analysis reveals that the presence of peaks at ∼3360 cm−1, ∼1630 cm−1, ∼1400 cm−1, ∼860 cm−1, and ∼540 cm−1 was observed.

(a) EDX analysis of synthesized nanoparticles; (b) FTIR spectrum of synthesized nanoparticles; (c) micrograph of synthesized nanoparticles.


The FTIR peak at ∼3360 cm−1 is O–H stretching vibrations corresponding to a phenol compound from the maize extracts; this result is according to Mahdavi et al., who observed peak around 3355 cm-1 [51]. The peaks observed at ∼1630 cm−1 and ∼1400 cm−1 are consistent with peaks which represent proteins and amine [52]. The presence of iron nanoparticles was confirmed by peak found at ∼540 cm-1 which is due to Fe–O bond stretching vibrations. Wang et al. also observed Fe–O bond stretching vibrations approximately at ∼540 cm-1 [53]. In our present findings, FTIR spectra confirm the synthesis of FeO NPs and the presence of amines and phenols in the green synthesized iron (II and III) oxide nanoparticles.
(2) Morphology and Energy Dispersive X-Ray. The EDX data obtained from the synthesized particles suggested in most of the particles formed that there were other elements besides Fe and O, mostly Na and Cl. The presence of these peaks is a result of Na in NaOH alkaline and Cl from the iron salts used in the synthesis. The EDX and SEM analyses of the sample are present in the figure below; the scanning electron microscopy (SEM) image displays the texture and morphology for the Fe3O4 nanoparticles synthesized. The texture and morphology are observed to be irregularly shaped and coarse with particle size ranging between 62.5 μm and 18.3 μm.
3.1.2. Polymer Composite Membrane
(1) FTIR. The FTIR spectra of the materials utilized in the composite’s preparation, as well as the fabricated membrane, are collected and plotted in Figure 3 (check raw data for polymer composites, bentonite, sugar, and magnetite nanoparticles in supplementary information SI.1 to S1.4, respectively). This was done to better understand the nature of the linkages that existed before and after fabrication.

FTIR spectra.
The bands for the raw bentonite include an O-H stretching caused the band at 3615 cm-1, while interlayer and intralayer H-bonded O-H stretching caused the broad band at 3404 cm-1. The siloxane (-Si-O-Si-) group stretching may be responsible for the band at 1634 cm-1. This suggests that the hydroxyl connection between the octahedral and tetrahedral layers is possible. The asymmetric OH stretch (deformation mode) of water produces a very acute and intense band at 1634 cm-1, which is a structural feature of the mineral. Al-OH is responsible for the band at 976 cm-1 and 662 cm-1, respectively [54].
The primary absorption peaks of PDMS were detected at wavenumbers of 2962 cm-1 for the C–H bond stretching in CH3, 1259 cm-1 for the CH3 bond in the symmetric bending in Si–CH3, 1018 cm-1 for the Si–O–Si bond, and 793 cm-1 for CH3 rocking in the Si–CH3 bond [55]. The food grade sugar detected peaks at wavenumbers of 3558, 3325, 2924, 1058, and 997 cm-1. Stretched bond of the OH and phenol groups was found to be present at 3558 and 3325 cm-1, respectively. Methyl group bonds were detected at 2924 cm-1 whereas secondary alcohols were detected at 1058 cm-1. Mono subalkene C-H bond was observed at 997 cm-1 [56]. The Fe-O present in the magnetite nanoparticles are indicated at 540 cm-1 wavelengths [39].
After the membranes were fabricated, FTIR analysis was performed to ascertain the complete removal of the pore forming agent that is food grade sugar and understand the bonds present in newly formed composite. Figure 3 shows the FTIR spectra of the PDMS, PB, and PBNP samples fabricated. From the spectra displayed, no wavelength corresponding to the function group of food grade sugar is present; hence, this proves that it was completely removed in the leaching process. The interaction between the clay and polymer led to presence of new peaks and hence evidence of a new material being formed. Peaks were observed at wavelengths 3353, 2962, 1634, 1259, 1009, 787, 690, and 516 cm-1. However, that of the control sample yield peaks like that of pure PDMS since it was set of as the control for the experiment. Comparing the peaks of the new composites to that of known database, the following interpretations were obtained from the peaks [57]. The peak 3353 cm-1 is consistent with OH stretched bond and is an evidence of water molecules present in the bentonite structure. 2962 cm-1 is shown as evidence of a C-H bond stretching in CH3 and is consistent with the PDMS structure. The occurrences of peaks at 1634 and 1009 show the presence of Si-O-Si bond. 1259 cm-1 is correspondent to CH3 bond in the symmetric bending in Si–CH3. 787 cm-1 peak shows the presence of CH3 rocking in the Si–CH3 bond. 690 peak shows the presence of Al-OH bond. 516 cm-1 is an evidence of Fe-O bond in the material, an indication of magnetite nanoparticles being present.
The bands found between 500 and 1259 cm-1 after the adsorption experiments represent characteristic vibrations of the composite produced. However, between wavenumbers 1400 and 1650 cm-1, two small peaks with R-NH2 functional groups are visible, indicating that the MB dye is being absorbed [58]. Peaks at 3300–3660 cm-1 can be attributed to the -OH stretching of hydroxides (Al-OH, Si-OH, Fe-OH, and H-OH), with the peak at 3315 cm-1 in the PBNP sample indicating the presence of water [59]. The presence of an amino group in the material was discovered to be associated with a reduction or removal of the Si-O-Si bond at 1634 cm-1.
(2) Morphology. A scanning electron microscopy was used to observe the sugar particle, bentonite particles, magnetite nanoparticle, PDMS, PB, and PBNP composites. The sugar particles and magnetite nanoparticles were angularly shaped whereas that of bentonite particles were rounded in shape as shown in Figures 4(a)–4(c). Figures 4(d)–4(f) show the presence of three dimensionally connected pores present within the membrane. It can be seen in Figures 4(e) and 4(f) the presence of bentonite particles and bentonite particles/magnetite particles which indicate that they incorporated in the PDMS matrix.

SEM images of (a) sugar particles, (b) bentonite particles, (c) magnetite particles, (d) PDMS, (e) PB, and (f) PBNP.


3.2. Effect of Contact Time on Removal Efficiency
Figure 5 illustrates the percentage of MB dye removal for the composite as a function of contact time. The amount of methylene blue dye eliminated increases with increasing contact time. This study used a 5-hour equilibrium contact time. In the first two hours, removal of PB and PBNP increases dramatically and quickly. The elimination rates for PB and PBNP were 76.3% and 77.1%, respectively, at this point. This is owing to the initial presence of a significant number of unoccupied dye adsorption sites at the surface. The elimination of PB appears to have plateaued after 3 hours, with an overall removal effectiveness of 84.5% at the end of the study time. It becomes difficult to occupy vacant sites due to repulsive forces between methylene blue adsorbed on the surface of PB and the reduction of active sites for adsorption to take place [60, 61]. However, until the fifth hour, the PBNP composite continues to expand, resulting in a final removal efficiency of 90.8%. The presence of magnetite nanoparticles is responsible for the continuing rise in MB dye adsorption. Due to their huge surface area, these particles provided additional active sites for adsorption [62, 63]. Between the PBNP and the PB sponge, this resulted in a 6.5% increase in removal effectiveness.

Effect of contact time on removal efficiency.
These findings concur with Djamaa et. al whose work recorded a removal efficiency of 78% after 80 minutes using a polymer-clay composite prepared poly (acrylic acid-co-styrene) and organomodified clay [64]. In 2021, Zidan et al. fabricated a polymer-clay composite from poly (methacrylic acid) and natural clay modified with tributylhexadecylphosphonium bromide. This composite yields 80.2% removal efficiency after 25 hours [29]. Adsorption is primarily influenced by the size of the particles and/or the active surface area. The impact of contact duration on adsorption depends on a variety of variables, including the type of the adsorbent surface, the competing ions in the aqueous solution, particle size, pore shape, and contact time.
3.3. Adsorption Kinetics and Isotherm Models
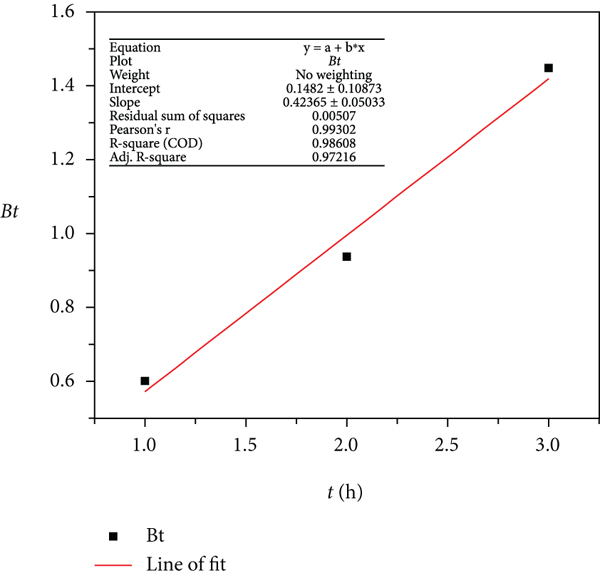
The experimental data for the MB dye adsorption was fitted to the pseudo-first-order, pseudo-second-order, and Weber-Morris intraparticle diffusion and Boyd kinetic model, and the plots are presented in Figure 6. The process kinetics described the solute uptake rate, thereby allowing the estimated residence time required to achieve a definite extent of MB dye removal.

Kinetic model description for adsorbents: (a) control, (b) PB, (c) PBNP, (d) plot of the Boyd kinetic model for control adsorbent, (e) plot of the Boyd kinetic model for PB adsorbent, and (f) plot of the Boyd kinetic model for control adsorbent.
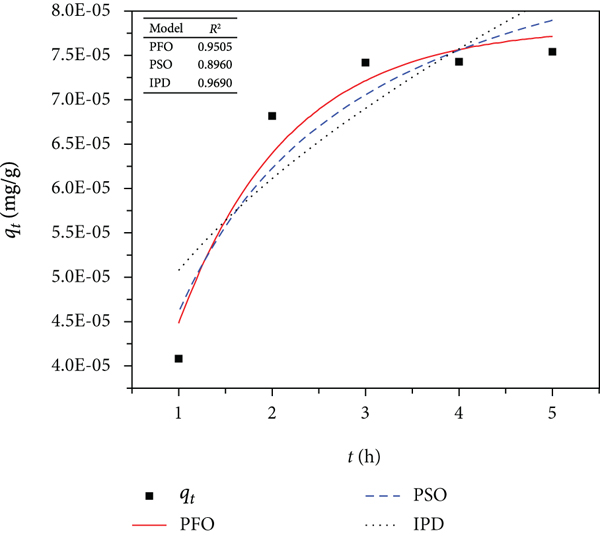


The computed PFO, PSO, IPD, and Boyd parameters for the experimental data are shown in Table 1. The correlation coefficient (
Parameters obtained from the kinetic models of MB dye unto sponges.
The Dubinin-Radushkevich, Harkins-Jura, and Elovich models in nonlinear and linearized form are given in equations (8a), (8b), (9a), (9b), (10a), and (10b), respectively. The computed parameters for the models are given in Table 2.
Parameters obtained from the isotherm models on MB dye unto the sponges.
where
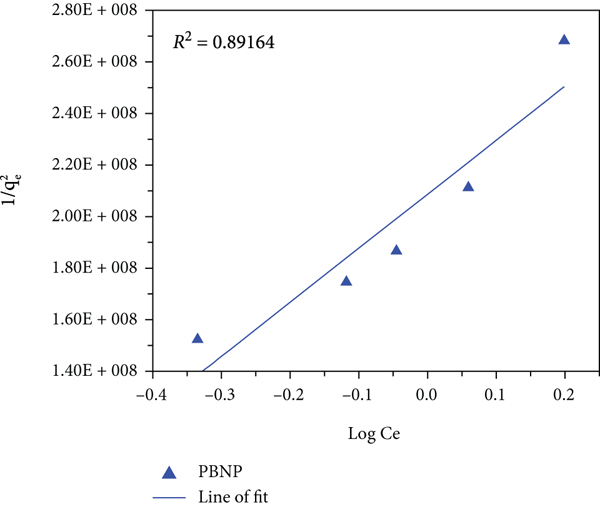
Figures 7–9 show a plot of the experimental data being applied to the linearized Dubinin-Radushkevich, Harkins-Jura, and Elovich models, respectively; it is seen that the adsorption capacity increases with increasing equilibrium concentration of MB dye all absorbents used. The Dubinin-Radushkevich isotherm is an empirical adsorption model that is generally applied to express adsorption mechanism with Gaussian energy distribution onto heterogeneous surfaces. The model is a semiempirical equation in which adsorption follows a pore filling mechanism [79]. It presumes a multilayer character involving van der Waals forces, applicable for physical adsorption processes, and is a fundamental equation that qualitatively describes the adsorption of gases and vapors on microporous sorbents [65]. The experimental data was found to fit this model with a correlation of 0.870 and 0.741 for PB and PBNP, respectively. The model also indicates PBNP as being a better adsorbent than PB for the removal of MB dye. The mean adsorption energy,
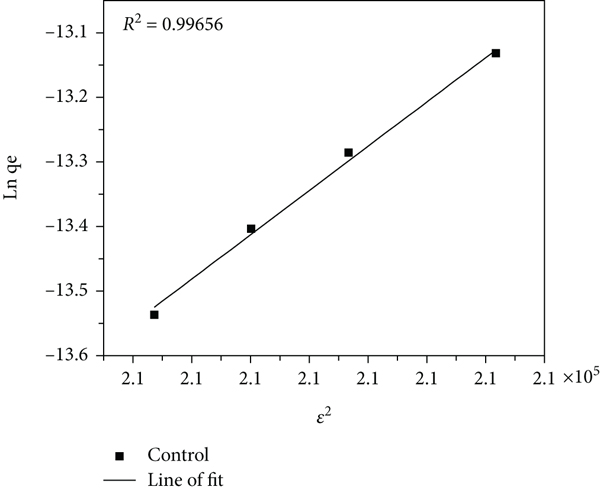
The Dubinin-Radushkevich isotherm plot of control (a), PB (b), and PBNP (c) samples.


The Harkins-Jura isotherm plot of control (a), PB (b), and PBNP (c) samples.


The Elovich isotherm plot of (a) control, (b) PB, and (c) PBNP samples.

While the Dubinin-Radushkevich isotherm plot in Figure 7 estimates the characteristic porosity and the apparent free energy of adsorption, the Harkins-Jura equation assumes the possibility of multilayer adsorption on the surface of absorbents having heterogeneous pore distribution. For this model to hold, the constants
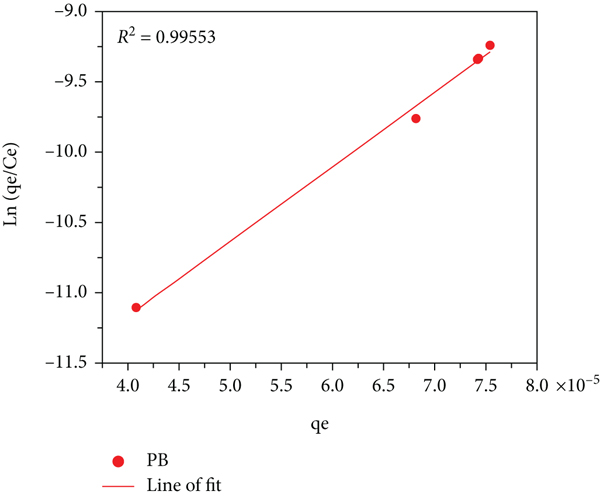
The Elovich model applies the assumption of adsorption sites increasing exponentially with adsorption, which represents multilayer adsorption based on a kinetic principle [84]. This implies that the model is founded on chemical reaction being responsible for adsorption. Comparing this model to the earlier two, the Elovich model gave the best correlation to the experiment data with values of 0.996 and 0.976, respectively, for PB and PBNP. Hence, the data fits the model more perfectly than those earlier applied and thus best explains the mechanism of the adsorption process. This result is consistent with others obtained from members of the scientific community in the explanation of the adsorption of cationic dyes [85–88].
3.4. Proposed Mechanism of Adsorption
The findings of this study point to a chemical and multilayer mechanism at work in the adsorption process, which is in line with the previous research. The electrostatic contact between the K-O, Si-O, and Al–O surface edge groups of the bentonite [59, 89] and Fe-O bond of the magnetite nanoparticles and the sulfonic group of dye [90], as well as the R-NH2 present in MB dye interaction with Si–O bonds present on sponge surface [91], can account for the adsorption mechanism.
Bentonite is recognized to be mostly composed of silica and alumina, with proportional amounts of other metal oxides. Bentonite and magnetite nanoparticles were doped into PDMS, altering both internal and external surface characteristics. Chemical modification of adsorbent surfaces can boost the adsorption capacity of MB dye on adsorbents. This is especially advantageous in the case of adsorbents with negative surfaces, which attract MB dye by Coulombic forces and produce adsorption sites capable of chemical interaction with the sulfonic group present in MB dye when impregnated onto the adsorbent to create positive charges on the adsorbent surface. This mechanism is illustrated in Figure 10(a); here, the negative O ions present in bentonite are seen to interacting with positive S+ group from the dye; this leads to adsorption. This interaction is made possible due to the high electronegative of oxygen ions as well as the charges present in solution.

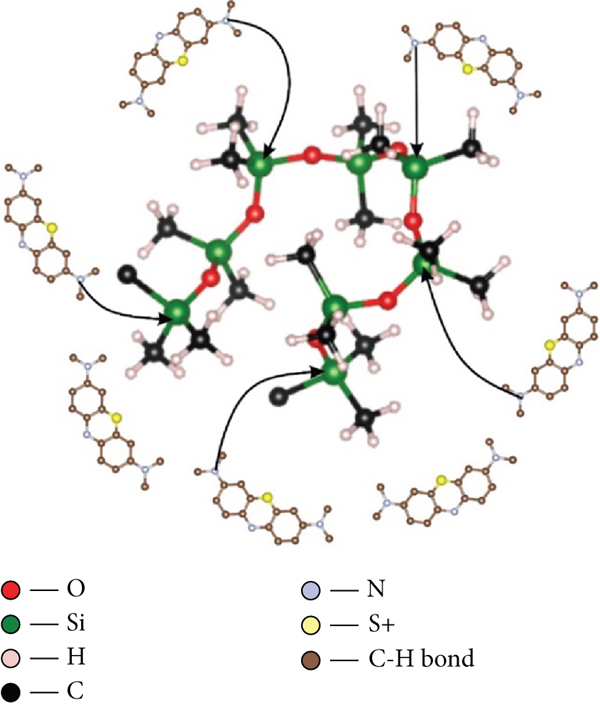
(a) Illustration of adsorption mechanism A. (b) Illustration of adsorption mechanism B. (c) Illustration of adsorption mechanism C.

The parent material in the production of the sponges is mainly aluminosilicate and polymer organosilicon materials, which is a composite. Metal oxides, especially multivalent ions such as Fe3+, are crucial in the adsorption of MB dye. In Figure 10(b), possible breakdown is envisaged for the magnetite, which modifies the surface of the membrane. Iron(III) oxide in presence of water is protonated; this attachment forms a multivalent ion. During the formation of iron hydroxide, the sulfonic ions present in the aqueous solution of MB dye would replace the Fe3+ ions in the iron crystal lattice without disturbing the crystal structure of the dye compound. Similarly, Fe3+ ions would bind to the OH ions present in water to form a hydrated compound.
The presence of Si-O in the PDMS and its interaction with R-NH2 functional group in MB dye also accounts in the adsorption process. Nitrogen ions are very reactive and smaller in size than silicon ions and hence are able to replace them on the adsorbents surface. Their small size and high ionization energy make bond formation possible with oxygen ions present in PDMS. The nitrogen ions replace the silicon ions in the lattice structure of PDMS as shown in Figure 10(c).
4. Conclusion
This study shows that utilizing a polymer-clay composite with magnetite nanoparticles, it is possible to remove methylene blue dye from water (PB and PBNPs). After 5 hours of contact time, the maximum percentage removal for PBNP and PB adsorbents was 90.8% and 84.6%, respectively. Magnetite nanoparticles are used to demonstrate an increase in removal efficiency. The adsorption of MB dye can be best described by the Weber-Morris intraparticle diffusion model for kinetics and the Elovich model of the adsorption isotherm and hence the mechanism of adsorption. This research clearly demonstrates a practical and sustainable technique for designing filtering systems to remove MB dye from industrial wastewater using readily available and inexpensive components. The following are limitations of this study and can be considered for further work: the influence of varying pH ranges on the performance adsorbent, the effect of temperature on the process, and the reusability studies of the fabricated adsorbent.
Footnotes
Data Availability
The experimental data used to support the findings of this study are included within the supplementary information file(s).
Conflicts of Interest
The authors declare no conflict of interest.
Acknowledgments
Appreciation is extended to Prof Marcin Adamiak, Prof. Tomasz Jarosz, Prof. Agnieszka Stolarczyk, and Patryk Janasik all of Silesian University of Technology, Poland, for their constructive discussions and technical support. We are also grateful to Biomedical Engineering Department, University of Ghana for provision of chemicals. The materials/reagents in this research were solely financed from research allowances of the authors. Characterization was undertaken by support of Department of Materials Science and Engineering Laboratory.