
Abstract
Due to the insufficient accurate evaluation model of gas resources in abandoned mines, the development and utilization of abandoned mine gas resources in China are still in the preliminary exploration stage. To this end, in response to the problem of imprecise assessment of gas resource reserves in the adsorbed state of residual coal, the No. 3 coal seam in Jincheng mine was used as the research object, by analyzing the evolution of the ambient gas pressure and temperature of the residual coal in the abandoned mine, and simulating the pressure and temperature environment in which the residual coal is located, the gas adsorption experiment of the residual coal was carried out in this environment, and a gas storage model of the residual coal was constructed with the combination of the adsorption theory. The results show that pressure has a positive effect on gas adsorption by residual coal, while temperature has a negative effect on it. The adsorption potential gradually decreases with increasing pressure and increases with increasing temperature, while the adsorption space increases with increasing pressure and decreases with increasing temperature. The adsorption characteristic curves obtained by the two methods are temperature independent and polynomial in shape, and the fitted correlation coefficient of method 1 is generally higher than that of method 2. The adsorption characteristic curves of two methods are best fitted at
1. Introduction
For a long time, coal, as a basic energy source and an important industrial raw material in China, has strongly supported the development of the national economy and made remarkable contributions to economic construction [1]. However, the phenomenon of low concentration and disorderly competition in China’s coal enterprises has seriously affected the effective and stable development of coal economy. For this reason, China has continuously introduced relevant policies to integrate and close mines with poor safety conditions and backward production capacity [2]. The number of coal mines in China was reduced from more than 100,000 in the 1990s to less than 8,000 in 2016, and by the end of 2020, the number of coal mines in the country was reduced to 4,700 [3]. According to the key consulting project of the Chinese Academy of Engineering, “strategies of high efficiency recovery and energy saving for coal resources in China,” the number of large-scale abandoned mines in China will reach 15,000 by 2030 [4]. Abandoned mine gas resources development is a new idea for secondary development and utilization of abandoned mines and coal resources depleting mines, as well as a new trend for gas extraction and utilization in China in the longer term [5]. Unfortunately, the basic theory of abandoned mine gas resources development and utilization has not been completely conquered, especially that the accurate assessment model of abandoned mine gas resources needs to be further improved, which makes the abandoned mine gas resource development and utilization in China still in the preliminary exploration stage.
For the development and utilization of abandoned mine gas resources and resource assessment methods, the United Kingdom, Germany, and the United States began to research as early as the 1990s and have achieved fruitful results [6, 7]. Among them, Raven Ridge Resources in the United States constructed a hyperbolic decay model of natural gas (coalbed methane) outflow from abandoned mines [8], in which the outflow gradually decreases with the decay of gas energy after mine closure, with a rapid reduction rate at the beginning and then decreasing gradually. Erwin and Schluter of German Mining Technology studied the estimation method of gas (CBM) resources in coal-depleted mines and proposed the steps to estimate the gas (CBM) resources in coal-depleted mines [9]. Drawing on foreign concepts of CBM development in abandoned mines, the methods for estimating gas resources in abandoned mines in China mainly include material balance method, resource composition method, numerical simulation of gas reservoirs, decline curve method, and material parameter balance method [10, 11]. Shi et al. [12] established a generalized material balance equation considering the effects of critical desorption pressure, stress sensitivity, matrix shrinkage, and gas solubility in water, which can elucidate shale gas and coalbed methane reservoir reserves in detail. Li and Wen [13] proposed the “direct addition method” based on the different base conditions of the target mine area, and the key parameters of this estimation model include residual coal resources, residual coal seam gas content, coalbed methane volume fraction, and total pore volume. Wen et al. [14] established a gas resource assessment model based on the idea of “indirect subtraction” in the mining stability zone by analyzing the source, space, and key influencing factors of gas. Guo et al. [15] combined the affinity propagation (AP) algorithm and long short-term memory (LSTM) network to develop CBM production prediction model based on deep learning.
Throughout the research results of gas resource reserve evaluation models for abandoned mines, scholars have carried out research from different perspectives using various means. However, most of the previous studies focused on free gas reserves, and the estimation models obtained were mainly developed for free gas, with less research on adsorbed gas reserves of residual coal. Although some scholars have researched on adsorbed gas resources of residual coal, most of them are obtained by indirect calculation method, among which the more typical models of adsorbed gas reserves are based on the idea of “direct addition” and “indirect subtraction.” Both of them have high accuracy, but they require more stringent mine data, such as the original gas reserves, gas extraction, air discharge during mining, and gas escape after shutdown. Since many abandoned mines were closed earlier, the required information is difficult to obtain accurately, which makes the application of the “direct addition” and “indirect subtraction” methods somewhat limited, and the indirect calculation method masks the influence of the evolution of the environment (ambient gas pressure and temperature) in which the coal remains located on its adsorption characteristics and adsorption capacity. Therefore, this paper starts from the evolution of the environment (ambient gas pressure and temperature) in which the residual coal located and constructs a model of gas reserves in the adsorbed state of the residual coal in abandoned mines by conducting experiments of gas adsorption under different ambient gas pressure and temperature conditions and combining with adsorption theory, so as to lay the theoretical support for the development and utilization of gas resources in abandoned mines.
2. Samples and Methods
2.1. Ambient Pressure and Temperature Evolution in Abandoned Mines
Due to the limitations of coal mining technology, a large amount of residual coal is still stored underground after the mine is abandoned. The pressure and temperature of the ambient gas experienced by the coal body broken and piled up in the underground are constantly changing. Before the closure of the mining area, the gas in the coal desorbed and escaped, and after the closure of the mining area, the gas in the deep coal pillar and adjacent layers gushed outward through fracture voids, and the ambient gas pressure in which the crushed residual coal was located increased, secondary adsorption occurred, and the gas content in the coal increased. At the same time, the broken residual coal is in contact with air, physical or chemical adsorption occurs, and slow oxidation is carried out, releasing heat, and the heat generated cannot be dissipated, resulting in heat accumulation and continuous heating [16]. When the temperature exceeds the critical temperature of about 80°C, the oxidation is further accelerated, causing the temperature of the coal body to rise sharply [17].
2.2. Coal Sample Selection and Preparation
The coal sample used for the experiment was Jincheng anthracite coal from Shanxi Province, which is the first region in China to develop the gas resources of abandoned mines, and the area is rich in coalbed methane resources with high exploration and development value. The collected coal samples were prepared into 1 ~ 3 mm particle size, sealed, and stored for spare (see Figure 1), while the coal samples were made into less than 0.2 mm particle size, and the proximate analysis of coal samples was carried out according to the standard of “Proximate Analysis of Coal” (GB/T212-2008), and the test results are shown in Table 1.

Coal sample.
Proximate analysis results of coal samples.
2.3. Experimental Method
The equipment used in the experiment is shown in Figures 2 and 3. The equipment can simulate the ambient temperature and pressure changes of the coal sample, using a constant temperature water bath to make the adsorption temperature of the coal sample constant for a certain period of time, and the ambient temperature can be freely adjusted according to the preset temperature point. Different adsorption equilibrium pressures can be achieved according to the amount of filling, and the methane adsorption experiments under different temperature and adsorption equilibrium pressure can be realized, and the experimental data can be monitored and recorded in real time. The specific experimental steps are as follows:
Loading sample. Put the coal sample into the dry box for moisture removal, weigh 150 g coal sample into the coal sample tank and seal it, and make sure the connection between the coal sample tank and each part of pipeline is intact
Evacuation. Open the inflatable valve 35(35
Set the temperature. Raise the water bath device so that the water can submerge the coal sample tank, start the water bath device, set the water bath temperature to the desired temperature, and wait for the water bath temperature to stabilize at the set temperature
Coal sample tank filling. Open the inflatable valve 35(35
Calculation of adsorption capacity. After opening the balance valve, the coal sample starts to adsorb methane gas, and after sufficient adsorption for a long time, the coal sample is adsorbed in equilibrium, and the adsorption equilibrium pressure

Schematic diagram of the experimental setup.
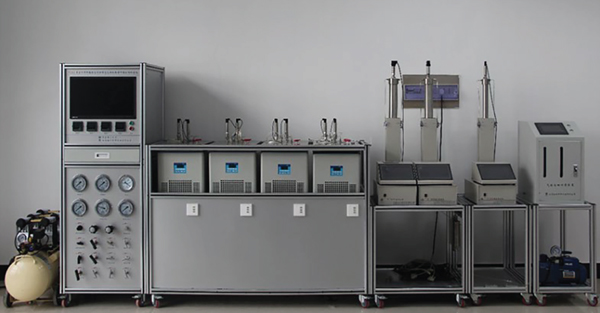
Experimental device.
The difference
The amount of methane adsorbed per gram of coal is as follows:
According to the experimentally set temperature points, the above steps were repeated to perform adsorption tests with different adsorption equilibrium pressures at each temperature, so as to obtain the gas adsorption amount under each set of experimental conditions
3. Results and Discussion
3.1. Residual Coal Adsorption Gas Experiment
Based on the ambient pressure and temperature changes to which the coal remains were subjected after mine closure, the secondary methane adsorption process of the coal samples was simulated by testing the gas adsorption characteristics during the gradual increase in adsorption pressure, and three temperatures were set at 30°C, 60°C, and 90°C to simulate the temperature change process experienced by the residual coal. The experimental results are as follows:
As can be seen from Figure 4, the amount of methane adsorbed by the residual coal at different temperatures all showed an increasing trend with increasing adsorption equilibrium pressure, with the higher the pressure, the greater the amount of methane adsorbed when the temperature was the same. Comparing the adsorption of coal samples at different temperatures, the higher the temperature, the lower the methane adsorption capacity. At the same time, the negative effect of temperature on gas adsorption gradually increases as the adsorption equilibrium pressure increases.

Methane adsorption by residual coal at different temperatures.
The adsorption capacity obtained by isothermal adsorption experiments is the excess adsorption capacity, which represents the amount of adsorption left by the actual adsorption phase density minus the gas phase density, and the absolute adsorption capacity is the total amount of all adsorbed phase gases, that is, the actual adsorption amount of the solid adsorption system [18]. Therefore, when studying the gas storage model, the excess sorption should be converted to absolute sorption.
According to the definition of absolute sorption, the relationship between absolute sorption and excess sorption is [19]:
The adsorbed phase density (
Method 1 [21]:
Method 2 [22]:
As shown in Figure 5, the absolute adsorption capacity obtained by both methods is greater than the excess adsorption capacity, and both temperature and pressure have an effect on the difference between the two. When the adsorption equilibrium pressure
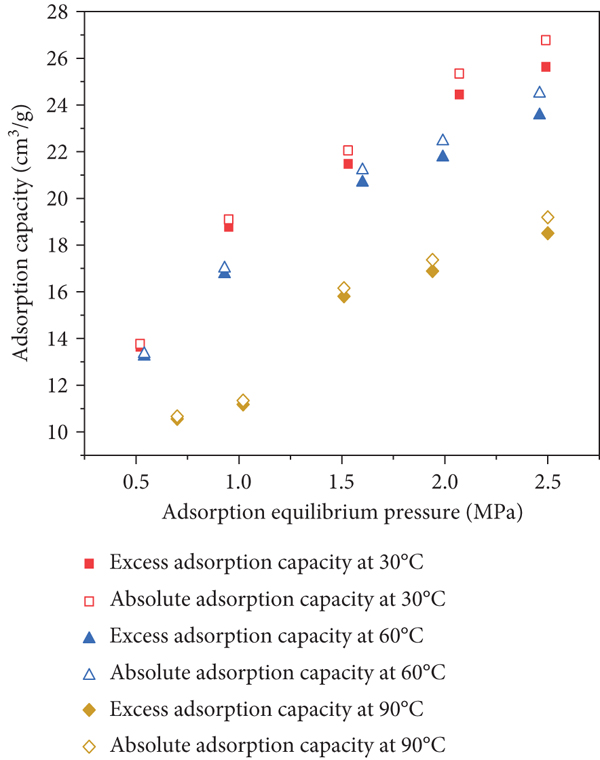
Absolute adsorption curve.

Method 2
3.2. Adsorption Characteristic Curves and Adsorption Properties
The common theories of adsorption are broadly divided into the molecular layer adsorption theory and the pore filling theory. The molecular layer adsorption theory mainly includes the single molecular layer adsorption theory and the multimolecular layer adsorption theory, which considers the adsorption of gas molecules in layers on the pore wall [23]. Dubinin introduced the adsorption potential theory to the study of microporous adsorption and proposed the microporous filling theory, which is different from the layer adsorption on the pore wall described by Langmuir, BET, and other theories, but the filling of the microporous volume [24]. The advantage of the adsorption potential theory is that the effect of temperature and pressure on the adsorption capacity can be fully characterized. The core idea is to establish adsorption characteristic curves based on isothermal adsorption experimental data [25].
The Polanyi adsorption potential theory is a quantitative expression of the magnitude of the adsorption potential for the analysis of inhomogeneous solid surfaces [26]. The Polanyi adsorption potential theory assumes that in gas adsorption, the forces between nonpolar molecules are dispersion forces, independent of temperature, and that the relationship between adsorption potential and adsorption volume is independent of temperature [27]. Therefore, it is only necessary to know the adsorption data at a certain temperature in order to deduce the adsorption characteristic curve. According to the Polanyi adsorption potential theory, the relationship between adsorption potential and pressure is as follows [28]:
The saturation vapour pressure calculated from the critical conditions differs significantly from the actual situation because the ambient temperature of methane is much higher than its critical temperature. The saturation vapour pressure is not defined for supercritical gases, and the improved Dubinin and Radushkevich formula proposed by Dubinin and Astakhov is used to calculate the saturation vapour pressure of methane under supercritical conditions [29, 30].
The pores of the coal body provide space for gas adsorption, called the adsorption space. The size of the adsorption space for a single component gas is calculated as follows [31].
Method 1 was used to calculate the adsorption phase density, and the adsorption characteristic curves at different
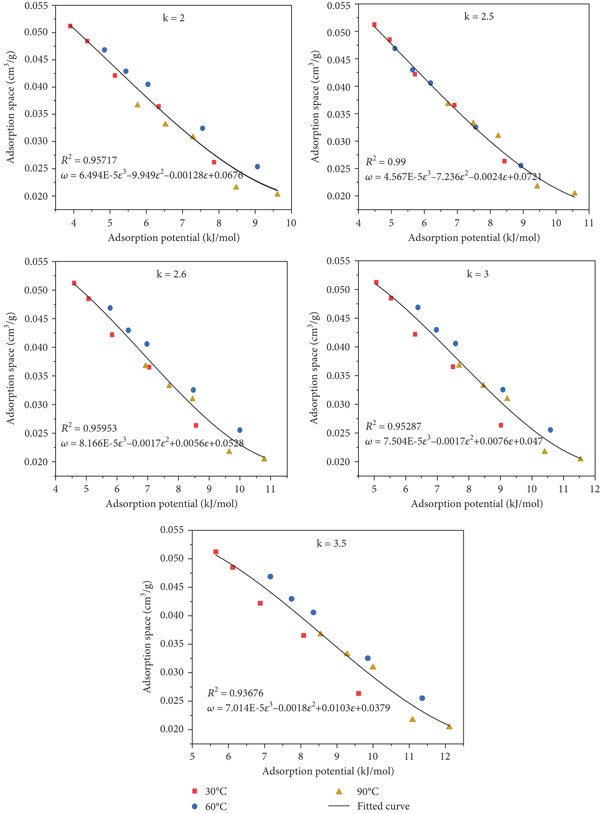
Residual coal-methane adsorption characteristic curve (method 1).
Method 2 was used to calculate the adsorption phase density, and the characteristic curves of adsorption at different

Adsorption characteristic curve (method 2).
From the adsorption characteristic curves in Figures 6 and 7, it can be seen that the adsorption characteristic curves
Both method 1 and method 2 are best fitted at
The resulting adsorption potentials for the residual coal at different temperatures and pressures are obtained. Figure 8 shows that at the same temperature, the adsorption potential of the coal decreases with increasing equilibrium pressure, and the rate of decline gradually slows down with increasing pressure. Taking 1.5 MPa as the boundary, the adsorption potential-pressure curve decreases sharply in the low-pressure phase, while the adsorption potential decreases slowly in the high-pressure phase. The higher the equilibrium pressure, the lower the adsorption potential required to adsorb methane from coal and the easier it is for coal to adsorb methane. At the same equilibrium pressure, the adsorption potential of coal gradually increases with temperature. The higher the temperature, the easier it is for the adsorbed methane molecules to break away from the van der Waals forces and the greater the adsorption potential required for the coal to adsorb methane.

Variation in adsorption potential of residual coal with pressure and temperature.
The variation in the adsorption space of the residual coal with the adsorption equilibrium pressure and temperature, as calculated by both methods, is shown in Figure 9. As can be seen from the graph, the adsorption space of the coal is significantly influenced by temperature and pressure. The adsorption space for both method 1 and method 2 increases with increasing adsorption equilibrium pressure, and the gravitational field present in a certain space near the surface of the residual coal increases, making it easier to adsorb methane. At the same adsorption equilibrium pressure, the adsorption space of method 1 tends to decrease as the temperature increases, reducing the space for the gravitational field action and decreasing the ability of the coal body to adsorb methane. In contrast, the adsorption space of method 2 showed an insignificant pattern of variation from 30 to 60°C, and the adsorption space decreased at 90°C because the methane adsorption phase density was affected by temperature.

Variation in adsorption space of residual coal with pressure and temperature.

Method 2
3.3. Residual Coal Adsorbed Gas Reserve Model
The relationship between the adsorption potential
For the adsorption system, the adsorption characteristic curve is unique, and only the adsorption isotherm at one temperature needs to be measured to calculate the adsorption isotherm at any temperature and pressure. Therefore, the values of the four parameters
Expressions for adsorption characteristic curves.
To verify the accuracy of the equation, the methane adsorption volumes are now predicted for different pressures at 30°C and 90°C. The adsorption potential is calculated by substituting the values of the different temperatures and pressures into Equation (9), and the volume of adsorption space of the coal with this adsorption potential is obtained by substituting the calculated volume of sorption space into Equation (11). The experimental measured adsorption volume is then compared with the predicted adsorption volume to determine the magnitude of the error.
Figure 10 shows the measured and predicted values of adsorption capacity at different temperatures and at each adsorption equilibrium pressure, from which it can be seen that the predicted values of method 1 are in general agreement with the measured values, while the predicted values of method 2 are slightly different from the measured values. Figure 11 shows the relative error between the measured and predicted values, with 1.55 MPa as the dividing line into the high and low pressure. The graph shows that both methods have a slightly larger prediction error at lower pressures, mainly due to the small amount of gas adsorption at low pressures, which can easily cause testing errors. At higher pressures, the predictions are better, with relative errors of less than 2% for each data point for method 1 and less than 10% for method 2. The results of the relative errors of the two methods show that the average relative errors of method 1 and 2 are 2.98% and 7.13%, respectively. In general, the relative errors of the adsorption isotherms predicted by method 1 are significantly smaller than those of method 2, and the prediction results meet the requirements of engineering applications; therefore, method 1 can be used to predict the adsorption isotherm model based on the adsorption potential theory.

Adsorption curves predicted by methods 1 and 2.

Method 2

Relative error of adsorption characteristic curve prediction for methods 1 and 2.

Method 2
Substitute Equations (9) and (11) into Equation (13) to obtain
The transformation of Equation (14) gives a predictive model for adsorption isotherms based on the theory of adsorption potential:
4. Conclusion
Both pressure and temperature have an effect on the amount of gas adsorbed by residual coal. Therefore, on the basis of simulating the ambient pressure and temperature in which the residual coal is located in the abandoned mine, isothermal adsorption data of the residual coal were obtained, and adsorption characteristic curves expressing the relationship between the adsorption potential The best fitting of the adsorption characteristic curves was obtained for both methods at Comparing and analyzing the adsorption characteristic curves of the measured and predicted values at different temperatures under the two methods, both methods have slightly larger prediction errors at lower pressures and better prediction results at higher pressures. The average relative errors of method 1 and 2 were 2.98% and 7.13%, respectively. The prediction effect of method 1 was significantly better than that of method 2 and met the requirements of engineering application; therefore, the residual coal adsorption gas storage model was established using method 1
Footnotes
Data Availability
The data used to support the findings of this study are included within the article.
Conflicts of Interest
The authors declare no competing financial interest.
Acknowledgments
This research was supported by the National Natural Science Foundation of China (no. 52074105), the Key R & D and Extension Projects of Henan Province (no. 202102310223), the Key Scientific Research Projects of Colleges and Universities in Henan Province (no. 22B620002), the Doctoral Foundation of Henan Polytechnic University (B2021-7), the Key Science and Technology Project of Henan Province (no. 222102320017), the State Key Laboratory Cultivation Base for Gas Geology and Gas Control (Henan Polytechnic University) (no. WS2021A06), and the Fundamental Research Funds for the Universities of Henan Province (NSFRF230103, NSFRF230401, and NSFRF230420).