
Abstract
This work presents a fabrication of room-temperature gas sensor for hydrogen sulfide (H2S) adsorption. Pristine titanium dioxide (TiO2) nanofibers, reduced graphene oxide (rGO) sheets, and reduced graphene oxide-wrapped titanium dioxide (rGO-wrapped TiO2) nanofibers were presented in the form of integrated suspension used for a gas-sensing layer. The TiO2 nanofibers were firstly synthesized by using an electrospinning method with a polyvinylpyrrolidone (PVP) polymer. The rGO sheets were then wrapped around TiO2 nanofibers by a hydrothermal method. Scanning electron microscope, transmission electron microscope, X-ray diffractometer, and Raman spectrometer confirmed the presence of rGO sheets onto the surface of TiO2 nanofibers. Ultraviolet-visible spectrophotometer was also considered and displayed to calculate the band gap of TiO2 and rGO-wrapped TiO2 nanofibers. After preparing the gas-sensing suspensions, they were dropped onto the polyethylene terephthalate substrates with silver-interdigitated electrodes. The gas-sensing properties of sensors were evaluated for H2S adsorption at room temperature. Based on the results, the rGO-wrapped TiO2 nanofiber gas sensor exhibited higher H2S sensitivity and selectivity than pristine TiO2 nanofiber and pure rGO gas sensors. The H2S-sensing mechanism of rGO-wrapped TiO2 nanofiber gas sensor was discussed based on a formation of p-n heterojunctions between p-type rGO sheets and n-type TiO2 nanofibers. Furthermore, a direct charge-transfer process by physisorption was also highlighted as a second H2S-sensing mechanism.
1. Introduction
Hydrogen sulfide (H2S) is an extremely harmful and flammable gas. It smells like rotten eggs at low concentration in the air. The harm of H2S is dependent on its concentration and exposure time. A short-term exposure to over 500-1000 ppm of H2S is immediately fatal [1]. Repeated exposure to H2S in concentrations even 10-500 ppm can cause serious damage to organs and central nervous system [1–3]. Therefore, the sensor for the detection of H2S is required to be developed with high sensitivity and fast response at low concentration. In the past several decades, the metal oxide semiconductor (MOS) nanostructures have become one of the popular materials in gas-sensing applications. The MOS gas sensors have been led to the adsorption in toxic gases [4–6]. However, the adsorption of most H2S needs to operate at high temperatures [7, 8], although some types of MOS gas sensors can be operated at room temperature under the influences of humidity [9–13]. The MOS provides a large number of free electrons in the conduction band and oxygen vacancies on the surface of the metal semiconductors, resulting in strong adsorption characteristics and high reactivity on the surface of gas molecules [14–17]. Among various MOS materials, titanium dioxide (TiO2) and its composite have been reported as a popular material for applications in lithium-ion storage [18, 19] and photoelectrocatalysis [20–22]. Due to its strong oxidizing power, abundant existence in nature, nontoxicity, and long-term physical and chemical stabilities, TiO2-based gas sensor has been widely used as an efficient gas absorber [23–29]. However, its application has been restricted because of issues such as a low sensitivity, poor selectivity, large band gap, and high operation temperature. Recently, graphene, graphene oxide (GO), and reduced graphene oxide (rGO) have been accepted as a good candidate for improving the functional properties of metal oxide at room temperature [30–36]. It has been very sensitive to chemicals owing to its monolayer structure such as high thermal conductivity, high specific surface area, and high electron mobility at room temperature. However, it has still low sensitivity, poor selectivity, and slow recovery capability which is not suitable for gas-sensing applications. The hybrid nanostructures based on p-type rGO and n-type TiO2 semiconductors have been mentioned to the formation of p-n heterojunctions, resulting in the enhancement of gas-sensing properties for the nanocomposite materials [37, 38]. The hybrid nanostructures of graphene and semiconductor metal oxide have mainly prepared by electrospinning and hydrothermal processes [38–40]. The electrospun nanofibers have been reported in the special properties such as high specific surface area and porosity [40–43]. Therefore, they are beneficial for application in gas sensor or gas absorber. More importantly, there have not been many publications for the use of rGO-wrapped TiO2 nanofibers as a room-temperature H2S gas sensor although some works on fabrication methods of TiO2 nanofibers followed by TiO2 wrapped with rGO have been reported [19, 44].
In this work, we have synthesized rGO-wrapped TiO2 nanofibers by using a combination of electrospinning and hydrothermal methods. The samples were characterized by a scanning electron microscope (SEM), a transmission electron microscope (TEM), an X-ray diffractometer (XRD), a Raman spectrometer, and an ultraviolet-visible (UV-Vis) spectrophotometer. The sensing performance of rGO-wrapped TiO2 nanofiber gas sensors was systematically evaluated, relating to the sensitivity, selectivity, and stability properties for H2S adsorption at room temperature. The pristine TiO2 and pure rGO gas sensors were also fabricated and evaluated as comparisons. The H2S-sensing mechanism of rGO-wrapped TiO2 nanofibers is discussed based on the formation of p-n heterojunctions. Furthermore, a direct charge-transfer process by physisorption is also highlighted as a second possible H2S-sensing mechanism.
2. Materials and Methods
2.1. Preparation of rGO-Wrapped TiO2 Nanofibers
The preparation process of TiO2 solution is shown in Figure 1(a). Firstly, 0.9 g polyvinylpyrrolidone (PVP) polymer was dissolved and stirred in 10 ml ethanol for 1 h. During stirring, 2 ml tetrabutyl titanate (TBT) and 1 ml acetic acid (CH3COOH) were added into the solution. The mixed solution was continuously stirred for 1 h to obtain a homogeneous precursor solution. To prepare the electrospinning TiO2 nanofibers, the TiO2 solution was then loaded into a plastic syringe with a small metallic nozzle. It was fixed on a syringe pump and connected to a high voltage power supply of 18 kV. The distance between the nozzle and an aluminium rolling collector was 15 cm. The collector was controlled by a DC motor controller with a fixed angular speed of 0.5 rpm. A sheet of TiO2 nanofibers was continuously accumulated on a rolling collector for 40 min. The schematic illustration for preparing the TiO2 nanofiber by using electrospinning method is shown in Figure 1(b). Inset shows a photograph of nanofiber sheet on a rolling collector. After the electrospinning process, the as-spun TiO2 nanofibers were heated at a fixed temperature of 500°C for 2 h to decompose PVP and crystallize TiO2.
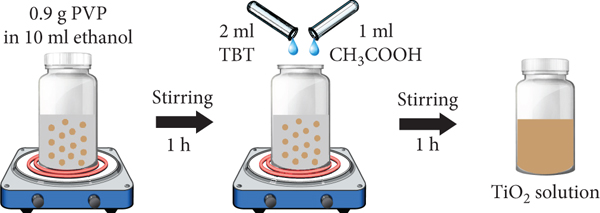
Schematic illustration of preparation for (a) TiO2-based solution, (b) electrospun-TiO2 nanofibers (inset shows a photograph of nanofiber sheet on a rolling collector), and (c) rGO-wrapped TiO2 nanofibers.

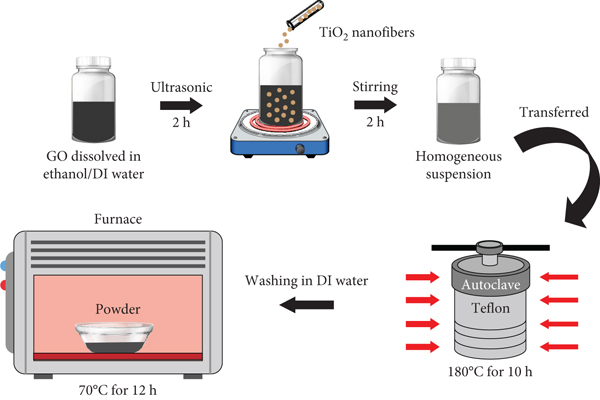
For preparation of rGO-wrapped TiO2 nanofibers, a sheet of accumulated TiO2 nanofibers was crushed with a clean mortar and pestle. Then, 50 mg of GO was dissolved in a solution containing 20 ml of dimethyl sulfoxide (DMSO) and 20 ml of deionized (DI) water under ultrasonication for 2 h. At a same time, 70 mg of TiO2 nanofibers was then added into the solution to obtain a homogeneous suspension. Then, it was transferred to a 40 ml Teflon autoclave and heated up to 180°C for 10 h. After that, it was then rinsed several times with DI water and dried at 70°C for 12 h. Finally, the rGO-wrapped TiO2 nanofibers were obtained. For preparation of rGO sheets, the GO powder was treated at the same condition without TiO2 nanofibers. The schematic illustration of rGO-wrapped TiO2 nanofibers in preparation process is shown in Figure 1(c). The samples were examined by SEM (Quanta 450 FEI), TEM (Hitachi HT7700), XRD (Bruker D8 Advance), and Raman spectrometer (Perkin Elmer Spectrum GX). The UV-Vis spectrophotometer (Perkin Elmer Lambda 950) was conducted and displayed to calculate the band gap of samples.
2.2. Fabrication of rGO-Wrapped TiO2 Nanofiber Gas Sensor
To prepare the rGO-wrapped TiO2 nanofiber gas sensor, the dried powder of rGO-wrapped TiO2 nanofiber (20 mg) was dispersed in 1 ml DI water and 1 ml ethanol under ultrasonication for 5 min. Then, the suspension was dropped onto a polyethylene terephthalate (PET) substrate with silver-interdigitated electrode (Ag-IDE) and dried at room temperature. Figure 2 shows the photograph of dimensional Ag-IDE before and after drop-casting with 20 μl rGO-wrapped TiO2 nanofiber-sensing suspension. It is seen in Figure 2(a) that the width and the interdigit spacing of the electrode are found to be ~1.0 mm. The size of a drop-casted sensing suspension is approximately

Photograph of dimensional Ag-IDE (a) before and (b) after drop-casting with a sensing suspension on PET substrate.

2.3. Gas-Sensing Measurement
The gas-sensing properties of pristine TiO2 nanofiber, rGO, and rGO-wrapped TiO2 nanofiber gas sensors were evaluated on their performances by using a gas-measurement system. The system consists of a tank of H2S, a tank of pure air, two mass flow controllers, a mixer, a test chamber, a circuit board, a power supply, a digital multimeter, and a ventilator. The fabricated gas sensor was loaded into a test chamber which is connected to a voltage divider circuit. The H2S and pure air were used as target and background gases, respectively. The sensing signals were determined by the measurement of sensor resistance in every second when they were exposed to target and background gases. The signals were monitored by a laptop computer operated with a program in LabVIEW software. After the measurement, the remaining gas was removed out of the chamber by the ventilator. The schematic illustration of gas-measurement system is displayed in Figure 3.

Schematic illustration of gas-measurement system (inset shows a photograph of stainless-steel chamber with electrical signal wires).
3. Results and Discussion
3.1. Morphological, Structural, and Electronic Properties of rGO-Wrapped TiO2 Nanofibers
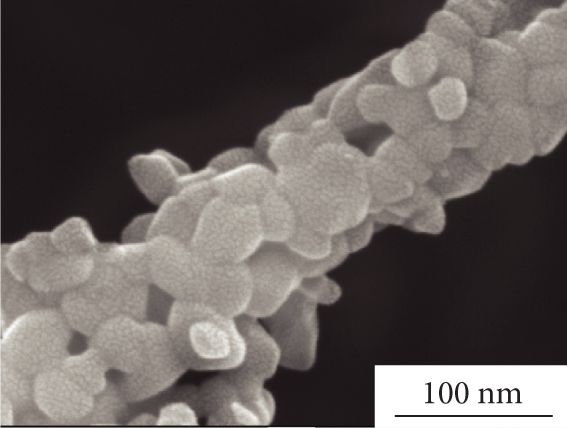
The morphologies of a graphene oxide (GO) sheet, TiO2 nanofibers, and rGO-wrapped TiO2 nanofibers are displayed by TEM and SEM images, as shown in Figure 4. Figure 4(a) demonstrates TEM image of a GO sheet in DMSO solvent. It is seen that the GO sheets in DMSO solvent are well spreadable. Therefore, the DMSO solvent is a good candidate for GO spread and dispersion without having an effect on the quality of GO structure. Moreover, the surfaces of TiO2 nanofibers examined by SEM (Figures 4(b) and 4(c)) seem to be smooth due to the low viscosity of the solutions during the electrospinning process. After the hydrothermal process, the rGO sheets were wrapped around the surface of TiO2 nanofibers with nonuniform distribution due to the continuous sonication. The morphology of rGO-wrapped TiO2 nanofibers is displayed by TEM image, as shown in Figure 4(d). Moreover, the rough surface of rGO-wrapped TiO2 nanofibers can be observed in Figures 4(e) and 4(f). It may be due to the deformation of PVP polymer after the heat-treatment process. The diameter distributions of TiO2 and rGO-wrapped TiO2 nanofibers were analyzed from different areas of various SEM images by using ImageJ software. As shown by histogram graphs in inset of Figures 4(b) and 4(e), the diameter distributions of TiO2 and rGO-wrapped TiO2 nanofibers can be found in the range of

(a) TEM image of GO sheet. SEM images of (b) pristine TiO2 nanofiber bundle and (c) pristine TiO2 nanofiber individual with high magnification. (d) TEM image of rGO-wrapped TiO2 nanofibers. SEM images of (e) rGO-wrapped TiO2 nanofiber bundle and (f) rGO-wrapped TiO2 nanofiber individual with high magnification.

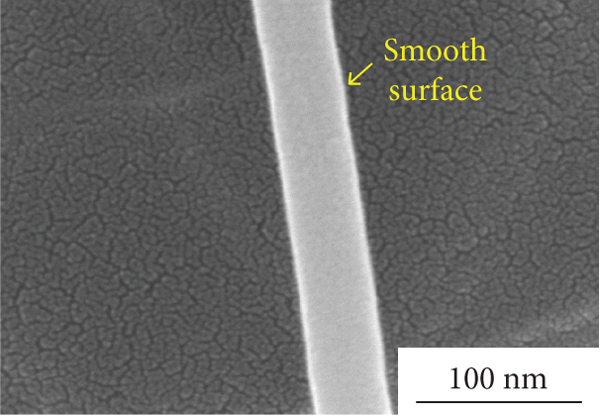


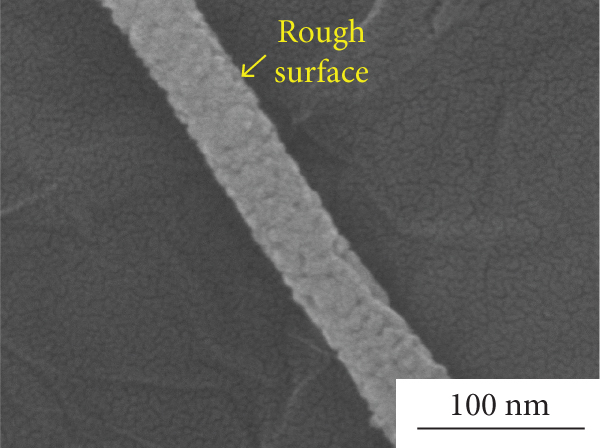
Figure 5 shows TEM image of rGO-wrapped TiO2 nanofiber and its elemental map. It provides information to support the above statement about the existence of titanium (Ti), oxygen (O), and carbon (C) elements on the surface of sample. The energy-dispersive X-ray spectroscopy (EDS) mapping affirms uniform distribution of Ti, O, and C elements for the rGO-wrapped TiO2 nanofibers, as shown in Figure 5. The atomic percentages of rGO/TiO2 nanocomposite are 58.83% (Ti), 29.94% (O), and 11.23% (C).
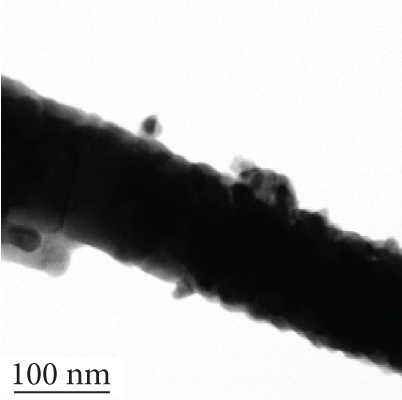
(a) TEM image of rGO-wrapped TiO2 nanofiber and its elemental map of (b) titanium, (c) oxygen, and (d) carbon.
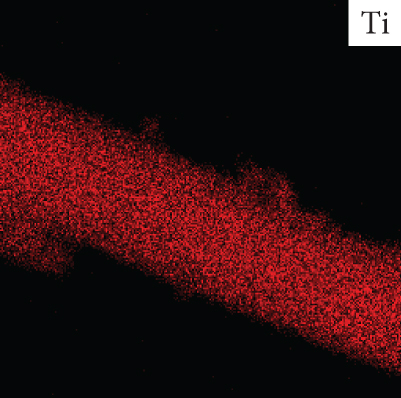


Figure 6 shows the XRD patterns of pristine TiO2 nanofibers and rGO-wrapped TiO2 nanofibers. The 2θ peaks of 25.2° (101), 37.8° (004), 48.1° (200), 55.2° (221), and 62.7° (118), according to JCPDS file number 21-1272, corresponding to the anatase TiO2 are observed (see Figure 6(a)). This pattern presents a reference in the comparison between pristine TiO2 and rGO-wrapped TiO2 nanofibers. As can be seen in Figure 6(b), the more 2θ peaks of 27° (110), 41° (111), 44° (210), and 69° (301), according to JCPDS file number 88-1175, corresponding to the rutile TiO2 can be also observed. The percentages of rutile (
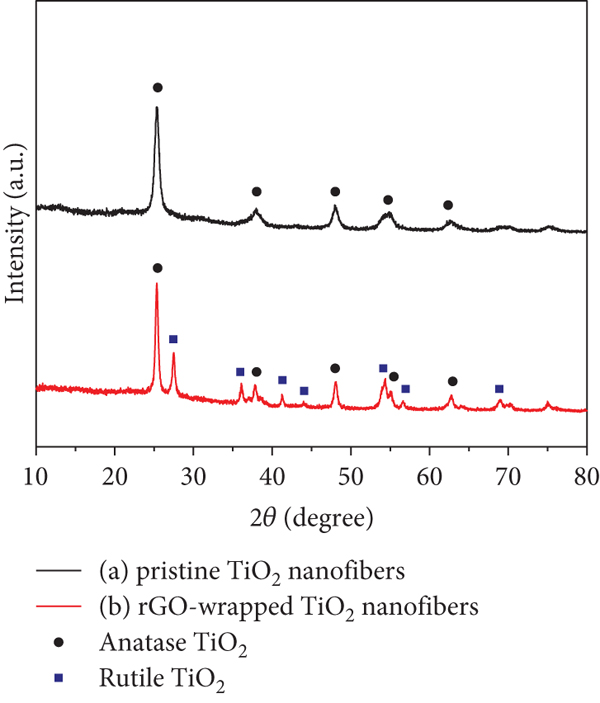
XRD patterns of (a) pristine TiO2 nanofibers and (b) rGO-wrapped TiO2 nanofibers.
It is observed that the rutile percentage of pristine TiO2 nanofibers is 0%, while the anatase percentage is 100%. For the rGO-wrapped TiO2 nanofiber sample, it contains 29.03% rutile and 70.97% anatase. Therefore, the calculated ratio between anatase and rutile phases of the rGO-wrapped TiO2 nanofibers is found to be 2.4. Furthermore, the XRD pattern of TiO2 nanofibers reveals only peaks for the anatase phase, while the XRD pattern of rGO-wrapped TiO2 nanofibers reveals different peaks for rGO, anatase, and rutile phases of TiO2. However, the diffraction peaks of rGO at 24.5° cannot be observed separately.
The existence of rGO sheets on TiO2 nanofibers was confirmed by Raman spectra, as displayed in Figure 7. It is seen in Figure 7(a) that the Raman spectrum of rGO-wrapped TiO2 nanofibers presents the four peaks of

Raman spectra of the synthesized (a) rGO-wrapped TiO2 nanofibers, (b) pure rGO sheets, and (c) TiO2 nanofibers.
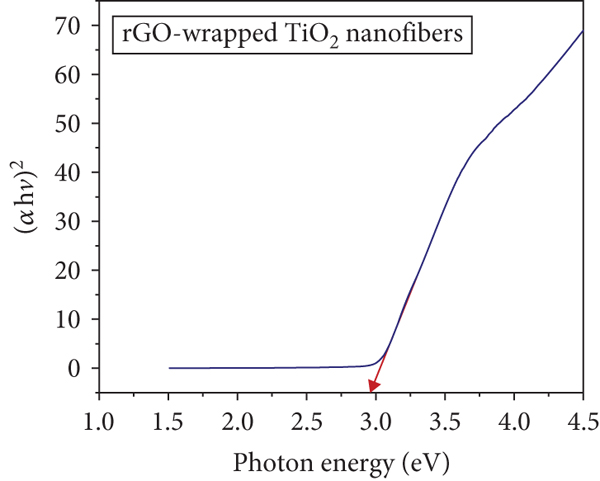
The UV-Vis spectra of the Kubelka-Munk transformed reflectance are demonstrated in Figure 8. The Tauc plots are displayed to calculate the band gap of pristine TiO2 and rGO-wrapped TiO2 nanofibers, according to the following:

Variation of
3.2. Gas-Sensing Properties
The gas-sensing properties of pristine TiO2 nanofibers, pure rGO sheets, and rGO-wrapped TiO2 nanofibers were evaluated by using the gas-measurement system. The changes in resistance of gas sensors were conducted to identify the performances of the sensors. Figure 9 shows the resistance changes of pristine TiO2 nanofiber gas sensor exposed to H2S, C2H2, H2, CH4, and CO2 with a concentration of 10, 20, 50, 70, and 100 ppm at room temperature. It can be seen that the baseline resistance of pristine TiO2 nanofiber gas sensor falls within the order of high resistance (MΩ). Moreover, the sensor resistances do not change obviously under all gases. Therefore, the pristine TiO2 nanofiber gas sensor does not response or low response to all gases at room temperature. These results are consistent with the previous publications [41, 49, 50].

Resistance changes of pristine TiO2 nanofiber gas sensor exposed to various gases with different concentrations at room temperature.
Since the response of pristine TiO2 nanofiber gas sensor for H2S sensing is very low at room temperature, only the results of rGO and rGO-wrapped TiO2 nanofiber gas sensors will be more reported. The changes in resistance of rGO-wrapped TiO2 nanofiber and rGO gas sensors upon exposure to H2S with different concentrations from 10 to 100 ppm at room temperature are shown in Figures 10(a) and 10(b), respectively. It can be seen that the rGO-wrapped TiO2 nanofiber gas sensor shows a high response to H2S, while the response of rGO gas sensor is very low. In addition, both gas sensors exhibit increments of resistance upon exposure to H2S before recovering to their baseline lines in dry air. This represents the p-type semiconductor behaviour to a reducing gas. The calculation of gas response is defined by
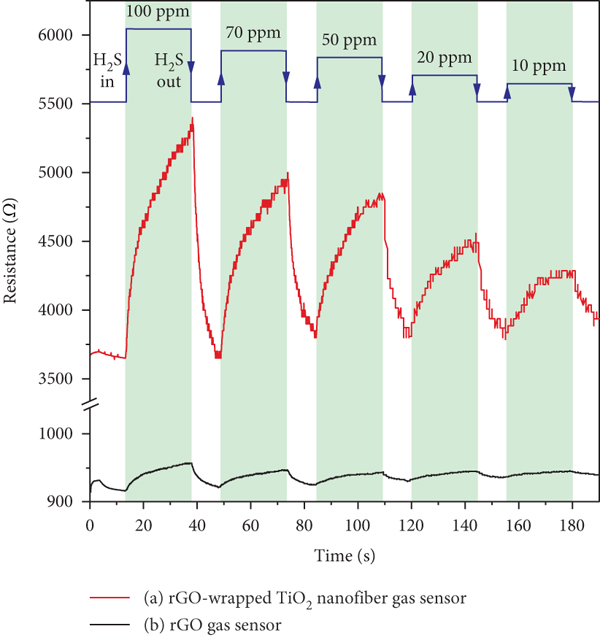
Resistance changes of (a) rGO-wrapped TiO2 nanofiber and (b) rGO gas sensors exposed to H2S with various concentrations at room temperature.
The sensitivity was defined by the slope of linear graph in the relation of gas response versus gas concentration [51–53]. Figure 11(a) shows linear graphs of gas response as a function of H2S concentration for the rGO-wrapped TiO2 nanofiber and rGO gas sensors. It can be found that the calculated values of slopes for rGO-wrapped TiO2 nanofiber and rGO gas sensors are 0.341 and 0.029 ppm-1, respectively. The coefficients of determination (

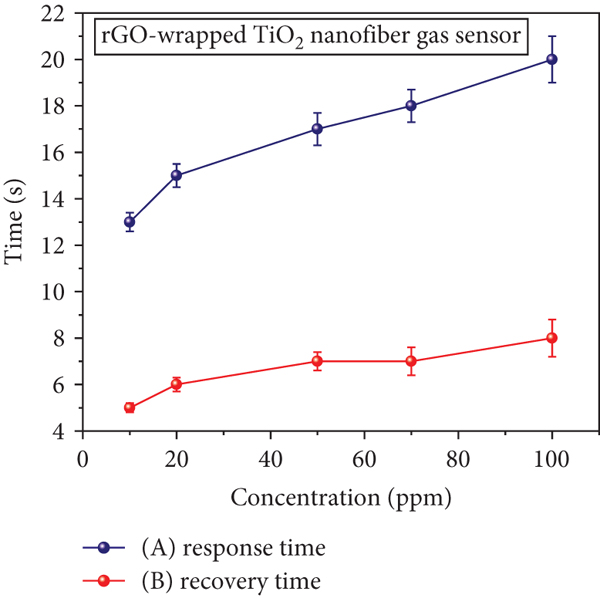
(a) Gas responses of rGO-wrapped TiO2 nanofiber and rGO gas sensors and (b) response/recovery times of rGO-wrapped TiO2 nanofiber gas sensor as a function of H2S concentration at room temperature.
The changes in resistance of rGO-wrapped TiO2 nanofiber sensors upon exposure to H2S with concentrations of 70 and 10 ppm are displayed in Figures 12(a) and 12(b), respectively. It can be seen that the resistance of sensor exposed to 70 ppm H2S could not return back to its baseline resistance. This is due to the fact that the H2S molecules with high concentration cannot fully purge off from the sensor surface by the air under ambient condition. This cause leads to the drift of baseline resistance for the gas sensor after testing in every cycle. For the rGO-wrapped TiO2 nanofiber sensor under 10 ppm H2S, it can be observed that the resistance of sensor immediately decreases and nearly recovers to its baseline resistance over 4 cycles. This is due to the almost complete desorption of H2S molecules after the purging process.
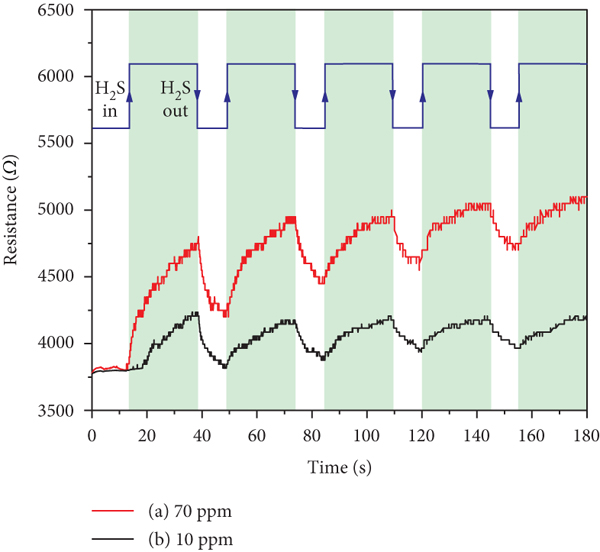
Resistance changes of rGO-wrapped TiO2 nanofiber gas sensor exposed to H2S with concentrations of (a) 70 ppm and (b) 10 ppm at room temperature.
As can be found from the preliminary results, the thickness of rGO wrapped around the TiO2 nanofibers is dependent on the GO content. The SEM image of rGO-wrapped TiO2 nanofiber prepared by 100 mg of GO powder is shown in Figure 13(a). It is clearly seen that there are some thick rGO sheets around the TiO2 nanofiber. The nearby rGO sheets could be merged and formed into larger sheets under a condition of high GO content. Moreover, we have already investigated the effect of GO content on the H2S response of rGO-wrapped TiO2 nanofiber gas sensor at room temperature. It should be noted that the GO powder was dissolved in 20 ml DMSO and 20 ml DI water followed by the addition of 70 mg TiO2 nanofibers before the rGO-wrapped TiO2 nanofibers were formed by hydrothermal process. As shown in Figure 13(b), the values of H2S response for the sensor under different GO contents of 20, 50, 75, and 100 mg are found to be 22.4, 44.6, 10.2, and 7.9%, respectively. These results show that the optimal content of GO powder for wrapping the rGO around the TiO2 nanofiber to obtain an effective room-temperature H2S gas sensor is 50 mg. In the case of rGO-wrapped TiO2 nanofiber gas sensor with high content of GO (75 and 100 mg), the response of sensor is low because the number of charge carriers in rGO-wrapped TiO2 nanofibers is much higher than the charge transfer. This explanation is consistent with a previous work of another group. They have reported about the low response of three-dimensional graphene-carbon nanotube nanostructures to toluene under the condition of high carbon content [54].
(a) SEM image of rGO-wrapped TiO2 nanofiber prepared by 100 mg of GO powder. (b) Gas responses of rGO-wrapped TiO2 nanofiber gas sensor as a function of prepared GO content.

The generated p-n heterojunctions of nanocomposite materials have been affirmed by baseline resistance of gas sensor [54, 55]. For the n-type semiconducting TiO2 gas sensor, it is well known that electrons are the most common type of charge carrier. The decrease in baseline resistance of n-type metal oxide and p-type carbon materials can be attributed to the increased electron concentration due to the formation of p-n heterojunctions. In this work, the baseline resistance of pristine TiO2 nanofiber gas sensor falls within ~2.5 MΩ while the baseline resistance of rGO-wrapped TiO2 nanofiber is found to be ~3.7 kΩ. This could be affirmed to the formation of p-n heterojunctions between TiO2 nanofibers and rGO sheets.
Figure 14 shows the selectivity histogram of rGO-wrapped TiO2 nanofiber and rGO gas sensors toward different gases, including 100 ppm H2S, 500 ppm C2H2, 500 ppm H2, 1000 ppm CH4, and 1000 ppm CO2 at room temperature. It is seen that the rGO-wrapped TiO2 nanofiber gas sensor exhibits a high response to H2S and low responses to C2H2, H2, CH4, and CO2, while the rGO gas sensor shows the low responses to all gases. It is well known that the gas response of sensor increases with increasing gas concentration. Although the concentrations of the C2H2, H2, CH4, and CO2 are added more to over 500 ppm, the very low responses to the gases for the both sensors are still observed. These results confirm the good selectivity of rGO-wrapped TiO2 nanofiber gas sensor to H2S at room temperature.

Selectivity histogram of rGO-wrapped TiO2 nanofiber and rGO gas sensors exposed to various gases with different concentrations at room temperature.
The H2S-sensing measurement of rGO-wrapped TiO2 nanofiber gas sensor was further repeated for 70 days, as shown in Figure 15. The long-term stability with only ∼5% of reduction from its initial response under room-temperature storage indicates that the gas responses are almost stable under ambient conditions. Moreover, the H2S-sensing performance of the room-temperature rGO-wrapped TiO2 nanofiber gas sensor in this work is superior to previous works, as listed in Table 1. Although there have been some works revealing the sensor performance in higher H2S response, the high operation temperature of them is still an obstacle [41, 56].
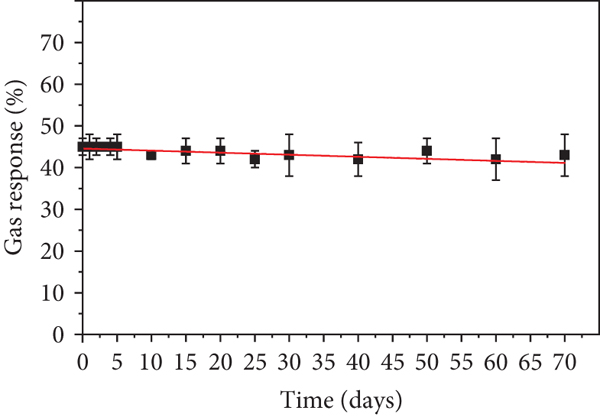
Long-term stability measurement of rGO-wrapped TiO2 nanofiber gas sensor in a period of 70 days upon repetitive exposure to 100 ppm H2S at room temperature.
Comparison of H2S gas sensors from previous works and this work.
The H2S-sensing mechanisms of rGO-wrapped TiO2 nanofiber gas sensor have been discussed based on two possible mechanisms such as the formation of p-n heterojunctions and the direct charge-transfer process. The free electrons in rGO regions will transfer to TiO2 nanofibers when the heterojunctions are formed. This cause results in a depletion of electrons on the rGO surfaces [37]. It leads to the bending of energy band in n-type semiconducting TiO2 nanofiber, causing an increase of baseline resistance from ~0.93 kΩ to ~3.54 kΩ after wrapping the rGO on the TiO2 nanostructures (see Figure 10). In air, the chemisorbed oxygen groups will trap free electrons from the conduction band of TiO2 and the Fermi level of rGO, according to the reaction

(a) Schematic illustration of H2S-sensing mechanism and (b) p-n heterojunction of rGO-wrapped TiO2 nanofiber gas sensor.

where
For the second possible mechanism, the rGO-wrapped TiO2 nanofiber gas sensor is exposed to lower concentration of H2S (10 ppm). It has been discussed based on the direct charge-transfer process between H2S molecules and rGO-wrapped TiO2 nanofiber surfaces by physisorption. The Van der Waals interaction has been considered as a dominant action in the presentation of this possible mechanism. The increments in the active areas and π-π interactions can be improved by the wrapping of rGO sheets around TiO2 nanofibers. When the H2S molecules are adsorbed onto active areas of rGO-wrapped TiO2 nanofiber, the holes of rGO-wrapped TiO2 nanofiber will react to free electrons from H2S molecules. Then, the resistance of the p-type semiconducting rGO-wrapped TiO2 nanofiber gas sensor increases. Moreover, the H2S molecules can be easily purged under dry air at room temperature due to the weak interactions of physisorption. This cause may lead to the near complete recovery of the baseline resistance for the gas sensor under lower concentration of H2S (10 ppm).
4. Conclusions
The rGO-wrapped TiO2 nanofibers were successfully synthesized by the combination of electrospinning and hydrothermal methods. The confirmation of existence for rGO sheets on the surface of TiO2 nanofibers was characterized by SEM, TEM, XRD, and Raman spectroscopy. The UV-Vis spectra were employed to investigate the band gaps of nanofibers before and after wrapping the rGO sheets on the surface of TiO2 nanofibers. The nanofibers were evaluated for H2S adsorption at room temperature. As the results, the rGO-wrapped TiO2 nanofiber gas sensor presented a p-type semiconducting behaviour and good response upon exposure to H2S at room temperature. The hydrothermal wrapping of rGO sheets around the TiO2 nanofibers with an optimal GO content of 50 mg led to the optimal enhancement of H2S response at room temperature. Moreover, the rGO-wrapped TiO2 nanofiber gas sensor exhibited a good selectivity and long-term stability toward H2S as well. The H2S-sensing mechanism of rGO-wrapped TiO2 nanofibers gas sensor was proposed based on the formation of p-n heterojunctions of p-type rGO sheets and n-type TiO2 nanofibers. Finally, the direct charge-transfer process between H2S molecules and rGO-wrapped TiO2 nanofiber surfaces by physisorption was mentioned as a second possible H2S-sensing mechanism. All the results proved that the rGO-wrapped TiO2 nanofibers can be considered as a good selection for applications in H2S adsorption at room temperature.
Footnotes
Data Availability
The data used to support the findings of this study are available from the corresponding author upon request.
Conflicts of Interest
The authors declare that there is no conflict of interests regarding the publication of this paper.
Acknowledgments
The authors would like to thank for gas measurements and facilities provided by Dr. Anurat Wisitsoraat from Carbon-based Devices and Nanoelectronics Laboratory, National Electronics and Computer Technology Center, Thailand. This work was financially supported by the Research and Development Institute, Rajamangala University of Technology Krungthep, Thailand (Grant No. ST-1045).