
Abstract
Due to the widespread production of maize, the waste created by this crop has become
a serious concern. This study applied the concept of waste circulation to the
production of magnetic biochar from corn husk waste to remediate
paraquat-contaminated water. Magnetic biochar (MB) was produced by impregnating maize
husks with iron and carbonizing the residue in a nitrogen environment. Carbonized MB
at the temperature of 850°C (MB-01-850) exhibited a combination of microporous and
mesoporous structures (
1. Introduction
The increase in agricultural waste has been a serious concern over the last few decades, with maize being one of the most produced crops in the world. Significant by-products of maize production, including cobs, stems, leaves, and husks, are produced during harvest. Unfortunately, the combustion of these agricultural wastes releases several air pollutants, such as solid greenhouse gases, and suspended particulate matter, such as PM2.5 and PM10. These poisons have been shown to be harmful to human health and the environment [1]. Therefore, the development and implementation of sustainable disposal options for agricultural waste are essential to reduce this problem. The cellulose, hemicellulose, and lignin of maize husk may be utilized to produce biochar, a porous carbon substance. Biochar is widely utilized in environmental applications due to its distinct characteristics, ecological compatibility, cost-effectiveness, and robustness in both mechanical and thermal aspects [2, 3]. In particular, it effectively removes pollutants from wastewater by acting as an adsorbent. It is important to note that biochar serves as an adsorbent for removing pollutants from wastewater. However, unmodified biochar has limitations in water treatment applications because of its low adsorption capacity, inadequate selectivity, limited reusability, and challenges in regeneration [4]. Consequently, modification of biochar is imperative to enhance its adsorption capacity and practical efficacy. Several methods have been used to modify the properties of biochar, with physical and chemical modifications being the most common ones.
Physical modification involves subjecting biochar to high-temperature steam and gas, which effectively increases its surface area by modifying its pore structure, whereas chemical modification [5] represents the predominant technique. These include acid modification [6, 7], alkalinity modification [8], modification using metal salts or oxidizing agents [9], and modification with carbonaceous materials such as graphene and carbon nanotubes [10].
Moreover, unmodified biochar with a fine particle size poses challenges in terms of separation from aqueous solutions after the adsorption process. This difficulty hampers its reusability and transforms it into a secondary pollutant. Therefore, modifying the magnetic properties of biochar is highly desirable because it enables efficient separation from aqueous solutions in the presence of an external magnetic field. This characteristic significantly facilitates the separation and regeneration processes. Magnetic biochar can be produced through various techniques, including impregnation-pyrolysis, coprecipitation, reductive codeposition, and hydrothermal carbonization [11, 12]. Typically, magnetic biochar is synthesized using impregnation-pyrolysis processes with activators, such as iron chloride (FeCl3) [13] or iron sulfate heptahydrate (FeSO4·7H2O) [14]. Several studies have shown that impregnating Fe(NO3)3 onto biomass not only enhances its magnetic properties but also induces a mesoporous structure in the adsorbent material [15, 16], making it particularly suitable for water treatment applications.
Intensive seasonal farming, especially maize cultivation, generates a substantial amount of wastewater that becomes contaminated with pesticides or herbicides. Unfortunately, these contaminants can potentially infiltrate groundwater and surface water sources, thereby posing a significant environmental risk. In line with the principles of waste cycling and pollutant elimination, the use of biochar derived from corn waste has emerged as an ideal solution to address the problem of pesticide or herbicide removal from contaminated wastewater. This sustainable approach not only effectively addresses the issue of pollutant removal but also maximizes the utilization of agricultural waste materials. When corn waste is utilized in biochar as an adsorbent, harmful pesticides or herbicides can be efficiently captured and removed from wastewater, thereby reducing the risk of further water pollution. This approach not only offers a solution to the environmental challenges posed by intensive farming practices but also promotes the circular economy by transforming agricultural waste into a valuable resource for water treatment.
Paraquat is a highly toxic herbicide used worldwide to control weeds in agricultural and nonagricultural settings. Paraquat (PQ; 1,1-dimethyl-4,4-bipyridyl dichloride) or methyl viologen is a nonselective contact herbicide used to control broadleaf weeds and grasses by inhibiting photosynthesis and destroying plant organelles [17]. It is now known to be harmful to both humans and animals. Furthermore, it may be an environmental factor in neurodegenerative diseases such as Parkinson’s disease [18, 19]. In particular, PQ exhibits considerable water solubility (620 g/L at 25°C) in the environment [20], thereby raising the potential risk of contamination from water sources. Consequently, these contaminants significantly affect aquatic ecosystems and human health. Additionally, it forms strong bonds with the soil particles, resulting in long-lasting bonds. [21]. In Thailand, PQ concentrations are 1.5 to 18.9 μg/L for groundwater and 9.3 to 87.0 μg/L for surface water [22]. European standards require that the concentration of PQ in water sources be no more than 0.1 μg/L for drinking water and 1-3 μg/L for surface water [23]. These values suggest that PQ residues in water threaten human health and the environment, especially during the rainy season. Given the health and environmental risks associated with PQ use, many countries have restricted or banned its use. However, paraquat is still widely used in some parts of the world due to its effectiveness and low cost [24]. Thus, removal of PQ from contaminated water sources is a challenging and attractive task.
Several techniques, such as ozonation [25], photocatalytic processes, Fenton reactions [25, 26], and adsorption, have been applied to remove contaminated PQ from water sources. Among the many techniques, adsorption is one of the best methods for treating wastewater, with high efficiency, low cost, ease of operation, and absence of hazardous by-product formation [27, 28]. Various adsorbents have been used for wastewater treatment, including natural adsorbents [29, 30], activated carbon [31], carbon-based materials (carbon nanotubes), and biochar. The prevalence of biochar derived from agricultural residues has significantly increased in recent years. This increased recognition is primarily attributed to its effectiveness in addressing environmental problems and suitability as an adsorbent to remove pollution.
This study is aimed at developing an affordable adsorbent material derived from agricultural waste to treat water sources contaminated with PQ. To achieve this objective, we used corn husks as the carbon precursor and synthesized magnetic biochar materials by impregnating corn husks with Fe(NO3)3 followed by carbonization under a nitrogen atmosphere. The resulting biochars were used as adsorbents to remove PQ from aqueous solutions. Our research focused on investigating the influence of Fe(NO3)3 on the properties of the adsorbent and understanding the underlying mechanism of paraquat (PQ) adsorption using magnetic biochar under both synthetic water (DI water) and natural water conditions. In addition, a study on the regeneration of magnetic biochar was conducted.
2. Materials and Methods
2.1. Materials and Chemicals
Corn husks were collected from an agricultural area in Lamphun Province. After cutting into small pieces, they were washed with DI water and dried at 80°C for 24 h. Analytical standard paraquat (C12H14Cl2N2, PESTANAL) was purchased from Sigma-Aldrich. Gramoxone (C12H14Cl2N2, 37% paraquat) and iron(III) nitrate nonahydrate (Fe(NO3)3·9H2O, >99%) were purchased from Syngenta Thailand and AnalaR BDH, respectively.
2.2. Preparation of Magnetic Biochars and Biochar
To prepare the magnetic biochars, the corn husks were immersed in Fe(NO3)3 solution at 80°C for 2 h, dried at 80°C for 24 h, and carbonized in a nitrogen atmosphere at a heating rate of 10°C/min for 2 h. The preparation conditions of the samples are listed in Table 1.
Synthesis conditions of magnetic biochars and biochar derived from corn husk.
2.3. Paraquat Adsorption Experiments
The experiments were performed using a batch process. It was carried out by
contacting adsorbent dosages (0.25-3.00 g/L) with 100 mL of PQ solution with varied
initial concentrations (5-200 mg/L) and shaken at 200 rpm at 30 to 50°C until the
equilibrium time was reached. The pH range of 4 to 10 was examined at an initial PQ
concentration of 40 mg/L, and the pH levels were controlled using buffer solutions
containing acetic acid/sodium acetate and ammonium hydroxide/ammonium chloride. PQ
concentration was analyzed using an ultraviolet-visible spectrophotometer (SPECORD®
50 PLUS, Analytik Jena) at a maximum absorbance wavelength of 258 nm. The amount of
PQ at equilibrium (
The reusability of spent magnetic biochar was investigated by comparing the adsorbent with and without regeneration. The experiments were carried out at an initial concentration, adsorbent dosage, temperature, pH, and contact time of 20 mg/L, 2.0 g/L, 30°C, 7, and 24 h, respectively. The regenerated sorbent was immersed in NaOH solutions with concentrations of 0.1, 0.5, and 1.0 M for 24 h [32]. The mixture was dried and subjected to subsequent adsorption under the same conditions. This cycle was repeated multiple times, until four trial cycles were completed.
2.3.1. Adsorption Isotherm Models
The Langmuir and Freundlich models were used to describe the adsorption mechanism of PQ.
The Langmuir isotherm model [33, 34] is
expressed by
The Freundlich isotherm model [34, 35] is
determined by
2.3.2. Thermodynamic Adsorption Models
The thermodynamic parameters, including the change of standard enthalpy (
The
2.3.3. Kinetic Adsorption Models
Both pseudo-first-order (PFO) and pseudo-second-order (PSO) models were used to determine the kinetic and rate constants.
The original equation of the PFO model proposed by Lagergren [37] is represented by
Integrating Equation (9) for
The PSO model is widely used for adsorption on solid surface [39]. The original form of the
kinetic model is determined by
The integrated PSO model is described as follows [38].
The intraparticle diffusion model [40] is calculated by
2.4. Characterization
The specific surface area, micropore volume, and mesopore volume were determined
using an N2 adsorption-desorption apparatus (Autosorb MP, Quantachrome).
The surface morphology was examined using a field emission scanning electron
microscope (FE-SEM, JSM-6335F, JEOL) equipped with an energy-dispersive X-ray
spectroscopy (EDS) detector (Inca, Oxford). The crystalline phase and iron
composition were analyzed using a powder X-ray diffractometer (PXRD; D8 Advanced,
Bruker diffractometer with Cu Kα radiation,
3. Results and Discussion
3.1. Preparation of Magnetic Biochar
3.1.1. Effect of Fe(NO3)3 Concentration and Carbonization Temperature on Porosity
Figure 1(a) shows the
N2 adsorption-desorption isotherm of biochar without magnetic
properties (B-00-850). It exhibited a type I isotherm according to the IUPAC
classification, indicating the presence of a microporous structure (pore

N2 adsorption-desorption isotherm at -196°C of (a) B-00-850, MB-001-850, MB-005-850, and MB-01-850 and (b) MB-01-550, MB-01-650, MB-01-750, and MB-01-850.
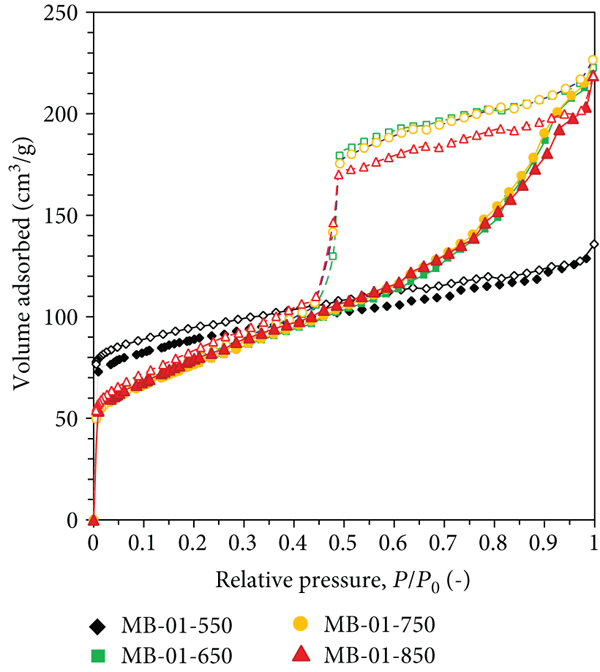
N2 adsorption-desorption isotherm at -196°C and porosity of adsorbents derived from corn husk.
Remark: N/D = not determined.
3.1.2. Effect of Fe(NO3)3 Concentration on the Thermal Properties of Corn Husk
Thermogravimetric analysis (TGA) (Figure S2 (a)) revealed that the addition of Fe(NO3)3 to the corn husk increased its thermal stability compared to that of the untreated corn husk [44]. The residual mass and %burn-off data in Table S1 reinforce this conclusion. The data indicate that the samples with more Fe(NO3)3 had a lower %burn-off and a higher residual mass. This suggests that increasing the iron content enhances thermal stability. Figure S2 (b) shows a differential thermogravimetric (DTG) curve, which demonstrates three distinct stages of weight loss. In the first stage, within the temperature range of 32–120°C, an 8.20% weight loss was observed owing to water evaporation. Subsequently, between 180 and 280°C, the thermal decomposition of glycosides, hemicellulose, and pectin units resulted in a weight loss of 32.80%. Finally, at approximately 300°C, a weight loss of approximately 40% indicated cellulose decomposition [45, 46]. A comparative analysis between activated Fe(NO3)3-treated corn husk and untreated corn husks demonstrated that the former exhibited a distinctive peak in the temperature range of 500–600°C, indicative of the presence of iron compounds. This peak confirmed the formation of iron within the samples, with varying iron concentrations resulting in the formation of iron compounds at slightly different temperatures within the 500–600°C range. Iron compounds can be described as follows: Fe3+ ions require hydrolysis to generate amorphous Fe species, including Fe(OH)3 and FeO(OH), below 350°C. Subsequently, the conversion of these amorphous Fe species to Fe2O3 was observed at temperatures below 400°C. At higher temperatures (500–700°C), further reduction of hematite (Fe2O3) to magnetite (Fe3O4) is facilitated by reducing components such as amorphous carbon and CO gas. The formation of metallic Fe was achieved by the reduction of Fe2O3 and Fe3O4 using amorphous carbon [47–49].
3.1.3. Effect of Carbonization Temperature on Crystallinity
The XRD spectra of B-00-850, MB-01-550, MB-01-650, MB-01-750, and MB-01-850 are shown in Figure 2(a). XRD spectra of MB-01-650, MB-01-750, and MB-01-850 show a sharp peak at 26.20° referring to the graphite phase (JCPDS 01-089-8487). Furthermore, B-00-850 and MB-01-550 exhibited broad peaks at 23.16°, indicating the characteristic peak of amorphous carbon. Clearly, Fe(NO3)3 carbonized at temperatures above 650°C can improve the formation of graphitic structures and other iron compounds. There were six peaks at 2θ around 37.76°, 42.94°, 43.74°, 44.59°, 48.69°, and 49.14°, including the characteristic peak of iron carbide (Fe3C) (JCPDS 00-076-1877). Additionally, the peak appears at 35.35° and 43.74°, showing the characteristic peak (Fe3O4) (JCPDS 00-019-0629). Finally, the iron metal is (Fe0) phase displayed at 45.00° (JCPDS 00-076-1877).

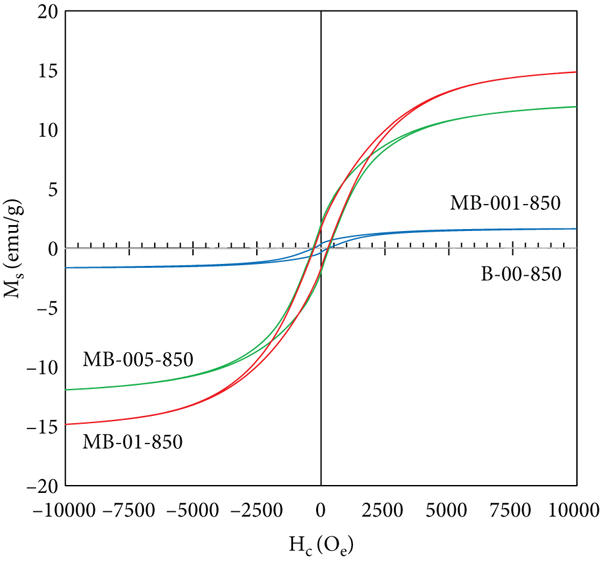
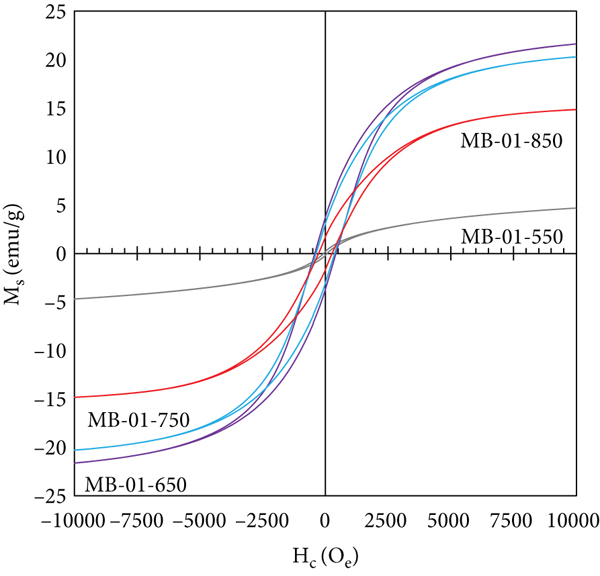
(a) XRD spectra and (b) Raman spectra of B-00-850, MB-01-550, MB-01-650, MB-01-750, and MB-01-850. Magnetization curve of (c) B-00-850, MB-001-850, MB-005-850, and MB-01-850 and (d) MB-01-550, MB-01-650, MB-01-750, and MB-01-850.

3.1.4. Effect of Carbonization Temperature on Graphitic Characteristic
The Raman spectra of B-00-850, MB-01-550, MB-01-650, MB-01-750, and MB-01-850 are
shown in Figure 2(b). All
samples show the D band and the G band at 1340 cm-1 and
1580 cm-1, respectively, which represent a characteristic feature of
graphitic materials. The D band represents local defects and disorders at the
edges, which correspond to the out-of-plane vibration of sp3 defects
[50]. The G band is
related to the vibration of sp2 hybridization in the hexagonal graphene
structure. Furthermore, the 2D and D+D
The intensity ratio of the D and G bands (
3.1.5. Magnetic Properties of Adsorbents
Figure 2(c) displays the
effect of Fe(NO3)3 concentration on the magnetization curve.
An increase in Fe(NO3)3 concentration resulted in a higher
saturation magnetization (
Magnetic properties of adsorbents.
3.1.6. Effect of Fe(NO3)3 on Morphologies and Textures
The morphologies and textures of B-00-850 and MB-01-850 are shown in Figure 3. The morphologies of B-00-850 and MB-01-850 were flakes. The textures exhibited surface roughness and spherical-like particles for B-00-850 and MB-01-850, respectively. Figure 4 shows the distribution of the chemical compositions on the surfaces of B-00-850 and MB-01-850, characterized by SEM-EDS mapping. The distributions of carbon and oxygen were uniform for B-00-850. Carbon, oxygen, and iron were uniformly distributed in MB-01-850. The atomic weight of the sample is listed in Table S2.

Morphology and surface properties of B-00-850 and MB-01-850.

SEM-EDS mapping of (a) B-00-850 and (b) MB-01-850.

3.2. Paraquat Adsorption Test
Microporous adsorbents (B-00-850) and micro-mesoporous adsorbents (MB-01-850) were investigated experimentally.
3.2.1. Effect of Adsorbent Dosage
The effect of adsorbent dosage on the removal of PQ is shown in Figure 5(a). An increase in adsorbent dosage resulted in an increase in the removal percentage (2.42% to 73.33% for B-00-850 and 13.78 to 99.99% for MB-01-850). The removal percentage of MB-01-850 was higher than that of B-00-850 for all adsorbent dosages. The experimental data confirm that mesopores are more efficient at removing PQ than micropores are. The highest removal percentage achieved at an adsorbent dosage of 2.0 g/L was found to be optimal.

(a) Effect of adsorbent dosages of B-00-850 and MB-01-850 and (b) effect of initial concentrations of B-00-850 and MB-01-850.

3.2.2. Effects of Initial Concentrations and pH
The effect of the initial concentration of PQ in the synthetic water (concentration 5–200 mg/L, pH 7, and 20 h) was studied. Figure 5(b) shows that the PQ removal percentage of MB-01-850 was greater than that of B-00-850, peaking at 99.99% and 55.42% at an initial concentration of 5 mg/L. Moreover, the removal percentage of PQ decreased when the initial concentration of PQ was insufficient due to insufficient adsorption sites.
The effect of pH on PQ adsorption of PQ was examined over a pH range of 4 to 10,
as shown in Figure 6.
Furthermore, examination of the effects of the initial pH on the adsorption
capacity of the sorbent provides insight into the influence of various
electrostatic attractions, including ion-dipole or hydrogen bonds. If
electrostatic attraction is the predominant factor driving the adsorption
mechanism, the adsorption capacity of biochar would be significantly influenced by
the pH of PQ adsorption [55, 56]. The PQ
adsorption experiments were conducted at an initial concentration, adsorbent
dosage, temperature, and contact time of 40 mg/L, 2.0 g/L, 30°C, and 24 h,
respectively. An increase in paraquat removal was observed when the pH was
increased from 4 to 5, resulting in an increase in PQ removal from 0.33% to 16.02%
and an increase in adsorption capacity (

Performance of PQ removal in an initial pH range of 4 to 10.
Additionally, a slight improvement in paraquat removal was observed as pH
increased. The investigation yielded PQ removal percentages ranging from 96.34% to
99.99% and
The observed effect of pH on the adsorption of MB-01-850 can be explained by
considering its point of zero charge (
3.2.3. Equilibrium Isotherms, Thermodynamics, and Kinetic Models
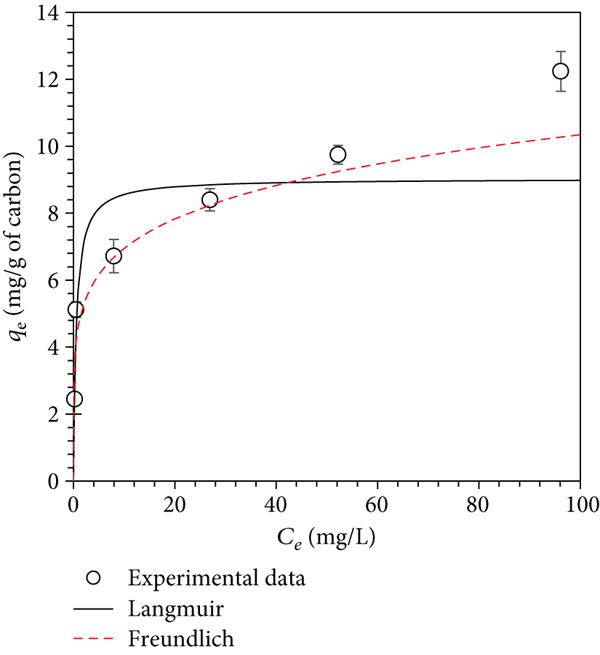
The maximum adsorption capacity (
The adsorption mechanism of PQ onto MB-01-850 was studied using equilibrium
isotherm models. The correlation coefficient (
Isotherm parameters of the Langmuir and Freundlich models and kinetic parameters of PFO and PSO for PQ adsorption on adsorbents.

The equilibrium adsorption isotherms of (a) B-00-850 at a temperature of 30°C, (b) MB-01-850 at a temperature of 30°C, (c) MB-01-850 at a temperature of 40°C, and (d) MB-01-850 at a temperature of 50°C.


In addition, the
Thermodynamic parameter for PQ adsorption on MB-01-850.
Kinetic experiments were performed at an initial concentration of 20 mg/L and
30°C. MB-01-850 reached equilibrium within approximately 20 minutes. These results
indicate that the presence of a mesoporous structure enhanced the PQ adsorption
rate. The experimental data of MB-01-850 were fitted with

(a) Adsorption kinetics of MB-01-850 at temperature of 30°C and (b) the intraparticle diffusion curve of MB-01-850.

3.2.4. Application to Natural Water
The investigation of the equilibrium adsorption of PQ in various sources, namely, synthetic water and natural water, is illustrated in Figure 9, under PQ concentrations of 5–200 mg/L, temperature of 30°C, and pH of 7. As the concentration of the PQ solution increased, a decrease in the percentage of PQ removed was observed, with values decreasing from 99.99% to 26.68% in synthetic water and from 97.74% to 22.41% in natural water. The adsorption capacities were found to be 34.97 mg/g and 31.63 mg/g for the synthetic water and natural water, respectively, as presented in Table 4. Notably, the adsorption capacity tends to decrease under natural water conditions. This decline can be attributed to the presence of organic substances, metal ions, and other contaminants in natural water, which interfered with the PQ adsorption process on MB-01-850. To support this observation, a reduction in the chemical oxygen demand (COD) value was confirmed after PQ adsorption, decreasing from 17 mg/L to 5.1 mg/L (Table S4).

(a) Removal percentage and (b) equilibrium adsorption of PQ in synthetic water and natural water on MB-01-850.

3.2.5. Reusability of MB-01-850
The reusability of MB-01-850 after several adsorption-desorption cycles is presented in Figure 10. In the absence of the regeneration process, the PQ adsorption efficiency of MB-01-850 significantly decreased. After the first cycle, the PQ of the adsorption and removal percentages decreased to 21.69% and dropped to 4.33% after four cycles. However, the regeneration process involved varying the concentrations of NaOH from 0.1 to 1.0 M. It was observed that a NaOH concentration of 0.1 M resulted in PQ removal percentages ranging from 75.13% to 51.70% after four cycles. Importantly, as the NaOH concentration increased to 0.5 and 1.0 M, a gradual improvement in desorption efficiency was observed. Throughout all four cycles, the PQ removal percentage exceeded 95.00% for NaOH concentrations in the range 0.5 to 1.0 M. The NaOH concentration increased, and the hydroxyl ions interfered with the adsorption between paraquat and the carbon surface charge. As a result, higher NaOH concentrations result in effective regeneration efficiency [71, 72].

Adsorption and regeneration performance of MB-01-850 (initial concentration, 20 mg/L; adsorbent dosage, 2.0 g/L; time, 24 h; temperature, 30°C; and pH, 7).
For MB-01-850 with and without regeneration, it was evident that the regenerated adsorbent demonstrated excellent adsorption efficiency and could be reused for up to four cycles. These observations highlight the enhanced adsorption performance and increased longevity of the regenerated adsorbent compared to those of the nonregenerated adsorbent.
3.2.6. Comparison of the Current Results with Other Adsorbents
Table 6 comprehensively
compares the maximum adsorption capacities of carbon-based and nonporous carbon
materials from various related studies [22, 23, 29–31, 59, 73–83]. When evaluating the
adsorption efficiency of MB-01-850 compared with carbon-based adsorbents, it was
observed to reach a moderate level (
Comparison of various adsorbents for removal of PQ.
Remark: NR = no report;
Additionally, compared to noncarbon materials, MB-01-850 exhibited higher
adsorption efficiency than several inorganic materials. For example, the
bentonite/mesoporous silica compound [77], humic acid-coated goethite [59], kaolin [78], and zeolite Y [82] showed
One distinguishing characteristic of MB-01-850 is its ability to be easily separated from the aqueous solution using an external magnet after adsorption, facilitating convenient reuse. Another noteworthy aspect of this research is the practical operating conditions, that is, a pH value of 7, eliminating the need for additional chemicals to adjust the pH. Furthermore, this study used agricultural waste, specifically corn husk, as a precursor material, highlighting its sustainability and ecofriendliness.
4. Conclusions
This study revealed that corn husk carbon can remove paraquat from synthetic and natural wastewater. These results suggest that the presence of Fe(NO3)3 and carbonization temperatures above 650°C caused the formation of microporous and mesoporous structures, graphitic characteristics, and iron phases. Furthermore, the experimental results demonstrated that the structure of the carbon adsorbent synthesized without Fe(NO3)3 was microporous. Furthermore, this study provided strong evidence that the mesoporous structure promoted PQ adsorption; the maximum adsorption capacity for MB-01-850 was 34.97 mg/g. In contrast, the microporous structure showed modest adsorption capacities; the highest adsorption capacity for B-00-850 was 4.08 mg/g. Based on the analysis of enthalpy change through thermodynamics and investigation of the effect of the initial pH on the adsorption capacity, the findings consistently indicate that electrostatic attraction primarily governs the adsorption process. Furthermore, this adsorbent material exhibits remarkable regenerative capability, which can be regenerated almost completely for at least four cycles using a sodium hydroxide (NaOH) solution with a concentration of 0.5 M or greater.
Footnotes
Data Availability
The data used to support the findings of this study are available from the corresponding authors upon request.
Conflicts of Interest
The authors declare that there is no conflict of interest with respect to the research, authorship, and/or publication of this article.
Authors’ Contributions
Sakonsupa Damdib was responsible for methodology, investigation, original draft preparations, and writing—review and editing. Phamornsiri Phamornpiboon and Bhawaranchat Vanichsetakul were assigned for investigation. Chanchana Thanachayanont and Patiparn Punyapalakul were responsible for supervision. Adisak Siyasukh was responsible for conceptualization, methodology, investigation, supervision, original draft preparations, and writing—review and editing. Nattaporn Tonanon was responsible for conceptualization, methodology, supervision, writing—review and editing, and funding acquisition. All authors have read and approved the final manuscript.
Acknowledgments
The authors would like to acknowledge Assistant Professor Dr. Yothin Chimupala from the Department of Industrial Chemistry, Faculty of Science, Chiang Mai University, for consulting the XRD analysis. The authors also sincerely thank the Faculty of Science, Chiang Mai University, and the Bio-Circular-Green Economy Technology and Engineering Center (BCGeTEC), Chulalongkorn University, for supporting and providing the research facilities to carry out this research work. This research project was financially supported by Ratchadapiseksompotch Fund Chulalongkorn University and Thai Graduate Institute of Science and Technology (TGIST), National Science and Technology Development Agency (SCA-CO-2561-6940-TH). This work was also partially supported by Chiang Mai University.