
Abstract
The native peels of two cheap, locally available adsorbents, watermelon (PWM) and water chestnuts (PWC), were chemically processed with different chemicals as modifying agents for the determination and assessment of their adsorption ability for the removal and clearance of harmful, venomous, and pernicious Congo red (CGR), as an acidic nature anionic dye, from the aqueous system. In successive batch experiments, the citric acid-treated peels CPWM and CPWC have shown more promising adsorption performance than their raw and untreated peel counterparts due to the availability of additional adsorption active binding sites evidenced through FT-IR and SEM characterizations. In the Langmuir and Temkin models, the correlation coefficients (
1. Introduction
Water, as a universal solvent, is able to dissolve more substances than any other liquid on earth and is unsafe and solely vulnerable to pollution. Toxic substances from agriculture, the domestic sector, and factories readily dissolve into and mix with it, which makes it more difficult for people to access safe drinking water and increases the risks of waterborne diseases. In Pakistan, gastrointestinal illness accounts for 45 percent of newborn mortality, whereas overall, 90 percent of infections are due to waterborne diseases [1–3]. The dye industry has expanded dramatically globally in recent years. As per the “Color Rankings” of the USA, commercial dyestuffs have approached tens of thousands. Every year, about
A comparison of the adsorption capacity of adsorbents with previous reported research work.
2. Materials and Methods
2.1. Chemicals and Equipment
The chemicals utilized in this investigation include organic compounds such as Congo red dye (
2.2. Preparation and Characterizations of Adsorbents
Both selected adsorbent peels of watermelon and water chestnuts were obtained locally and dried in sunlight for ten days. After that, they were ground by an electrical grinder and sieved to 70 mesh, washed with distilled water to remove entrapped dust particles as impurities, and dried in an electrical oven at 80°C for 72 hours [15–17]. These prepared peels of adsorbents were labeled “PWM” for peels of watermelon and “PWC” for peels of water chestnuts. These were stored in bulk in polythene bags for further use in experimental work. These are also characterized and evaluated by performing Boehm titration to find the adsorbent sites’ behavior (acidic or basic) [18],
Physicochemical characterizations of raw adsorbents.
To determine the bulk density of PWM and PWC, a density bottle with a lid was weighed (Wi), then filled with distilled water, and weighed again (Wf). By subtracting the (Wi) from the (Wf), the mass of water was calculated. The volume of a density bottle was calculated from Equation (1), where
For the determination of porosity, appropriate quantities of each sample PWM and PWC were weighed (
To determine the ash contents 1 gram of each PWM and PWC was placed in crucible and ignited at 500°C for three hours and then cooled and reweighed. The following equations were used to determine the percentage ash content [28, 29] and the volatile organic components, respectively [30].
To determine the iodine number of PWM and PWC, 1.35 g of iodine crystals and 2.05 g of potassium iodide were dissolved to prepare a stock solution. 0.5 g of each adsorbent, PWM and PWC, was placed in 10 mL of HCl with conc. 5%V/V in two separate Erlenmeyer flasks and stirred for 60 minutes along with the addition of iodine solution and filtered. Afterward, 10 mL of each filtrate was titrated by using 0.1 M Na2S2O3 as a standard solution, and the following equation was used to calculate the adsorbed iodine by each sample, PWM, and PWC:
Boehm titration was conducted to determine the various types of functional groups on the interfaces of both adsorbents. 0.4 gram of each PWM and PWC was placed separately in 30 mL solutions of 0.1 M HCl, 0.1 M sodium hydroxide, 0.1 M sodium carbonate, and 0.1 M sodium hydrogen carbonate, respectively, and each sample was sealed with aluminum foil and placed at 30°C for 10 hours and then filtered. For filtrates containing excess unconsumed washing soda, baking soda, or caustic soda, 10 mL of each filtrate was titrated against a standard solution of 0.1 M HCl to determine the number of carboxylic, phenolic, and lactone groups, and 0.1 M NaOH to assess the number of basic groups such as –NH2 groups on each PWM and PWC [33, 34].
Therefore, the adsorption of anionic dye molecules like Congo red dye (CGR-) is highly dependent upon the pH of the solution due to the protonation and deprotonation of COOH moieties on the interfaces of adsorbents [35, 36]. The chemical structure of Congo red dye is depicted in Figure 1 [37].

Chemical structure of Congo red dye.
2.3. Optimization of Adsorbent Performance by Processing with Various Modifying Agents
The adsorbents’ performance and efficiency were tested by using different chemicals, as depicted in Section 2.1. For this purpose, the solid phase modification is carried out by using an adsorbent/chemical ratio of 9 : 1 and is elaborated schematically below in Figure 2(a) [38].
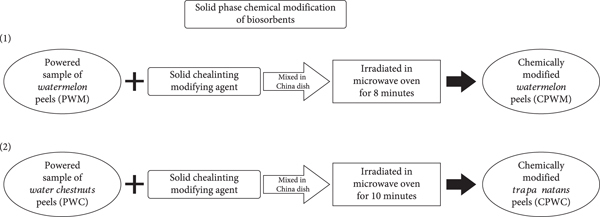
(a) Chemical modification scheme of adsorbents. (b) Illustration of chemically treated adsorbent.

The soaking of each adsorbent (50 g) in various organic solvents (200 mL) for 24 hours at room temperature was also conducted, as well as solutions of alkali and inorganic acids, which were also utilized for the chemical processing of PWM and PWC. Thus, chemically modified PWM and PWC were prepared and tested for their adsorption performance by maintaining the optimized operational conditions for CGR as the model dye in this research approach [39]. The most suitable optimized modifying agent for chemical modification of PWM and PWC was selected by performing repeated adsorption experiments. The chemically treated adsorbents were washed with distilled and deionized water to remove entrapped unreactive modifying agent and dried at 80°C in an electrical oven for twenty-four hours and sealed in plastic jars for further adsorption experimental study. The modified adsorbents were characterized by FT-IR and SEM to find the amendments to their surface morphology. Tricarboxylic organic acid-treated adsorbents have shown the highest adsorption of CGR from aqueous solution. Their schematic illustration and the evaluation after chemical treatment with citric acid are shown in Figure 2(b) [40].
2.4. Batch Experimentation on the Adsorption Mechanism
To investigate adsorption mechanism and for optimizing operational parameters, CGR removal with raw PWM and PWC was monitored. Chemically treated watermelon peels (CPWM) and water chestnut peels (CPWC) were used. Experiments on each operational parameter were carried out in four sets of Erlenmeyer flasks, with each set containing 10 to 12 flasks depending on the requirement. All the experiments were highly specific and dependent on operational conditions: adsorbent dose in ten equal divisions was utilized from 0.2 to 2.0 g, time of contact was examined from 5 to 60 minutes, with a gap of five minutes), temperature exploration in eight equal intervals between (10–80°C), impact of the initial as well as final pH between 1–10 and concentration of CGR solution, and speed of agitation (25–250 rpm) with ten equal intervals. Isothermal and kinetic modeling experiments are also performed by considering the optimized operational conditions, and the results are compared with the previous reported investigations listed in Table 1 on the adsorption of Congo red dye on different adsorbents from the aqueous environment. For further evaluation and interpretation of the validity of equilibrium data and performance of adsorption, the thermodynamic parameters like variation in enthalpy, entropy, energy of activation, and Gibbs free energy of each adsorption experiment were determined.
3. Results and Discussions
3.1. Assessment of Chemically Modified Adsorbents Using Various Modifying Agents
The performance of both chemically modified (PWM and PWC) adsorbents in terms of adsorption capability is assessed using a variety of modifying agents, as shown graphically in Figure 3.

Comparative optimization performance of chemically processed adsorbents with different modifying agents.
After a series of experiments, it was found that citric acid-treated cellulosic biomass (PWM and PWC) performed better, with the highest CGR adsorption results, and their schematically surface amendment with an increase in COOH through different associations on their surface interfaces is elaborated in Figures 2(a) and 2(b). The chemically modified peels of adsorbents (CPWM and CPWC) were prepared as described in Section 2.3 and stored in plastic jars. It was significant to note that throughout the experimentation, chemically modified adsorbents developed quick adsorption equilibrium at low pH (4-6) due to an increase in protonation on the adsorbent-interface, resulting in more electrostatic associations with anionic dye molecules [CGR
3.2. FTIR Analysis
Results of FTIR analysis for all adsorbents before and after removal of dye are presented in Figures 4–6.

Comparative FT-IR characterization of native adsorbents ((a) PWM and (b) PWC).
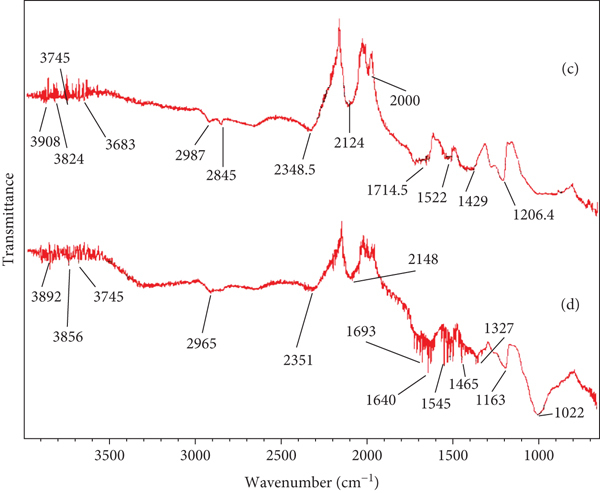
Comparative FT-IR characterization of citric acid-treated adsorbents ((c) CPWM and (d) CPWC).

Comparative FTIR analysis after adsorption of CGR on chemically modified adsorbents ((e) CGR + PWM, (f) CGR + CPWM, (g) CGR + PWC, and (h) CGR + CPWC)).
3.2.1. FT-IR Screening of Raw Adsorbents
Figures 4(a) and 4(b) illustrate the FT-IR spectra of raw and unmodified adsorbents PWM and PWC, respectively. The moieties for alcoholic functional groups (OH) are depicted in Figure 4(a) by the frequencies at 3775–3600 cm-1and 2900 cm-1 [41] and Figure 4(b) by the wavenumbers at 3685–3550 cm-1 and 3870 cm-1, respectively. The wavenumbers at 3300 cm-1 and at 1720 cm-1 in Figure 4(a) and at 3285.5 cm-1 and 1685 cm-1 in Figure 4(b) represent the OH for carboxylic acid groups, respectively. The peaks at 1720 cm-1 and at 1685 cm-1 are the signals for C=O groups for COOH moieties [42] in PWM and PWC, respectively. During the study of literature, it was observed that these groups are responsible for the electrostatic associations of the dye molecules during the adsorption mechanism [43].
3.2.2. FT-IR Assessment of Acid-Modified Adsorbents
Figures 5(c) and 5(d) elaborate FT-IR analysis of the citric acid-chelated PWM and PWC adsorbents.
The wavenumbers 3860–3720 cm-1 and 3890–3700 cm-1 correspond to the chemical interactions of citric acid molecules with OH groups via chelation on the interfaces of CPWM and CPWC, as indicated in Figures 5(c) and 5(d), respectively, providing additional adsorption active sites to interfere with CGR molecules during the adsorption process. The peaks at 3300 and 3250 cm-1 depicted OH groups for COOH moieties, while at 2915 cm-1 and 2880 cm-1 were signals for the presence OH groups of alcohols in CPWM and CPWC, respectively. The strong peaks at 1705 and 1660 cm-1 evidenced the carbonyl groups of COOH on the interfaces of CPWM and CPWC [44], which might be responsible for dye molecule affiliations due to their polarity, whereas signals at 1350 and 1325 cm-1 indicated OH (bending) for alcohols on the surfaces of CPWM and CPWC, respectively [45, 46].
3.2.3. FT-IR Analysis after Adsorption of CGR on Acid-Modified Adsorbents
Figure 6 illustrates the FT-IR evaluation after the adsorption of CGR on chemically treated adsorbents.
The frequency range at 3840-3690 cm-1 and 3900-3670 cm-1 represents hydrogen bonds between (>C=O) of carboxylic acid and (>NH2) of CGR, as well as (OH) of tricarboxylic acid and lone pairs on (NH2) of CGR, respectively [47], under the influence of the low initial pH range between 5 and 6, depicted in Figures 6(f) and 6(h) for CPWM and CPWC, respectively, whereas in Figures 6(e) and 6(g) for PWM and PWC, respectively. This has obviously shown good adsorption performance of CPWM and CPWC due to amendment of surface morphology as compared to their raw and unmodified forms. The adsorption performance of CGR was directly linked to the influence of interactions due to the protonation of COOH on the interfaces of each CPWM and CPWC. The intermolecular associations between CGR and -OH of COOH moieties are also depicted at the wavenumbers 2880 and 2820 cm-1 in Figure 6(f) and 2800 and 2700 cm-1 in Figure 6(h), respectively. Peaks at 1680 cm-1 in Figure 6(f) and 1650 cm-1 in Figure 6(h) indicate the possibility of oxime formation between (>C=O) of COOH on adsorbent surfaces and NH2 of CGR molecules from aqueous solution. As a result, the citric acid modification of both adsorbents performed more efficient and faster adsorption processes than their raw and native forms [48, 49].
3.3. SEM Analysis
Figure 7(a) represents the screening electron micrograph of native, unprocessed PWM. This includes empty spaces, relatively small, imbedded bouts of depression, and thick spiral clusters, while Figure 7(b) demonstrates its citric acid-treated modified form (CPWM), which has been transformed into flannel, flossy, blocky, wavy, and fluffy objects with varying increased numbers of adsorption binding sites for effective and quicker removal of acid dye (CGR) from aqueous solution. Figure 7(c) displays raw PWC with stuffed fibrous forms, holes, and gaps, whereas Figure 7(d) reveals amended arrangements of its citric acid-modified form (CPWC) with random cylindrical, blocky, and cone-like structural arrangements having a larger surface area. This indicates that the surface topography of PWC has indeed been altered. It is also evidenced by FT-IR characterization, resulting in the provision and promotion of additional adsorption binding sites for the adsorptive exclusion of CGR from the water system.

SEM comparison of adsorbents before and after chemical modification as well as dye loading ((a) PWM, (b) CPWM, (c) PWC, (d) CPWC, (e) CGR+ CPWM, and (f) CGR + CPWC).


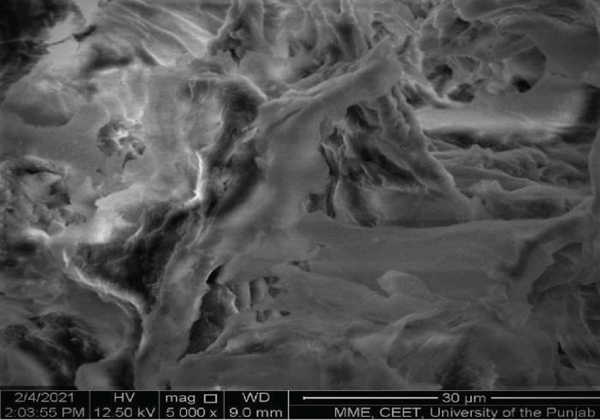
Figure 7(e) represents the SEM micrograph after the adsorption of CGR on CPWM. It is obviously different morphologically from the CPWM due to its appearance as threadlike, zigzag, highly wavy, fibroid, stringy, and tough, reflecting the good and more percentage adsorption of CGR. Figure 7(f) depicts SEM images of CPWC after CGR adsorption, with a texture resembling thick, coriaceous, tough, cloggy, disk-like, hardened, and manifold, indicating more dye adsorption.
3.4. Optimization of Operating Factors
Operational parameters for the assessment of adsorption efficiency of CGR on each PWM, PWC, CPWM, and CPWC were optimized experimentally as under.
3.4.1. Optimization of Biosorbents Dosage
Biosorbent dosage has a significant impact on the efficiency of the adsorption mechanism. The experiments were conducted in four sets of 250-mL Erlenmeyer flasks, and each set included ten flasks containing 25 ppm CGR with a volume of 25 mL.
The biosorbent dosage range of 0.2-2 g was studied with a difference of 0.2 g for each PWM, CPWM, PWC, and CPWC at 40°C, initial pH 4, and 125 rpm agitation speed. The maximal adsorptive removal rate of acid dye was established experimentally as follows: 71.4% removal of CGR on 0.8 g of PWM and 95% removal of CGR on 0.8 g of its acid-treated form, CPWM, whereas 75.7% eradication of CGR on 0.8 g of PWC and 95% on 1.0 g of CPWC illustrated in Figure 8. The decrease in adsorption performance with an increase in adsorbent dosage is due to the rapid establishment of equilibrium between CGR and at the interfaces of each adsorbent due to the many unoccupied adsorption sites as depicted in Figure 8 [50]. The optimized 0.8 g adsorbent dosage for each adsorption case was selected in this investigation.

Optimization of biosorbents dosage.
3.4.2. Optimization of Contact Time Duration
The effectiveness of the adsorption process is equivalent to the number of accessible binding sites on the interfaces of each PWM, CPWM, PWC, and CPWC.
Figure 9 reveals the determination of 84.3% adsorptive elimination of CGR on PWM at 30 minutes and 95% on its acid modification and CPWM at 25 minutes, whereas 75.7% on PWC at 40 minutes and 97.2% on CPWC at 20 minutes after batch mode experiments. The experiments were conducted by using 25 ppm solutions with a volume of 25 mL on 0.8 g of each adsorbent at 40°C, 125 rpm, and an initial pH of 4. Adsorption declines with time by the unit mass of each adsorbent after a specific frequency owing to equilibrium, leaving numerous empty adsorption binding sites unoccupied [51], as shown in Figure 9.

Optimization of contact time.
3.4.3. Agitation Rate Optimization
Another important operational parameter that controlled the adsorption rate for the elimination of CGR from water on PWM, CPWM, PWC, and CPWC was the agitation rate (rpm). This factor was investigated at speeds ranging from 25 to 200 rpm, with a 25 rpm variation at 40°C temperature, and an initial pH of 4 on 0.8 g of each adsorbent dosage.
Figure 10 displays the biosorption removal of CGR as follows: 73.5% on PWM at 125 rpm and 97.2% on its citric acid-modified form CPWM at 125 rpm, whereas 75.7% on native PWC at 125 rpm and 92.9% on its amended formulation at CPWC at 125 rpm, indicating the effective adsorption performance of chemically treated adsorbents as compared to their untreated forms. During the experiments, it was found that fast agitation speeds generated a thin layer of CGR molecules from the bulk on the surface interface of each adsorbent, which directly decreased the adsorption performance and increased the desorption of CGR [32]. The decrease in percentage adsorption of CGR at high agitation speeds of 125 rpm on CPWM and CPWC and 150 rpm on unmodified adsorbents PWM and PWC is also due to the fast and increased number of collisions of dye molecules on the adsorbent surfaces. The resulting repulsive forces become more operative and significant between free anionic [CGR

Optimization of agitation rate.
3.4.4. Optimization of Temperature for Adsorption Mechanism
Kinetic energy is directly linked with the variation of temperature of the CGR solution and ultimately influences the thermodynamic parameters, resulting in adsorption performance of biosorbents. The biosorption performance was investigated for a temperature range of 10–80°C with a difference of 10°C for 25 ppm CGR solution with a volume of 25 mL on 0.8 g of each biosorbent at 125 rpm and at initial pH 5. A temperature-controlled water bath was employed to keep the temperature stable during the experiment. This experiment was carried out to better understand the physical changes that occur on adsorbents when temperatures rise. To prevent evaporation, the experimental flasks were sealed with Al-foil. The experiment was carried out to better understand the physical changes that occur on adsorbents when temperatures rise.
Figure 11 graphically represents the biosorption results, which are as follows: PWM eliminated 75.7% of CGR at 40°C, and its acid-modified form, CPWM, eliminated 95% of CGR at 30°C, whereas PWC and its acid modification, CPWC, eliminated 80 and 92.9% of CGR, respectively, at 40°C. The adsorption performance decreases after 40°C in each of the cases which can be analyzed in Figure 11. This might be due to devastation, decimation, and disintegration of the structure lignocellulosic biomass of each adsorbent [53]. This behavior can be analyzed for PWM at 60°C which has been shown to have an 80% eradication of CGR, and for PWC, which has shown a decrease in adsorption at 40 to 50°C from 80% to 73.5%, with an afterward increase in adsorption to 80% again at 50 to 60°C. As a result, a temperature of 40°C was determined to be optimal for future adsorption experiments.

Optimization the effect of temperature.
3.4.5. Optimization of pH for Adsorption Performance
The adsorption process is specifically correlated to the initial pH of the dye solution [54]. The biosorption potential was examined for a pH range of 1–10, for a 25 ppm CGR solution with a volume of 25 mL on 0.8 g of each biosorbent at optimal temperature, contacting duration, and agitation speed. 0.1 molar of each NaOH or HCl solution was used to regulate pH during the adsorption experiments. Low pH favored protonation at the interface surfaces of each adsorbent PWM, PWC, CPWM, and CPWC, resulting in anions [CGR-] flowing quickly towards adsorbents, overcoming repulsive forces [55, 56].
The amino groups of CGR get chelated with the COOH moieties on the adsorbent surfaces. During batch experiments, it was discovered that at pH 4-6, the adsorption of CGR molecules was quick and promising, but that with a unit one increase in pH 6-10, the results were unfavorable, which could be due to an increase in deprotonation of COOH moieties on adsorbents providing anionic binding sites, resulting in an increase in repulsion against [CGR-] ions in the aqueous system. Figure 12 illustrates graphically the maximum adsorption elimination of CGR on PWM 82% at pH = 4, on CPWM 95% at pH = 4, on PWC 75.7% at pH 4, and on CPWC 93% at pH 4. As a result, the optimal pH value 4 was chosen for future investigations.

The impact of initial pH on adsorption performance.
3.5. Adsorption Isothermal and Kinetics Investigations
The adsorption of CGR on modified and unmodified adsorbents was investigated by applying Langmuir, Freundlich, and Temkin as well as kinetics models of equilibrium under optimized operational conditions as follows: adsorbent dosage of 0.8 g, initial pH of 4, and 25 ppm CGR solutions with a volume of 100 mL at 40°C and 125 rpm shaking speed.
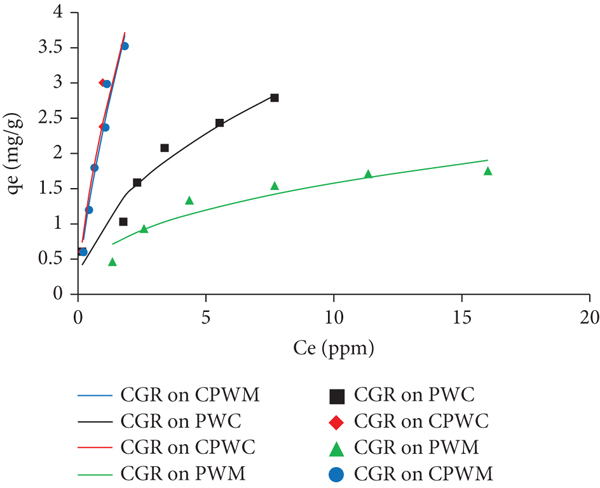
3.5.1. Interpretation of the Langmuir Adsorption Model
A nonlinear Langmuir isothermal plot (

Nonlinear Langmuir isothermal investigation.
A comparative nonlinear isothermal studies for the adsorptive removal of CGR.
The adsorption capacity and percentage removal (
These statistics and findings relate to monolayer homogenous adsorption due to a set number of equivalent binding adsorption sites spread on adsorbents surfaces. The standard deviations for PWM, CPWM, PWC, and CPWC are 0.46, 1.003, 0.765, and 1.011, respectively, and are expressed in Figure 14.
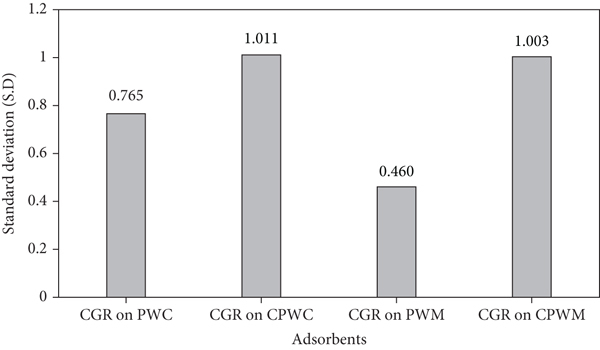
Study of standard deviations.
3.5.2. Interpretation of the Freundlich Isotherm
The nonlinear form of Freundlich isotherm is shown in Equation (11) and is graphically represented in Figure 15. This isothermal model correlates with the surface heterogeneity and potency of biomass towards adsorption of CGR from aqueous solutions [60, 61].
Nonlinear Freundlich isothermal investigation.
3.5.3. Interpretation of the Temkin Isotherm
The heat of adsorption (
The Temkin constants

Nonlinear Temkin isothermal investigation.
Heat of adsorption (
3.5.4. Adsorption Kinetic Investigation
(1) Pseudo First Order. Lagergren nonlinear equation of pseudo first order is displayed in Equation (13), while its graphical plot is shown in Figure 17 [68, 69], and the significant parameters are listed in Table 4.

Nonlinear pseudo first-order kinetic study.
Nonlinear comparative study of kinetic parameters for detoxification of CGR.
Figure 16 graphically exhibits a nonlinear plot between (
(2) Pseudo Second Order. Nonlinear relation of pseudo second order proposed by HO and McKay is depicted in the equation as follows [71, 72] and graphically in Figure 18. The effective parameters are tabulated in Table 4.

Nonlinear pseudo second-order kinetic study.
The calculated equilibrium adsorption capacity (
To assess the validity of equilibrium data, the root mean square errors for all cases of CGR adsorptive removal are determined using Equation (15) [74], and the percent relative deviation (
3.6. Adsorption Thermodynamic Investigations
Nonlinear graphical representation of thermodynamic parameters such as enthalpy change, entropy change, Gibbs free energy, and activation energy was also investigated during experiments to authenticate and validate equilibrium data [77]. Temperature changes correlate with the diffusion, kinetic energy, and angular velocity of CGR in the aqueous phase. This property influences the efficiency of the adsorbents for the adsorption removal mechanism of Congo red dye molecules because of the pervious and rubbery, squishy, and porous surface of hemicellulose and adsorbent peels. The statistical results of the calculated thermodynamic parameters
Nonlinear comparative study of thermodynamic parameters.

Nonlinear adsorption thermodynamic approach.
The Gibbs free energy calculated from Equation (17) [53], for the adsorption of CGR on chemically modified adsorbents CPWM (-13.7, -6.67, and -4.95 kJmol-1) and CPWC (-8.95, -5.9, and -4.5 kJmol-1), as compared to their unmodified forms, PWM (-7.4, -5.3, and -4.1 kJmol-1) and PWC (-6.5, -4.8, and -3.7 kJmol-1) at 298, 308, and 318 kelvin temperatures, respectively, suggests that the process is spontaneous in standard conditions. [67].
The distribution coefficient (
3.7. Adsorption Mechanism
Various new additionally provided functional groups including, -OH, –COOH, >C=O, NH2 on the surfaces interfaces of chemically modified adsorbents have been contributed a vital and central role in the adsorptive eradication of CGR from aqueous solutions [82, 83]. CGR, being an acidic as well as an anionic dye, was repelled by the anionic adsorption sites on adsorbents relatively at the high initial pH of the solutions. Protonation of adsorbents at pH 4-5 favors and influences the anionic molecules [CGR

Schematic mechanism of adsorption for CGR ((a) adsorption on untreated adsorbents and (b) adsorption on citric acid-treated adsorbents).

After the assessment and evaluation of numerous experimental results, it was concluded that the adsorption mechanism is primarily linked with both chemisorption and physio-sorption. Chemisorption is associated with chelation reactions between the amino groups (NH2) of CGR molecules and excessive as well as additionally provided carboxylic acid groups (COOH) to citric acid-treated adsorbents [84], whereas physio-sorption is linked with electrostatic interactions such as hydrogen bonding between >C=O of carboxylic acid moieties on adsorbents and partially positively charged hydrogen atoms (H-N-H) of CGR in aqueous solutions [85], as illustrated in the proposed mechanism in Figure 20.
3.8. Desorption
Desorption of CGR from exhausted adsorbents was conducted by using different eluents which have capability to break the adsorbate-adsorbent interactions for their further use and to assess the change in their adsorption performance. The most appropriate and promising desorbing agent, 0.1 M NaOH, has been used for CGR desorption from the used adsorbents [86], whereas the high concentration has been avoided because it could damage and degrade the alignment and crystalline structure of cellulosic biomasses, causing a drop in their adsorption performance [87]. The maximum desorption CGR recorded in this investigation was 87% for CPWM, 85% for CPWC, 80% for PWM, and 75% for PWC.
Figure 21 shows that the adsorptive performance of adsorbents decreased with an increase in the number of cycles for each adsorbent. Desorption of [CGR-] anions was greatly increased by the deprotonation of adsorbents in the pH range of 4–12, due to repulsion towards negatively binding sites of adsorbents by an ion exchange mechanism. The desorption capacity of both adsorbents and the percentage desorption of CGR were calculated from the following equations:

Study of comparative recycling of adsorbents for the degradation of CGR.
4. Conclusion
The peels of watermelon (PWM) and water Chestnuts (PWC) were dried, sieved, and chemically modified with citric acid containing tricarboxylic groups for the adsorption eradication of harmful, venomous, unfriendly, lethal, and tragic, Congo red dyestuffs from the aqueous environment. In this study, the surface orientation of various functional groups and the crystallinity of the peels were evaluated through FT-IR and SEM characterizations. In comparison to the Freundlich statistical data, the Langmuir and Temkin models seem to be more suited for the adsorptive elimination of CGR from aqueous solutions. The correlation coefficients for nonlinear Langmuir, Freundlich, and Temkin isothermal studies are close to unity, 0.99 for adsorptive removal of CGR on each CPWM, PWM, CPWC, and PWC. The
Footnotes
Abbreviations
Data Availability
All data related to this work is presented in results section along with references.
Conflicts of Interest
We have no conflicts of interest regarding the publication of this paper.
Acknowledgments
We are thankful to COMSAT, Lahore, and LUMS for analysis services.