
Abstract
In this paper, we propose a supervised deep learning neural network (D-CNN) approach to predict CO2 adsorption form the textural and compositional features of biomass porous carbon waste and adsorption features. Both the textural and compositional features of biomass porous carbon waste are utilized as inputs for the D-CNN architecture. A deep learning neural network (D-CNN) is proposed to predict the adsorption rate of
1. Introduction
The introduction of machine and deep learning models started in 1980s [1–5], and machine learning models have been at the front position for intelligent computer models for prediction and classification. Deep learning is a type of machine learning with more depth for feature extraction. Deep learning, with its dependence on feature extraction instead of clear training to achieve optimal solutions, accomplishes high performance in stochastic settings [6] and is thus associated in a way to simulate the inference thinking found in human brains, using supervised learning process [7]. Many scientists have studied machine learning and their mathematical and stochastic nature for numerous applications. This paper utilizes the mathematical nature of machine learning model in an organic application of
As an advance of machine learning models, deep learning is distinguished from machine learning because it extracts deep features through unsupervised learning iteratively. Such feature extraction guarantees model independence from human control (human feature engineering). Also, deep learning model accuracy is powered by the existence of adequate data for training and assembles significant information and data correlations [8, 9].
Carbon capture is employed as an essential tool for dropping
The
Deep learning model (DLM) is an intelligent model that undergoes training phase to accomplish classification from input data such as images with high precision. DLM is trained by utilizing supervised learning from labeled dataset [15]. Machine learning and deep learning in many adsorption fields, such as waste-to-energy transfiguration [16–20], compound sorption [21], and biowaste treatment [22, 23] has received intensive interest. Machine learning models comprise linear regression,
In this paper, we propose a data-driven model of mapping the
Table 1 depicts different gas adsorption simulation deep learning prediction models.
Summary of gas adsorption simulation deep learning prediction models for different gases using density, molecular, and vacancy volume.
In this paper,
This paper is structured as follows: Section 2 proposes the new methodology. Section 3 presents the data collection and statistics and. In Section 4, experimental results are demonstrated. Section 5 depicts a comparative study and result discussion. Section 6 depicts conclusions of the proposed work.
2. Model Description
Feature fusion process enhances neural network prediction performances after getting rid of redundant properties in the datasets. In our proposed model, we initiate feature fusion process and then we enter the learning process followed by the prediction process. A D-CNN with 12 convolutional layers and a dropping layer incorporated with feature fusion procedure. Accuracy of the D-CNN with different weights is computed and ordered so that the D-CNN can pick the attribute of the highest and the least imperative for each run of the D-CNN learning phase. The algorithm recaps itself to eliminate multiple input attributes. When the D-CNN will not reach a sufficient accuracy as defined in the model, the process will halt, and no more features will be removed. Dropout layer is employed to lessen the overfitting of the input training data. Frame work of the proposed model in Figure 1.
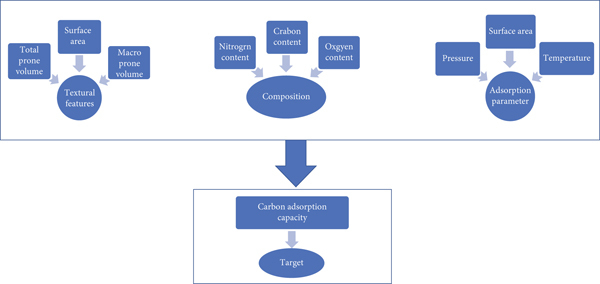
The proposed workflow defining model parameters, namely, textural, composition, and adsorption parameters.
2.1. Model Work Frame
As seen in Figure 2, the work frame for the D-CNN model consists of many phase. The first phase is mainly to identify and gather data items based on the following parameters such as textural composition and adsorption parameters. The next phase is to input these data into the D-CNN network training phase. The input variables range between the values −1 and 1 and normalized according to the following equation:

The deep learning model consists of many phases. The first phase is mainly to identify and gather data items based on the following parameters such as textural composition and adsorption parameters. The next phase is to input these data into the network training phase.
The
The proposed model will tune the D-CNN parameters and weights to enhance prediction performance. In the subsequent phase, the validation data is tuned using a dataset partition, and the verification is then executed using the validated inputs. The ratio of the correlation (
The model simulation was implemented in the 32-bit Windows-10, using Python 3.6. The experiment was implemented using Keras on the Tensor platform. The model training was also performed on the tensor platform with Keras. The system was programmed using Intel ® Core™ i7-7300 CPU @5.60GHz with 16 M Cache, 32 GB RAM, and GTX 1070 video card. The model was implemented in Python 3.6, employing the Sickie-learn function library [28].
3. Data Collection and Statistics
3.1. Data Collection
Data collection was conducted by collecting data from literature review on BWPC for carbon capture utilizing keywords such as biomass, porous carbon, waste,
The data collection presumes the following assumptions:
Screened data were accepted, without bias towards data validity The data were acquired from experiments performed by scientists. Data items that are not listed directly were extracted from listed figures utilizing Plot-Digitizer web crawler to extract the required data and cleaned to circumvent duplicates The selected input features extracted and categorized into classified into three classes: (1) texture features, (2) BWPC compositions, and (3) adsorption properties such as temperature at which The primary texture features of the BWPC incorporate the surface area and the pore volume The secondary texture features include macropore area and volume and the weight content of The
3.2. Data Preprocessing
The collected data will be transferred into predefined units. At the data cleaning phase, missed data were found to be mostly total pore and macro pore volume. This missing data is due to the variance in the data published and the selection of textural features stated. Most papers described the surface area and total pore and macropore volumes. Therefore, many data items are either area or pore volume, while macropore volume was not listed, and in alternate cases, the area and macropore volume were listed, but total pore volume was not listed. Data cleaning is very crucial for missing data reproach of total pore volume and macropore volume using machine learning. Data cleaning techniques are performed to evade removal of tuples with missing attributes.
The linear correlation between the inputs is formulated using Pearson coefficient (𝛙) as depicted in the following equation:
where 𝛙 is the Pearson coefficient for the feature
3.3. The Collected Dataset (DS)
The processed 1400 data items are exposed to several training phases by dividing the original dataset into random training set and another test set. 80% of the data items are labeled and utilized for the learning data, and the 20% partition are used as testing for the supervised models. Crossvalidation process is utilized to tune the parameters to concurrently enhance the model’s prediction accuracy using
Crossvalidation testing for
3.4. Parameter Tuning
Three tree machine learning models were employed and fused to predict
The gradient decision model (GDM) is an ensemble learning model that syndicates several connected sequence decision trees [30]. Decision trees are considered weak learners. But with incorporation of gradient decision models, by totaling sequence decision trees in an ensemble will induce learning boosting. Each sequence decision subtree optimizes the solutions from the previous subtree, and the boosting algorithm induces high efficiency of the gradient decision model. The scalable boosting tree model (SBT) is a scalable decision tree with a trailing gradient decision algorithm, using many decision trees and biased quantile search to execute distributed computing. GVD is gradient variant decision tree model that utilizes fast feature bundling to enhance efficiency without compromising the accuracy. Then, as a summary, the three employed tree models are as follows: the gradient decision model (GDM), the scalable boosting tree model (SBT), and gradient variant decision tree model (GVD).
Parameter adjusting is the procedure of extracting parameters to attenuate the performance. Parameters are usually tuned in the training phase. Parameter tunings are performed using grid search and Bayesian inference [31]. In our research, multiple parameter tuning procedures are performed and tested, and then best parameters are selected with the highest accuracy. In the propose model, the grid search technique was performed for parameter tuning yielding a small set of input features (seven features).
3.4.1. Metrics
The performance metrics of the regression techniques are mostly use linear dependency metric (
where pi and ti are the predicted and the ground truth, respectively.
3.4.2. Feature Importance
Decision tree models face the challenge of computing the significance of an input feature and its effect on the output accuracy. Permutation mean decline accuracy (PMD) is a method utilized to identify the significance of each feature for tree prediction models by computing the changes in the model prediction performance when an input feature is used or not used. PMD is the average drop in the Gini score, which computes the contribution of each independent variable to the homogeneity of the tree nodes [34]. The greater the value of the PMD score, the significance of the input in the prediction. The model is fit for identifying the significance when the permutation count of the features is reasonable or the computation will be resource and time intensive. Our proposed model utilizes seven input features; the permutation model is utilized to compute the feature ensemble importance. Permutation significance accuracy can identify the respective importance of an input feature to the prediction model as a whole and the effect of the input on the target dependent variable. The PMD is a regression formula that lowers the effect of the inputs on the prediction of the deep learning model, with the exception of the single input of interest, thus denoting sensitivity analysis. Thus, by disregarding the impact of one independent input feature is attained. In our model, each single feature is used at an instance of time to measure its impact on the target output for each data item in the dataset. We should note that the GDM utilizes global and local estimates, and local sensitivity study from the PMD was utilized in this research. PMD allows the effect of the inputs on the output variables by computing their impact across individual data items.
3.4.3. Data Statistics
Analysis of the features and the target dependent variable is performed using raw data; for instance, the dataset consists of 1400 data items [7, 8] that were analyzed statistically, realizing the minimum and maximum values as well as the mean of the input values. The target dependent variable is also analyzed to gain insights. Figures 3–5 depict the representation of the data statistics for the inputs and the target output. The average values of


4. Experiments
The three different feature extraction algorithms that were utilized to get best features are the gradient decision models, random forest, and gradient boost models, and the texture type, composition, and adsorption parameters are utilized as input data. The amount of adsorbed
4.1. Neuron Selection
A number of activation functions have been employed in this research. Sigmoid function is utilized for the hidden layers, and Purlin transfer is utilized for the output layers. The least mean square error function value and the maximum correlation (

The optimum number of neurons is estimated using the least mean square error function value in the range from 1 to 80.
Hidden layers’ number against the mean square error and the correlation factors for different models, where the adsorption parameters (pressure and temperature) are selected using the Bayesian ordered function with the least mean square error values.
4.2. D-CNN Architecture for Adsorption
Both the machine learning and the Bayesian regression models have several hidden layers of 20 and 15 neurons and one layer of 65 neurons. The D-CNN consists of input, hidden, and output layers. The input layer utilizes the input data for adsorption parameters and other inputs. The hidden layers are selected by the precision required. The hidden layers in this research are set to three layers which achieve suitable precision. The neurons in the hidden layers are set to 15 or 20. The Sigmoid function is employed in these layers. The output layer utilizes a linear transfer function, namely, Purlin.
The

Correlation between the prediction of our model and the benchmark data for different mean square error versus the ground truth (labeled adsorption amount).

Correlation between the prediction of our model and the labeled adsorption data for mean square error of 0.00092

Correlation between the prediction of our model and the labeled adsorption data for mean square error of 0.00019
The machine learning model with the Bayesian regression technique for the adsorption procedure is fitted to normalize the impact. These results indicate that the predicted D-CNN model fit the labeled adsorption dataset concisely. The regression correlation coefficient (
To study the relationship of the adsorption parameters (i.e., pressure, temperature, and adsorbents amount) and to identify each variable impact on the adsorption amount, charts of a response surface for the proposed model predicted versus the labeled benchmark data are depicted in Figure 8. The average values of

Adsorption rate and pressure versus temperature, with average surface area of 1442.70 m2/g. The average values for pore volume (PV) are 0.77, and macropore volume (MV) has an average of 0.52 cm3/g.
The proposed model underwent experiments and the results are summarized using the optimized D-CNN weights for adsorption rate prediction. The results are summarized in Table 4.
Pearson’s coefficient matrix for all features included in the research. Insignificant correlation was found between the inputs, only textural features (surface area, pore volume, and macropore volume). The features with units are depicted as follows: surface area: (m2/g), pore volume: (cm3/g), macropore volume: (cm3/g), H: hydrogen, N: nitrogen, O2: oxygen, and CO2 adsorption (mmol/g).
In the linear dependency correlation between the input independent variables, a high positive correlation was perceived in the textural features including the surface area, prone, and macroprone volume. The Pearson coefficient for those variables is greater than 0.736, indicating a high correlation. Only textural properties have high correlation but no substantial correlation was perceived for the other input variables with Pearson coefficient between −0.5 and 0.5. Table 3 represents the Pearson coefficient matrix. The shortage of a correlation between the inputs aided in maintaining all of them for constructing the prediction method, as every single feature contributes independently to the prediction. There is a high correlation between the textural features, and this set of inputs contained a large portion of the missing information in the raw data.
The overfitting is countered as the 7-fold validation is reached in terms of
Evaluation of the tree machine learning models using the benchmark data, the gradient decision model (GDM), the scalable boosting tree model (SBT), and gradient variant decision tree model (GVD) and our proposed model fusion matrix deep learning model (FMDL).
Figure 9 displays the joint plots of the actual cases versus predicted cases of CO2 adsorption, as computed by the three tree models. Although the GDM and SBT presented analogous performances in the training and crossvalidation, GDM outperformed SBT within higher test

Prediction using scalable boosting tree model (a), gradient decision model (b), gradient variant decision tree model (c), and our proposed model Fusion matrix deep learning model (d). The red color represents 96% confidence of the regression for the test items. The black line is the equality line (


4.3. Feature Analysis
The permutation mean decline accuracy (PMD) is utilized to define the impact of the inputs, which contained the compositions and textural features versus the adsorption parameters on the output target (CO2 adsorption rate). This study was performed for the GDM model, which is indicated as the best model in performance in our research. Figure 10 depicts the impact of each input on the target output. The experiment illustrates the permutation importance for each independent variable on the output. A high permutation importance value for the input indicates a reduction in the model accuracy when the factor is not employed. Thus, a factor with a high permutation importance specifies a weighty impact on the accuracy.
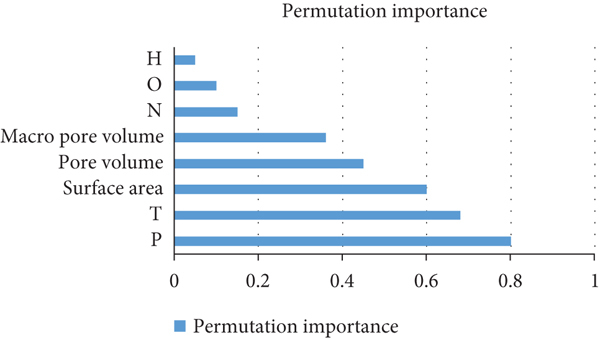
Feature importance analysis where the impact of each factor on the target output. The experiment illustrates the permutation importance on the output.
5. Comparison Study and Discussion
5.1. Comparison Study
We conducted a comparative study of our model versus similar machine and deep learning published models. We completed the comparison on the collected dataset (DS). The comparison is portrayed in Table 6 of the recall, precision, and
Recall, precision, and
Table 7 demonstrates the statistical metrics for the compared adsorption prediction models. Table 8 portrays the confusion matrix of the accuracy, specificity, and sensitivity for the compared adsorption prediction models for three adsorption states (high, moderate, and low) for temperature 25°C and pressure of 1 bar.
Statistic metrics for the compared model with and without feature fusion.
Confusion matrix for the accuracy, specificity, and sensitivity for the compared adsorption prediction models for three adsorption states (high, moderate, and low) for temperature 25°C and pressure of 1 bar.
5.2. Discussion
In the experimental study, we applied accuracy, specificity, and sensitivity metrics. The results demonstrate that by employing feature fusion, all prediction models including our proposed model were more able in terms of accuracy with respect to the same classifiers without feature fusion. The best accuracy level for adsorption detection was attained by our proposed D-CNN classifier, which gained 98% accuracy outperforming other classifiers by about 6%.
The experiments with feature fusion designated that suitable feature space fusion can enhance the results by a realistic margin. Accuracy outcomes of these cases are represented in Figure 11.
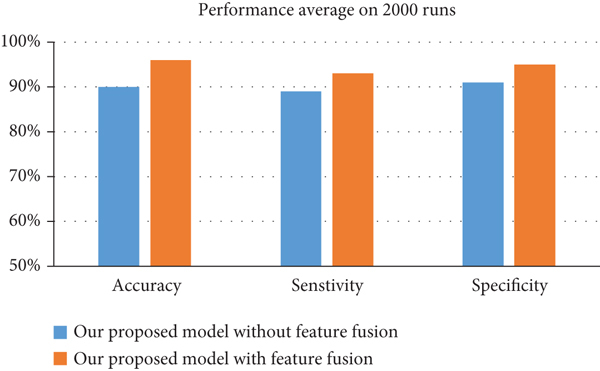
Accuracy results for proper feature fusion.
Figure 12 exhibits correctly predicted cases and incorrectly predicted cases. The results display upgrading with feature fusion. The mean square error stayed less considerably when using feature fusion. The Kappa metric for the all compared prediction model also was better when feature fusion was incorporated. This suggests that feature fusion upsurges accuracy because it fuses all relevant features. Of all the compared models, our model attained the maximum improvement with feature fusion.
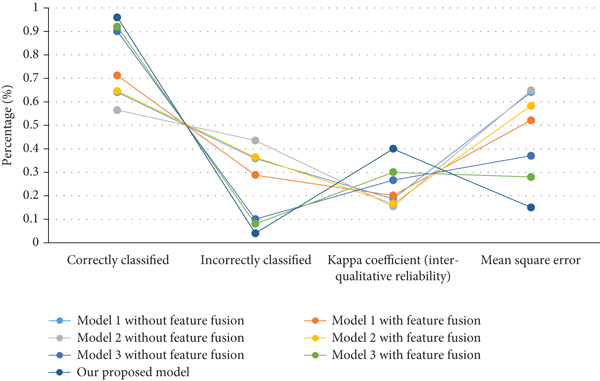
Correctly classified versus incorrectly classified case comparison for different models with and without feature fusion.
Table 9 depicts the comparison study of execution time of classifying CO2 adsorption with the same training dataset. Our model with feature fusion has the least prediction time (in contrary to training time because of more features incorporated in training). Model 1 is the next in prediction time with feature fusion still slower than our model by an order 2.
Comparison of the prediction time in seconds with the same training dataset.
6. Conclusions
In this paper, we employed a supervised deep learning model for
The permutation importance of fused features yields the following observations: the pressure and temperature are the weightiest parameters impacting the model prediction accuracy. The textural features (SA, TV, MV) in the order of declining precedence and the last important are the compositional factors on the feature importance analysis, and the significance of the features was individually observed and categorized into three classes, with the adsorption being the utmost important one.
A comparison of our model versus deep learning published models (recall, precision and F-measure, execution time) was performed. The comparison results indicate that our adsorption prediction D-CNN model is better than other models in adsorption precision. Our system demonstrated enhancement of 6.59%, 6.59%, and 4.3%, in the
These results indicate that adsorption parameters highly impacted the CO2 adsorption rate. For example, we will find a decrease in the CO2 adsorption with the more temperature and less pressure.
Footnotes
Data Availability
The data presented in this study are available on request from the corresponding author.
Conflicts of Interest
The authors declare that they have no conflict of interest to report regarding the present study.
Acknowledgments
This research was funded by Princess Nourah Bint Abdulrahman University Researchers Supporting Project number (PNURSP2022R113), Princess Nourah bint Abdulrahman University, Riyadh, Saudi Arabia.