
Abstract
In this study, neem biomass (a mixture of neem leaf and bark), obtained from the matured neem tree, which is an eco-friendly and low-cost material was selected as a bioadsorbent to remove lead metal ion (Pb2+) from aqueous solutions. Neem biomass-based bioadsorbent having a carboxylic group was prepared by activation using chemical modification by NaOH and citric acid with a very simple method. The optimal activation conditions were determined as 37 min, 120°C, in 0.73 M citric acid, with a sample/acid ratio of 1/100 (mass/volume). To determine the basic properties such as chemical structure, porosity, and surface properties of the neem biomass (NB) and chemically modified neem biomass (CMNB), they were characterized by BET, FTIR, SEM, XRD, and pHpzc methods. It was observed that activation has improved the adsorption capacity of the NB and also caused a more amorphous structure. The effects of adsorption parameters such as pH (2–7), contact time (10–110 min), initial Pb2+ ion concentration (100–300 g/L), and bioadsorbent dosage (01–1.1 g/L) on percentage removal of Pb2+ ion were studied. Maximum removal of Pb2+ ion (97.29%) was recorded at 0.9 g/L bioadsorbent dosage, 50 min contact time, pH of 6, and initial metal ion concentration of 100 mg/L. Kinetics and isotherm studies showed that the adsorption mechanism of Pb2+ ion using CMNB follows pseudosecond-order while isotherm studies fit with both models but, relatively, Freundlich model better fit having a little higher
1. Introduction
Water is a finite natural resource that is vital to life and health [1]. About 97.5% of the whole water on the earth’s surface is salty water, and the remaining 2.5% is fresh water. About 70% of freshwater is solidified in Greenland and Antarctica. Just 1% of the earth’s fresh water is available for a wide variety of human use [2]. Water pollution has become a serious issue for the survival of mankind and the economic growth of the earth’s nations [3]. Wastewater could be generated from industrial, agricultural, municipal, and other point and nonpoint sources. Industrial wastewater is the key pollution source in the pollution of water resources [4]. The water pollution caused by heavy metals from various industries poses a worldwide threat with a cumulative, chronic, and harmful effect on the environment and the health of living organisms [5, 6].
Heavy metals are any metallic chemical element that has a relatively high density and is toxic at low concentrations and cause water-borne diseases when waste containing heavy metal compounds in water bodies [7, 8]. They cause serious pollution problems due to their persistence in nature, accumulation in the food chain, and nonbiodegradable nature [9]. Lead, chromium, cadmium, copper, nickel, zinc, arsenic, and mercury are known as the most toxic pollutant metals [10]. Lead, which has been examined in this study, is considered one of the most toxic heavy elements for humans and is found in high concentrations in the liquid waste of industries such as metal processing, mining, batteries manufacturing, electroplating, tanneries, pigments, paints, textiles production, fertilizers, pesticides, and steel factories [11]. In the environment, lead (II) primarily exists as Pb(II), Pb(IV) is only formed under extremely oxidizing conditions, and inorganic Pb(IV) compounds are not found under ordinary environmental conditions [12]. Lead causes severe health problems for human beings, such as high blood pressure, heart disease, cancer, reproductive system disorders, and skin disease [13].
In recent years, scientists have developed and implemented various methods to remove potentially toxic inorganic and organic pollutants from water due to the growing concern about public health and environmental quality [14]. There are various removal methods including biological, physical, and chemical processes such as chemical precipitation, ion exchange, electrolysis, membrane separation, coagulation-flocculation, electrolysis, and filtration [15]. Compared with other techniques, the adsorption of heavy metal ions onto solid materials is advantageous in treating wastewater due to its simplicity, making it often the most economical solution [16]. However, the use of expensive adsorbents in this method limits its application [17]. The adsorption method using natural materials [18], which is called bioadsorption, could be helpful in this regard. The interesting features of the newly developed bioadsorbents are their high versatility, metal selectivity, high uptake, no concentration dependence, high tolerance for organics, and ability to regenerate [19]. The new trend is to use biomass to trap lead (II) ions in line with “Green Chemistry” standards [20]. The trend considers toxic chemical reagents reduction, multiple use of reagent, reduce carbon emission, the introduction of an environmentally sustainable analytical method for analyte detection, and microscale innovations [21].
Different types of biomass have been considered for the last two decades, and their bioadsorption features have been widely studied by various researchers [21–26]. Biological materials like coconut shell, banana pith, beech leaves, orange peel, waste tea, water hyacinth, bagasse, soya cake, almond shells, cactus leaves, fly larva, cypress, and pine leaves were used as raw materials for bioadsorbent preparation [27]. Metal ions could be sequestered on biomass by using acetamide, amino, phosphate, amide, amine, sulfhydryl, and carboxyl groups [28]. However, the bioadsorption properties of these materials may enhance significantly after chemical treatment [29]. Pretreatment of biological material methods using different kinds of modifying agents gives an improvement in metal-binding capacity, high mechanical strength, and increment of surface area and porosity [30]. Therefore; the biomass is generally being activated with physical and chemical activation by using various agents [31]. It was verified that there was a significant increase of the biomass capacity to hold metallic ions when soybean hulls were submitted to treatments with alkaline solution (NaOH), followed by a modification with citric acid at high temperatures [32, 33]. The neem tree (Azadirachta indica) is an example of an agricultural crop that is produced widely in tropical and subtropical environments [34]. In Ethiopia, neem is commonly cultivated in the dry and wet agro-climatic zones. The tree is primarily used as a shelter belt and a shade tree on degraded soil. In Ethiopia, neem is used to prevent the African bollworm, a pest of cotton, from developing and growing [35]. The present study was focused on utilization of neem biomass as raw materials for bioadsorbent for removal of Pb2+ ion from aqueous solution. The effect and optimization of several activation parameters such as mixing ratio of neem leaf and neem bark, acid concentration, activation temperature and time, and adsorption parameters such as solution pH, contact time, bioadsorbent dosages, and initial metal ion concentration on the lead (II) ion removal were investigated using the prepared bioadsorbent. Furthermore, the adsorption isotherm and kinetics model of chemically modified neem biomass were examined.
2. Materials and Methods
2.1. Materials
The raw materials such as neem leaf and neem bark used for the present study were collected from Hawassa, Ethiopia, which were located 273 km far from Addis Ababa, Ethiopia, and has a latitude and longitude of 7°3
2.2. Methods
2.2.1. Raw Material Pretreatment
The collected neem biomass (leaf and bark) samples were successively washed by the running tap water until some dust and foreign matters get removed and further cleaning (water-soluble impurities) using distilled water, until it became free of impurities, and the water became colorless with necked eye. Then, it was first dried in a shade for a day to remove some moisture content. Then after, the neem leaves were dried in an oven (UN30plu, Memmert GmbH + Co.kG) at 80°C for 7 hrs until they became yellow and crispy; on the other hand, the neem bark was dried at 80°C for 17 hrs until the bark was dried enough to be ground. The dried neem leaves were reduced to powder form to increase the surface area and to increase adsorption capacity using an electrical grinding. But the neem barks were hard to immediately ground by electrical grinder the first round size reduction through a mortar has been done. After that, the biomaterials were sieved to get a uniform size distribution between (212–500 μm). This fraction was again washed several times with distilled water till the washings were free of color and turbidity. After drying for several hours at room temperature, the neem leaf powder (NLP) and the neem bark powder (NBP) were preserved in glass bottles for further use.
2.2.2. Determination of Mixing Ratio of Neem Leaf and Neem Bark
The dried neem leaf and neem bark powder samples were mixed in different mixing ratios (
2.2.3. Activation of the Neem Biomass
Initially, the dried neem biomass was further pretreated using NaOH. Fifty grams of dried raw neem biomass mixture (NBM) powder was placed in a one liter solution of 0.1 N of NaOH. The slurry was stirred at 500 rpm for 1 hr at 25°C with the help of a homogenizer. The base treated neem biomass mixture was poured onto a 125 μm sieve and rinsed with distilled water. The moist NaOH treated neem biomass was washed with deionized water at stirrer speed of 500 rpm for 45 min at 25°C to remove the excess base. This procedure was repeated several times to ensure the removal of the base from the neem biomass. Then, the neem biomass was further dried at 55°C for 24 hrs. Finally, the NaOH treated neem biomass was further chemically modified using citric acid following the previous method reported by various researchers [32, 36, 37].
Citric acid modification of NaOH treated neem biomass was performed according to the method reported by Marshall and Wartelle [33] and Kumar et al. [38] with minor modification. Known amount of NaOH treated neem biomass and concentration of citric acid solution were placed in 250 ml flask. The mixture was heated and stirred at 300 rpm. The slurry was spread in a stainless steel tray for drying at different temperature in oven first at 50°C for 24 hrs and then at 120°C for 1.5 hr. The acid activated neem biomass allowed to cool to room temperature. Then, activated neem biomass was washed in hot deionized water (60°C) until the pH of washed water became around 7. The wet biomass was then dried at 50°C for 24 hrs and then stored in airtight glass bottle which was named as chemically modified neem biomass mixture (CMNB) and used as bioadsorbent for Pb2+ ion removal from aqueous solution.
2.2.4. Optimization of Activation of Neem Biomass
The effect and optimization of citric acid concentration (0.3–0.9 M) [39, 40], activation time (20–100 min) [37, 41], and temperature (90–130°C) [37, 39] were considered for activation of NB. Response surface methodology (RSM) with central composite design (CCD) was applied for experimental matrix design and optimization of citric acid neem biomass activation process (Table 1). Hence, 20 run experiments were performed with eight factorial, six center, and axial points. The bioadsorption process condition used in Section 2.2.2 was used to test the adsorptive performance of the acid activated bioadsorbent.
Experimental matrix for citric acid modification of base treated neem biomass using RSM-CCD.
2.3. Characterization of the Bioadsorbent
Several tests were performed to characterize the raw neem biomass and prepared bioadsorbent (activated neem biomass). To capture the morphological structure of the raw and chemically modified neem biomass, scanning electron microscopy (model: INSPECT F 50, Netherland) was used. The samples were prepared in carbon tape stack material on sample holders; after that, nitrogen inert gas was applied to removes some unbound biomass sample from the carbon tape stack surface of sample holder. When the energy (electron) is generated the pointer starts to captures at different magnification and resolution of the surface texture.
To identify the various functional groups present in raw and the modified neem biomass bioadsorbent samples, FT-IR spectroscopy (model: IRAffinity-1S and make: Japan) was used. Initially, the background with pure KBr pellet was taken from 4000 to 400 cm-1 wave number at resolution of 4 cm-1 with auto scanning speed (2 mm/sec) as a background. Then, the sample was scanned with similar condition from 4000 to 400 cm-1, and the spectrum was recorded and analyzed.
The crystalline and amorphous natures of the samples were analyzed using X-ray diffraction (XRD) (model: mini flex 600 PXRD) with the Cu Kα radiation using an acceleration voltage of 40 kV, current of 30 mA, and over a
The surface area and pore size of the raw neem leave, raw neem bark, and chemically modified neem biomass were determined using surface area analyzer (model: NOVA400e and make: USA). Brunauer, Emmett, and Teller (BET) and nonlocal density functional theory (NLDFT) method were used to measure the surface area and average pore size of the samples using the inbuilt software, respectively.
Further, point of zero charge (PZC) which is the pH value at which the surface charge is zero was determined. The point of zero charge (PZC) for CMNB was investigated by the solid addition method [42]. About 0.1 N KNO3 was prepared with 1.0 L of the solution, dissolve 10.11 g KNO3 (that was 0.1 mol) in distilled water, and then dilute that solution to 1.00 liter using a graduated cylinder or volumetric flask. Around 50 mg of sample was submerged in 0.1 N KNO3 solution in a 100 ml conical flask. The initial pH of the solution (pHi) was adjusted from 2 to 10 by adding 0.1 M HCl, or NaOH base was prepared in 9 different flasks. The sample was kept in constant pH solution for 48 hr to reach equilibrium with occasional shaking. The final pH (pHf) of the supernatant liquid was measured. The difference between these two pH values (
2.4. Batch Bioadsorption Study
A lead (II) ion stock solution with 1000 mg/L (1000 ppm) concentration was prepared from Pb(NO3)2 as precursor in distilled water. Known amount of Pb2+ ion concentration was also prepared from stock solution as per required concentration through dilution for adsorption study. Adsorptive properties of the chemically modified and raw neem biomass bioadsorbent were analyzed by means of conducting batch bioadsorption experiments using Pb2+ ion as adsorbate. Different factors such as bioadsorbent dosage, pH, initial Pb2+ ion concentration, and contact time were considered as parameter for bioadsorption process. To investigate the effect of the variables, bioadsorption experiments were conducted in a batch test. 100 ml of Pb2+ solution of desired concentration was placed in 250 ml conical flask, and the solution pH was adjusted to the required value. The pH of the Pb2+ ion solution was measured by using digital pen type pH meter (model: HI255 combined meter, pH/mV and EC/TDS/NaCl). Known amount of bioadsorbent was added to the Pb2+ ion solution containing flask. The mixture which contains Pb2+ ion and bioadsorbent was mixed for predefined adsorption time for speed of 300 rpm at room temperature. After stirring, the suspension was filtered using Whatman filter paper, the filtrate was analyzed for the Pb2+ ion concentration using MP-AES, and then, the removal efficiency (%) was calculated using eq. (1). The maximum adsorption capacity of the prepared bioadsorbent was measured using final concentration of Pb2+ ion at which the concentration of the ion become constant (eq. (2))
2.4.1. Effect of Bioadsorption Parameters
In the present study, the parameters such as pH (2–7), contact time (10–110 min), initial metal ion concentration (100–300 mg/L), and bioadsorbent dosage (0.1–1.1 g/L) were considered to study their effect on removal efficiency of Pb2+ ion from aqueous solution for batch adsorption experiments.
The batch adsorption experiments were carried out at various pH solutions. Due to precipitation of Pb(OH)2, the adsorption of Pb2+ ion does not take place beyond solution pH of 7.0 [43–46]. Therefore, in the present work, the bioadsorption experiments were performed at various pH which are below pH of 7.0 by adding the required volumes of 0.1 M of HCl or 0.1 M of NaOH solution. The other parameters such as bioadsorbent dosage (0.5 g/L of CMNB), initial metal ion concentration (100 mg/L), and contact time (60 min) were fixed to investigate the effect of pH. The Pb2+ ion removal efficiency (%) was calculated using eq. (1).
In order to analyze the effect of contact time on the adsorption process, experiments were carried out by varying the contact time (10, 30, 50, 70, 90, and 110 min). The other parameters such as bioadsorbent dosage (0.5 g/L of CMNB), initial metal ion concentration (100 mg/L), and pH (6.0) were fixed to investigate the effect of contact time. The Pb2+ ion removal efficiency (%) was calculated using eq. (1).
Bioadsorption experiments were performed at various initial concentration of Pb2+ ion (100, 150, 200, 250, and 300 mg/L) with a pH of 6.0 in 250 ml conical flask containing 0.5 g/L chemically modified neem biomass. The mixtures were then stirred (300 rpm) for 60 min at room temperature. At the end of the adsorption, the filtrate was collected, and percentage absorbance of sample was recorded from the MP-AES reading. Finally, percentage removal and adsorption capacity were determined using eqs. (1) and (2).
The effect of bioadsorbent dosage for maximum removal of lead (II) ion was evaluated by means of conducting a batch adsorption study using chemically modified neem biomass (CMNB) sample (0.1, 0.3, 0.5, 0.7, 0.9, and 1.1 g/L). 100 ml of Pb2+ solutions with initial concentration of 100 mg/L and 6.0 pH was added in to 250 ml conical flask containing different masses of CMNB. Then, the mixtures were allowed to be stirred on a magnetic stirrer (300 rpm) for 60 min at room temperature. After filtration using Whatman filter paper, filtrate solutions were taken in to a MP-AES at a wavelength of 405.781 nm to determine the final Pb2+ ion concentration. The percentage removal of metal ion was calculated using eq. (1). Finally, bioadsorbent dosage with maximum adsorption capacity was considered as optimum for bioadsorption experiments using citric acid-activated neem biomass.
2.5. Adsorption Isotherm
Adsorption equilibrium study is the most significant step while working with the adsorption process. The data obtained from it are helpful in model prediction for analysis and design of an adsorption process. Several equilibrium isotherm equations have been used for representing experimental adsorption isotherm as illustrated by different researchers. The most commonly used isotherm models are that of Langmuir, Freundlich, and Temkin model. Accordingly, the experimental adsorption isotherm data which was obtained from batch experimentation was evaluated and best fitted into the models from which are capable of selecting the best one among using the values the proposed model parameters. In this study, adsorption isotherm experiments were conducted by adding 0.9 g/L of chemically modified neem biomass (CMNB) to a 100 ml of different initial concentrations (100, 150, 200, 250, and 300 mg/L) of the Pb2+ ion to be adsorbed, and the adsorption process was carried out in a magnetic stirrer (300 rpm) at 25°C for an optimum time. The proposed isotherm models mentioned above were used to analyze the adsorption data using their respective model equation from eqs. (3)–(8).
2.5.1. Langmuir Isotherm
Langmuir isotherm model was developed by assuming (a) maximum absorption occurs when the adsorbent surface is covered by a single molecular layer of soluble material, (b) the absorption energy is fixed and identical at all the points, and (c) the molecules of adsorbed material cannot move in the adsorbent surface. It is applicable for homogeneous surface adsorption [47] and expressed as follows.
Further, eq. (3) can be rearranged in to linear form as:
Langmuir constants can be obtained from the plot of
2.5.2. Freundlich Isotherm Model
One of the most popular adsorption isotherms used for liquids to describe adsorption on a surface having heterogeneous energy distribution is Freundlich isotherm model [47]. The model was derived by assuming heterogeneity surface and presented in a logarithmic scale using the expression:
Equation (6) can be rearranged in to linear form to obtain the following equation:
A plot of
2.5.3. Temkin Isotherm Model
Temkin isotherm based on the ions adsorption heat, which is due to the bioadsorbate and adsorbent interactions, is represented by the following equation.
2.6. Adsorption Kinetics
Kinetics study of the adsorption process is a fundamental procedure since it provides relevant information about mechanism and characteristics of adsorption process follows which have a direct influence on the rate controlling step of the process. Pseudofirst order and pseudosecond order kinetics models are the most commonly used kinetics models used to fit data obtained from the adsorption experiment. In this study, kinetic experiments for Pb2+ ion uptake were carried out by adding 0.9 g/L of CMNB to a 100 mL of Pb2+ ion solution (100 mg/L) and stirred at 300 rpm and 25°C for differing contact time (10, 30, 50, 70, 90, and 110 min).
The residual concentration of Pb2+ ion,
Nonlinear and linearized adsorption kinetic model with their parameters.
The pseudofirst order kinetic model was represented by the following equation.
Integrating and applying boundary conditions
The pseudosecond-order kinetic equation [49] is expressed by the rate expression:
Integrating the above equation and applying boundary conditions
Further, eq. (13) can be rearranged to its linear form as follows:
3. Results and Discussion
3.1. Optimization of Activation Parameters by Numerical Method
Before the optimization of activation process, the effect of mixing neem leaf in neem bark on lead (II) ion removal efficiency was analyzed (Table 3). The experimental result shows that lead (II) ion removal efficiency for neem leaf lesser than that of neem bark. Based on the lead (II) ion removal efficiency as shown in Table 3, mixing ratio of 1 : 3 neem leaf/neem bark was chosen for the mixture of the parts the neem biomass for further activation.
Result of mixing of neem leaf and neem bark (at constant parameters in a batch bioadsorption:
The three variables studied for the preparation of chemically modified (activated neem biomass) are summarized on Table 1. The results obtained from the experiment were analyzed with ANOVA (analysis of variance) to model the relationship between various factors and the responses. Treating with a base like NaOH and a subsequent citric acid modification stabilizes the neem biomass due to insertion and cross linking of carboxyl groups and thus increases its cation uptake ability [17]. The modification was based on carboxylation mechanism through which additional carboxyl groups were introduced to the treated biomass. The reactive anhydride is formed between two adjacent carboxylic acid groups resulting in the loss of one water molecule during the heating of CA. The anhydride reacts with a hydroxyl group of cellulose to form an ester linkage [9].
In this study, numerical optimization was used to optimize the activation process: activation time (
CCD experimental design matrix and results of corresponding response variable.
3.1.1. Statistical Analysis of the Experiment Results
Based on the
Analysis of variance (ANOVA) for response for predefined model for the experimental results.
Model development for the removal of Pb(II) ions chemically modified neem biomass.
According to eq. (16), activation time, activation temperature, acid concentration, and the interaction between time and temperature have positive impact, whereas time and acid concentration have negative impact or undesirable effect on the removal. Predictive
The linear plots (Figures 1(a) and 1(b)) retrieved from the software were presented below, and the statistical adequacy of the model was checked by taking a diagnostic test of a normal plot of residuals and residuals versus predicted and outliers. The models are suitable to forecast the removal percentage of lead (II) ion within the experimental values selected. The performance of the model can be also understood by seeing the plots of predicted versus experimental percentage lead (II) ion removal efficiency. It was assessed that the predicted values of lead (II) ion removal efficiency are the closest to their experimental values. Figure 1 shows the characteristic charts to be used for evaluating the efficiency of the regression model. Figure 1(a) shows the high correlation between the predicted and the experimental removal values, while the residuals show a normal distribution (Figure 1(b)); these supports the model to be a sufficient approximation of the actual system.
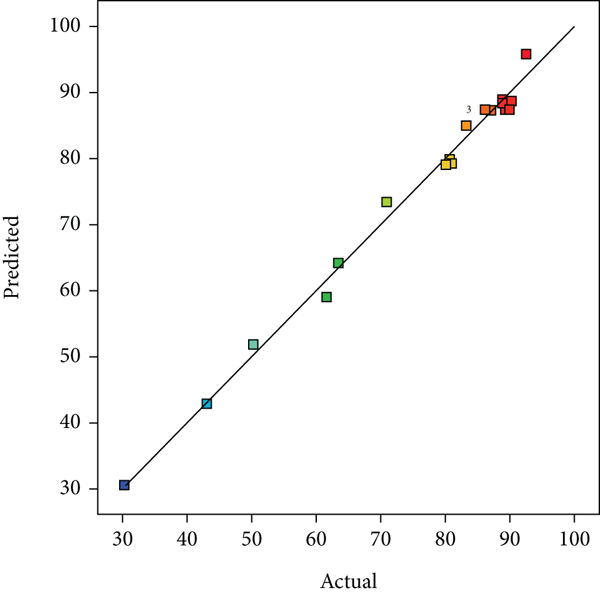
(a) The model predicted vs. the actual Pb2+ ion removal (%) and (b) externally studentized residual vs. run number.

3.1.2. Interaction Effect of Variables
The adequacy of the RSM model for the prediction of Pb(II) adsorption under experimental conditions and the interactive effects of the independent parameters on Pb(II) removal were evaluated using three-dimensionally. The three-dimensional response surface plots were taken to evaluate interaction of the independent variables on lead (II) ion removal. Figure 2(a) illustrates the interaction the form of the combination of the effect of activation temperature and activation time bioadsorption of lead (II) ion. This conception was explained with the response surface 3D plots. Increasing the contact time will increase the removal efficiency of lead (II) ion to a substantial level. The maximum lead (II) ion removal efficiency was observed after interaction of time of 60 min and temperature of 100

3D plots for the combined effect of (a) activation temperature and time (b) activation temperature and time and (c) activation temperature and time on Pb2+ ion removal at 0.5 g/L of dosage of bioadsorbent, contact time of 40 min, and 100 mg/L of Pb2+ ion concentration.


The interaction effect of the citric acid concentration and contact time on lead (II) ion removal efficiency were studied, and the trend of the interaction is illustrated in Figure 2(b). This combination was positively boosted the bioadsorption capability to some extent. This was observed on the 3D surface plot. The maximum lead (II) ion removal efficiency of around 95% was seen after concentration of 0.6 M and after around 60 min. It can be seen from the 3D plot that both the citric acid concentration and time had negative effect on lead (II) ion removal. In general, at lower concentration and activation time, the removal efficiency of the modified biomass was observed to be minimum, and maximum bioadsorption observed at higher values of activation parameters. Lead (II) ion removal was calculated as the function of the interaction effect of the citric acid concentration and temperature on response surface plots were obtained using the response surface methodology approach. Separately, both citric acid concentration and activation temperature influenced the lead (II) ion removal positively. This implies that lead (II) ion removal increased with the increase in citric acid concentration and activation temperature. At lower concentration as temperature went higher, the removal efficiency increased. As shown on Figure 2(c), high efficiency was observed at higher citric acid concentration and activation temperature.
3.1.3. Process Optimization and Validation
In this study, numerical optimization method was used to optimization of the activation time, temperature and acid concentration where major determinants influencing the adsorption capacity of the biomass as a result of increment in surface area and more bonding sites to the metal ion. The optimal conditions were evaluated by composite desirability which has the value of 0 to 1, the most important statistical metrics, namely, lowest
An experiment with activation time, temperature, and acid concentration was conducted in order to study the outcome or effect of the design. Three experiments were carried out at the optimized conditions of activation time 36 min, activation temperature 122
3.2. Characterization of Raw and Modified Neem Biomass
3.2.1. PZC Analysis
Point of zero charge determination of bioadsorbent is important in to know the charge on the bioadsorbent material. Further, it helps to explain the adsorption mechanism. The surface functionality of the biomass changes as the solution pH changes. To understand the bioadsorption mechanism, it is necessary to determine the pH at point of zero charge (pHPZC) of the adsorbent. In general, adsorption of cations is favored at
According to Figure 3, it is also observed that the pHPZC of the chemically modified neem biomass (CMNB) was around 5. It shows that at low solution pH, the solution remains cationic, and that as solution pH increases, the extent of deprotonation increases, whereas above a solution pH of around 5, the solution becomes anionic, resulting in more cationic metal ion adsorption.

PZC analysis for chemically modified neem biomass (CMNB).
3.2.2. Scanning Electron Microscope (SEM) Analysis
SEM analysis was used to investigate the surface structure of neem biomass before and after activation at 200 μm of surface magnification (Figure 4). Relative to the surface structure of neem biomass before activation, it was observed that more pore openings are created on the surface structure of neem biomass after activation. This increases the surface area of the biomass, which in turn increases the binding sites for the adsorbent. On the micrograph image, the dark structure indicates the passage of electrons through the created pores. The increase of pores on the modified biomass might be resulted due to the elimination of impurities using the chemical activation and breaking of lignin and cellulose bonds.

Scanning electron microscope (SEM) imaging for before (a) and after (b) bioadsorption at 200 μm.

3.2.3. Functional Group Analysis
Figure 5 shows the FTIR spectra of the raw neem leaf, raw neem bark, NaOH extract, and citric acid modified samples were shown. For the raw neem leaf, the peaks at 1109, 1277, 1382, 2924, and 3445 cm-1 indicating ester C-O stretch [50], ether C–O stretch, nitro groups of N=O bend, H-C-H alkane asymmetric and symmetric stretch, and N-H (stretch similar to amines) functional groups were found. 1109, 1269, 1382, 2074, and 2368 cm-1 are showing ester C-O stretch [50], ether C-O stretch, nitro groups of N=O bend, and aldehydes with C-H stretch off C=O. The absorption peak at 3458 cm-1 was due to –NH2 (stretch similar to amines) [51]. The NaOH extract sample had peaks of 1100, 1269, 2080, 2933, and 3453 cm-1 indicating ester C–O stretch [50], ether C–O stretch, alkynes of C–C stretch, –CH alkane asymmetric and symmetric stretch, and N-H (stretch similar to amines) functional groups were found [51]. The citric acid modified sample on the other hand had peaks of 1109, 1385, and 1621 cm-1(due to –C=O stretching vibrations) [52]. These peaks were associated with ester C–O stretch [50], nitro groups of N=O bend, and alkenes group of C–C=C Symmetric stretch. The peaks remarkably decreased due to loss of polysaccharides. The samples FT-IR spectra show peak at around 3400 cm-1 due to O–H stretching vibration [50–52]. It can be seen that the FT-IR spectra indicated the presence of ionisable functional groups such as amino acids/amino groups, ether C-O stretch, and –CH2 alkane’s asymmetric and symmetric stretch. Ionization groups are functional groups that could perform as proton donor/acceptor impacting the capability for a molecule to act as an acid or base [50]. This ionization generates empty active sites that could be substituted by metal ions [51]. This indicates that activated neem biomasses may possibly be used as adsorbent for heavy metals like Pb(II) ion. The peaks indicated that there are some functional groups on the surface of the bioadsorbent, which could be reacted with the numerous ions during modification.
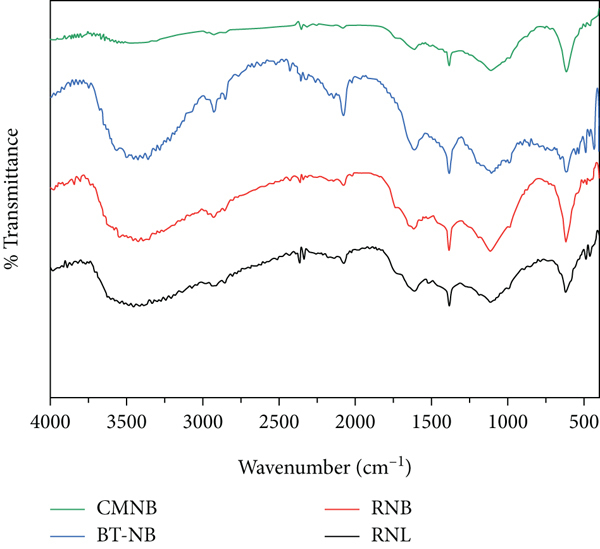
Fourier transformation infrared (FTIR) spectrum for raw neem bark (RNB), raw neem leaf (RNL), base treated neem biomass (BT-NB), and chemically modified neem biomass (CMNB).
3.2.4. X-Ray Diffraction (XRD)
X-ray diffraction was used to investigate the existence of amorphous and crystalline minerals with respect to bioadsorption capability. The diffraction spectrum of raw neem bark RNB has amorphous in nature and did show some obvious crystalline peak at the scan range (Figure 6). The XRD pattern of RNB (neem leave and neem bark separately) showed almost the same pattern as several peaks at

XRD profile of raw neem leaf (RNL), raw neem bark (RNB), and chemically modified neem biomass (CMNB).
3.2.5. Surface Area and Pore Analysis
BET is nitrogen adsorption surface area instrument, which is a highly convenient tool in the characterization of amorphous materials. It helps to distinguish the precise surface area with only 1% of error. The pore size distribution of samples in this study is more of microporous as shown in Figure 4. The produced citric acid modified NB had a surface area of 164.07 m2/g, total pore volume of 0.3051 cc/g, and pore size of 16.58 μm. Whereas, NaOH extract NB had a surface area of 140.72m2/g, total pore volume of 0.2675 cc/g, and pore size of 18.69 μm. On the other hand, the raw neem biomass had 79.57 m2/g surface area, 0.2217 cc/g total pore volume and 16.58 Åm pore size. Contrasting from the three samples, the citric acid-modified NB had much larger surface area and minimum pore volume. This is because of the effectiveness of activation of the sample by CA. The raw biomass is composed of volatile matter contents and other degradable components which results in minimum pore volume and surface area. However, NaOH extract NB had maximum pore size due to the activation of volatile component removal. In general, activation of raw neem biomass by citric acid increases the surface area and the pore diameter by 43.46 and 27.34%, respectively, and extraction by NaOH increases the pore size by 11.3% (Table 7).
Results of pore size, BET, and pore volume of bioadsorbents.
NBM: neem biomass mixture.
3.3. Batch Adsorption Studies
3.3.1. The Effect of pH
At low pH (2), the acidic property of the active sites and the race of hydrogen ions with the lead ions provide 20.89% removal efficiency, but as protonation decreases, the removal efficiency increased to 98.6% at pH of 6, and the uptaking efficiency of the bioadsorbent decreases to 90.58% at pH of 7 (Figure 7). As a result, further pH increment lead (II) ion to a reduction in the uptake efficiency. At pH 6, lead (II) ion was existing in the solution as free ions, as pH increased, various lead hydroxide compounds and complexes were formed, which decreases the concentration of Pb2+ ions sharply beyond pH of 6. The compounds and complexes such as PbOH+, Pb(OH)2, and Pb3(OH)4 2+ were created. Due to this, the attachment of lead (II) ions onto the modified neem leaf was highest at a pH of 6, and this indicates that the existence of lead (II) ions was freely. This indicates that the initial pH would play a very vital role in the removal of the Pb2+ ions from solution. The interference of PbOH+, Pb(OH)2, and Pb3(OH)4 2+ results in the precipitation of lead, which no longer does not result in the increasing of the adsorption efficiency.

Effect of pH on adsorption behavior of Pb2+ at constant lead (II) ion concentration of 100 mg/L mixing speed of 300 rpm, temperature of 25°C, contact time of 60 min, and biosorbent dosage of 0.5 g/L.
The observed pH effect on Pb2+ removal efficiency followed similar trends as those observed for lead (II) ion adsorption onto various bioadsorbents such as wheat stem [20] and maize leaf [53].
At low pH values, the adsorbent is positively charged because the
3.3.2. Effect of Contacting Time
As illustrated in Figure 8, the removal of Pb2+ enhanced with contact time. The increment was quick initially up to 50 minutes of contacting time; afterwards, it continued at slower rate in order to reach saturation. Numerically, time-removal efficiency varies directly as 10 min (85.46%) to 50 min (97.29%). The rate of bioadsorption was rapid in the initially due to the free availability of adequate surface area of the bioadsorbent. After the enhancement of contact time, more amounts of lead (II) ions were adsorbed onto the exterior surface of the bioadsorbent (because of van der Waals forces attraction), and it reduces in the existing surface area.

Effect of contacting time on adsorption behavior of Pb2+ at constant lead (II) ion concentration of 100 mg/L, agitation speed of 300 rpm, temperature of 25°C, pH of 6, and bioadsorbent dosage of 0.5 g/L.
This indicated that initially, adsorption took place rapidly on the exterior surface of the bioadsorbent followed by a slower internal diffusion, which may possibly be the rate defining step. Plus, the large deviation was due to the abundant surface sites accessible and the relatively high concentration gradient initially, which leads increased adsorption due to mass transport. After 50 min, it was difficult to conquer the existing vacant surface sites, due to the repulsion among the solute molecules in the solid and bulk phases. This condition was related with the competitive diffusion process of Pb2+ through the microchannels and other pores. The competitive diffusion could block the inlet of the microchannels and stop the Pb2+ ions from passing entirely deep inside of the bioadsorbent for the maximum initial Pb2+ concentrations, which increased the saturation time. Similar observation was reported by Babarinde et al. [53] and Pitsari et al. [9].
3.3.3. Effect of Initial Lead (II) Ion Concentration
The percentage of removal efficiency of lead (II) ion decreased when the initial metal ion concentration increased as shown in Figure 9. There was a huge amount of empty sites accessible for lead (II) ions binding at low concentration of 100 mg L-1, giving a 98.81% removal efficiency. As the amount of initial concentration increased, the sites get to be saturated and, therefore, decreased the removal efficiency of the lead (II) ions. There was a decrease to 68.79% when the initial lead (II) ion concentration was increased to 300 mg L-1. In agreement with previous literature, the initial concentration of heavy metal ions is shown to have an effect on the adsorption process [40]. The cause for the efficiency of the bioadsorbent materials became exhausted gradually with the increase in the initial lead (II) ion concentration. This is due to fixed adsorbent dose, and the total existing adsorption active sites were inadequate, which became saturated at higher concentration.

Effect of initial Pb2+ ion concentration on adsorption behavior for agitation speed of 300 rpm, temperature of 25°C, pH of 6, and bioadsorbent dosage of 0.5 g/L contacting time of 60 min.
3.3.4. Effect of Adsorbent Dose
From Figure 10, it is seen that, when the bioadsorbent amount enhanced from 0.1 to 1 g/L, the lead (II) ion removal increased from 78.5 to 97.7%, respectively. This can be described by reason that the higher the dosage of bioadsorbent in the solution, the better was the availability of exchangeable active sites for lead (II) ions. The removal of Pb2+ increased with an enhancement in the adsorbent dosage up to some amount, and then, it was leftover almost constant. This is predictable because of the increase in the adsorbent surface and loss of the initial Pb2+ concentration, which leads to the reduction of the mass transfer. Therefore, 0.9 g/L of adsorbent dose could be taken as an optimum bioadsorbent dose for further optimization experiments; after 0.9 g/L, there will not be a significant change on adsorption efficiency. According to Zhang et al. [55], it was recommended that the Pb2+ might be transformed into hydroxide precipitation of a very low solubility with the higher dosage of adsorbent. Higher dosage can afford more active sites which advance the Pb2+ removal percentage; nonetheless, not all active sites were used to remove the heavy metal due to overlapping and aggregation. Comparable results were presented using magnetic activated carbon [55] and agricultural adsorbent [56].

Effect of bioadsorbent dosage on adsorption behavior of Pb2+ ion at constant Pb2+ ion concentration of 100 mg/L, stirring speed of 300 rpm, temperature of 25°C, pH of 6, and contacting time of 60 min.
3.4. Adsorption Isotherm Studies
Commonly used adsorption mechanism model such as Langmuir, Freundlich, and Temkin was used for lead (II) ion removal by chemically modified neem biomass mixture bioadsorbent. The Langmuir isotherm is an adsorption important to a monolayer deprived of the interaction among the adsorbate molecules. The process of adsorption takes place at specific sites within the adsorbent. Each site holds one molecule of the given adsorbate. The adsorbent had a finite capacity for the adsorbate at equilibrium. Finally, a saturation point would have been reached, where no further adsorption can occur. At this point, all sites were identical and energetically equal [57, 58].
The values of

Langmuir Isotherm model for adsorption of Pb (II) on CMNB at pH of 6, contact time of 50 min, and bioadsorbent dosage of 0.9 g/L.
The calculated

Plot of separation factor versus initial Pb2+ metal ion concentration.
Figure 13 shows that the plot of

Freundlich isotherm model for adsorption of Pb (II) on CMNB at pH of 6, contact time of 50 min, and adsorbent dosage of 0.9 g/L.
The plot had
Figure 14 presents the values calculated from slopes and intercepts of Temkin isotherms for various samples, besides the linear plots of

Timken isotherm model for adsorption of Pb (II) on CMNB at pH of 6, contact time of 50 min, and adsorbent dosage of 0.9 g/L.
3.5. Adsorption Kinetics
In this study, the relative slopes and intercepts of a plot of

First-order kinetics model for adsorption of Pb (II) on CMNB at pH of 6, initial concentration of 100 mg/L, and adsorbent dosage of 0.9 g\L.

Second-order kinetics model for adsorption of Pb (II) on CMNB at pH of 6, initial concentration of 100 mg/L, and adsorbent dosage of 0.9 g\L.
The linear fitting of adsorption experimental data of the pseudofirst-order and second-order models showed values of 0.9944 and 1 for the samples of CMNB, respectively (Table 8). Similar phenomena have also been seen in the adsorption of lead (II) ion on keratinous materials from biological origin like human hair (HH), sheep fur (SF) [60], and adsorption of Ni(II) and Mn(II) on unmodified Ugwuoba montmorillonite clay [61].
Adsorption kinetics parameter results for chemically modified neem biomass bioadsorption process.
4. Conclusions
This work presents the effect of bio-sorbent neem biomass (mixture of neem leave and bark) on the removal of lead metal (Pb+2) ions from an aqueous solution. The optimum mixing ratio of the neem leave and bark was found to be 1 : 3 (
Footnotes
Data Availability
The datasets generated during and/or analyzed during the current study are available from the corresponding author on reasonable request.
Conflicts of Interest
The authors declare that no financial interest that are directly or indirectly related to this work.
Acknowledgments
The authors would like to acknowledge the Chemical Engineering Department, Addis Ababa Science and Technology University, and Ethiopian Conformity Assessment Enterprise for providing the some characterization instruments to conduct the sample analyses and for providing experimentation support to do the research, respectively. This study was funded by Addis Ababa Science and Technology University as Master student thesis work.