
Abstract
Chromium (Cr) is a heavy metal that has a serious environmental pollution problem. Electroplating wastewater contains high level of Cr that surpassed the acceptable environmental discharge standard limit in surface water bodies and causes aquatic ecosystem risks. Various studies have been conducted in Ethiopia on the removal of Cr from various types of wastewater; however, factual studies on the adaptability of cost-effective activated coffee husk carbon for the removal of Cr from electroplating wastewater are lacking. Thus, this study was conducted to evaluate the Cr adsorption efficiency of activated coffee husk carbon from electroplating wastewater at laboratory scale. The activated coffee husk carbon’s pH, electrical conductivity (EC), ash content, moisture content, bulk density, particle size, pore volume, porosity, volatile organic matter, carbon yield, and carbon:nitrogen ratio were determined following standard methods. In the adsorption experiment, adsorbent dosage, agitation speed, contact time, pH, and initial concentration were optimized. Models were used to examine the adsorption isotherms and kinetics. The ability of activated coffee husk carbon to desorb Cr was investigated. The adsorbent functional groups and surface morphology were examined using Fourier transform infrared (FTIR) spectroscopy and scanning electron microscope (SEM), respectively. Analysis of the physicochemical characteristics of the adsorbent showed that the activated coffee husk carbon has good quality, and thus, playing an important role in metal adsorption. Furthermore, FTIR analysis also confirmed the presence of hydroxyl, carboxyl, and other important functional groups, which promote heavy metal adsorption. The adsorption process optimization revealed 99.65% maximum Cr adsorption efficiency at 120 min contact time, 40 mgL-1 initial concentration, 150 rpm agitation speed, pH 7.0, and 20 gL-1 adsorbent dosages. From the adsorption model studies, Freundlich sorption isotherm and pseudosecond-order models were well fitted with respective
1. Introduction
Surface and ground waters are vital to most people’s everyday lives all throughout the world. However, severe contamination of these vital point water resources became a major topic in the 9th World Water Forum, which took place in Dakar, Republic of Senegal, from March 21 to March 26, 2022 [1]. Most industrial effluents in poor countries are discharged directly into the environment without proper management [2], and thus, posing a risk of surface and ground water pollution. Heavy metals are produced by a variety of sectors, including electroplating, leather tanning, mining, dyeing, dye manufacture, steel fabrication, paints, and pigments, all of which pose a major threat to the ecosystem [3, 4]. Electroplating discharges contain large amount of chromium (Cr), a heavy metal that has serious environmental and public health consequences [5]. Only 30 to 40% of Cr is used effectively in electroplating operations [6], whereas the remaining amounts are left over in the final effluent, which can reach up to 1000 mgL-1 [7], which surpass the World Health Organization’s (WHO) acceptable environmental discharge standard limit of 0.05 mgL-1 for surface water bodies [3]. This implies that electroplating wastewaters must be treated below the permissible threshold limit before being discharged into aquatic ecosystems. Otherwise, its untreated discharge can cause a harmful influence on both humans and the environment [8]. In humans, Cr can induce skin irritation, epigastric discomfort, nausea, vomiting, severe diarrhoea, bleeding, and cancer [3, 9]. Many companies in developing countries operate on small and medium scales; even a tiny unit can produce significant pollution, which is frequently dumped into the environment without any treatment [10]. Similarly, in Ethiopia, several electroplating industries discharge their untreated wastewater into nearby water bodies with the same fashion. This could lead to a build-up of Cr in the environment and causes a significant negative impact on aquatic flora and fauna, as well as public health. As a result, Cr must be removed or recovered before disposal.
Several treatment technologies are now being considered as a potential for the removal of Cr from various types of wastewater. Chemical reduction, precipitation, ion exchange, membrane separation, solvent extraction, adsorption, and biological techniques are some of the options used for reducing metal concentrations [11–13]. Nonetheless, in developing nations, some of these techniques are challenging to apply, while some of these approaches have drawbacks. However, when coupled with suitable regeneration processes, adsorption is an effective and adaptable option for removing heavy metals. Carbon black to clear graphite, carbon fibers and composites to electrode graphites, and many other forms of carbons make up the activated carbon family. All are derived from organic origins but have undergone various carbonization and manufacturing methods. The availability of local raw materials for the preparation of activated carbon makes the adsorbent materials cost-effectiveness, saturation capacity, and renewability, which can easily substitute the limitations of high cost chemical and biological treatment processes. As a result, the use of these ecofriendly, locally available adsorbent materials gain more attention for heavy metals removal from different wastewaters [14–17]. According to various literatures, a variety of materials are utilized to prepare activated carbon for adsorption purposes. Agricultural wastes were as follows: [18]: wood sawdust [19], teff straw [20], rice husk [21], and coffee husk [17], and industrial wastes. Activated carbons generated from these various waste products have been used in a number of experiments to remove Cr metal through adsorption [8, 22]. However, their adsorption efficiency is influenced by contact time [23], the pH of the solution [24], the surface of the adsorbent, and others factors [25, 26]. Overall, studies indicated that treatment techniques like adsorption using agricultural residue are the cheapest available option for developing countries like Ethiopia, but scientific information on the utilization of activated coffee husk carbon for the removal of Cr from electroplating wastewater in Ethiopia is extremely sparse. Therefore, in this study, a low-cost activated coffee husk carbon was evaluated for the removal of Cr from electroplating wastewater under optimized conditions.
2. Materials and Methods
2.1. Preparation of Activated Coffee Husk Carbon
The coffee husk was collected from Megenagna Bona Bord’s coffee processing center (Figure 1(a)). Then, it was first washed with tap water treated with a 3% formaldehyde solution, as described by Chen and Yang [27], to restrict biodegradation of organic components and reduce mould growth. It was then dried for 24 hrs at 105°C in an oven. After that, the dried material was subjected to final thermal activation at 550°C for 60 min (Figure 1(b)). The activated coffee husk carbon was crushed and ground to the size of 250-500 μm using sieve in order to proceed to the adsorption experiment (Figure 1(c)). The activated coffee husk carbon’s physic-chemical characteristics such as pH, electrical conductivity (EC), ash content, pore volume, bulk density, volatile organic matter, moisture content, nitrogen, and carbon yield were determined using standard procedures as follows:
pH and EC: these adsorbent properties were determined using an ASTMD3838-80 [28] method, in which 1 g of activated carbons was weighed and transferred to a 250 mL beaker, and 100 mL of distilled water was added. Then, the mixture was stirred with a magnetic stirrer for 1 hr. pH and EC were measured using an electronic pH and EC meters after the samples had settled (Jenway 430 Model) Ash content: the ASTM D2866-94 method [28] was used to determine the ash content. A 2.5 g of the coffee husk activated carbon powder was placed in a porcelain crucible and transferred to a preheated muffle furnace at 550°C for 5 hrs. The crucible was weighed again after cooling in desiccators. The heating, cooling, and weighing cycle was repeated until the weight of the activated carbon sample remained constant. The ash content in percent (dry basis) was estimated using equation (1). Pore volume: the bulk density and particle density of the activated carbon were used to calculate the pore volume. The values were introduced to equation (2) after obtaining these two densities [2] Bulk density: the density was measured using the ASTM D2854-96 method [28], which involved weighing a 25 cm3 density bottle and packing the activated carbon sample by repeatedly tapping the bottle with the bulk density apparatus until it filled to the specified level of the bulk density apparatus. The bottle was weighed, and the difference in volume was used to calculate the amount of powder in the bottle. The bulk density of the powder was calculated by dividing the weight of powder in the bottle by the density bottle’s tapped volume using equation (2) Moisture content: the ASTM D2867-91 method [28] was used to determine the moisture content. First, a crucible and 5 g of activated carbon were weighed. Then, the crucible was placed in heated oven at 105°C for 3 hrs. The crucible was then removed from the oven, cooled in a portable desiccator, and weighed once again. The process of heating and weighing was repeated until the desired result was obtained, and the moisture content was then calculated as a percentage using equation (4) Volatile organic matter: a 2.5 g of powdered dried activated carbon was placed in a weighed crucible. According to Heavner et al. [29], the crucible was placed in a muffle furnace that was kept at around 925°C for 90 min. The crucible was weighed again after cooling in desiccator. The volatile organic matter was calculated using equation (5) Carbon yield and Nitrogen content determination: the loss ignition method was used to determine the total carbon yield. Whereas, nitrogen (N) content of activated carbon was determined using Kjeldahl method. Then, the C:N was estimated from the individual values. Determination of pHPZC: the point of zero charge (PZC) was determined using the potentiometric mass titration approach described by Vakros et al. [30]. The experiment was carried out by dissolving 0.5 g, 1.0 g, and 1.5 g of coffee husk activated carbon in an electrolytic solution containing 0.1 N NaNO3 in 50 mL of distilled water under N2 atmosphere and equilibrating the aqueous suspensions for 1 h to reach. According to the protocol, a 2 g sample was placed on a crucible and heated at 950°C for 2 hrs [31]. It was computed by dividing the weight of the dried carbon sample by the weight of the carbon retrieved from the furnace

Photo of (a) raw coffee husk, (b) activated coffee husk carbon, and (c) Powdered activated coffee husk carbon.

2.2. Characterization and Preparation of Adsorbate Solutions
A wastewater samples were collected using a 5 L plastic bottle from the Hibret manufacturing and machine building electroplating company, which is located around Mexico in Addis Ababa City, Ethiopia. Then, selected physicochemical water quality parameters such as total suspended solids (TSS), total dissolved solids (TDS), pH, EC, salinity, and Cr were determined using a standard approach outlined in Stevens [32] at Addis Ababa University, Center for Environmental Science laboratory. The samples were treated with HNO3 to keep the Cr ion in solution and stored at 4°C until analysis. Adsorbent solutions were prepared from electroplating wastewater sample by appropriate dilution.
2.3. Kinetics and Equilibrium of the Study
To examine the kinetics of the adsorption process, a stock solution was prepared by taking a 100 mL of sample in a 250 mL flask. Following that, a series of tests were carried out by using various adsorbent doses and other parameters, and all were alternatively held constant, as indicated in Table 1. After that, the sample was placed in the shaker and removed every 5 min to check for residual metals in the solution until equilibrium was reached.
Optimization of the effect of pH, contact time, agitation speed, adsorbent dose, and initial concentration of Cr at room temperature.
2.3.1. Adsorption Isotherm
For the adsorption isotherm experiment, different adsorbent dosages of 0.5, 1, 1.5, 2, 2.5, 3, and 3.5 gL-1 were used for Cr under consideration while keeping other parameters such as pH, agitation speed, contact time, and beginning metal concentration constant. The results of this experiment were analyzed using the Langmuir, Freundlich, and Temkin adsorption isotherm models [33].
2.3.2. Sorption Isotherms
For equilibrium description, both the Langmuir and Freundlich models were investigated. Based on a theoretical model, the Langmuir equation implies monolayer adsorption across an energetically homogenous adsorbent surface. It ignores interactions between molecules that have been adsorbed. The following equation (7) was used to represent it:
2.4. Batch Adsorption Studies
The effects of adsorbate concentration, adsorbent dosage, agitation time, and pH were examined in batch mode adsorption studies for Cr using a 250 mL conical flask. Residual Cr metal in the solution was filtered and evaluated using a Whatman number 0.45 m filter paper and a flame atomic absorption spectrometer (novAA400P, Germany). Equations (8) and (9) were used to obtain the percent adsorption and adsorption capacity of activated carbon, respectively.
where
The mass balance principle was used to calculate the activated carbon’s adsorption capacity, which was defined as the concentration of the Cr on the adsorbent mass.
2.5. Adsorption Isotherms and Kinetics
The adsorption isotherm of the activated carbon was assessed using pseudofirst-order and pseudosecond-order kinetics [36]. The adsorption kinetic experiment was conducted at an initial concentration of 40 mgL-1, an adsorbent dosage of 20 gL-1, and pH 7. The residual concentration was measured at the different time interval.
2.6. Desorption Studies
The adsorbent Cr desorption capacity was studied using 0.1 M, 0.5 M, and 1 M hydrochloric acid and deionised water. The hydrogen ion protonates the adsorbent surface by replacing the adsorbed Cr metal ion on the adsorbent surface, resulting in the desorption of positively charged metal ion species and 0.1 M sodium hydroxide, which desorbs negatively charged ions due to the presence of excessive hydroxide. After that, the desorbed adsorbate in the solution was separated by filtration and analyzed for the corresponding metal ion concentration. The percentage recovery was calculated using equation (10) [37].
where desorbed is the concentration and/or the mass of the metal ion in desorbing solution after the desorption process, and adsorbed is the product of
2.7. Data Analysis
The Fourier transform infrared (FTIR) spectrometer (Model 65 spectrometer, USA) was used to identify the functional groups before and after Cr metal adsorption in the activated carbon in the wave number range of 400–4000 cm-1. For this purpose, a 1 mg of activated carbon (< 20 μm) was placed on KBr disk and dissolved with 10 drops of paraffin. Then, the KBr disk with the sample was immediately put into the sample holder. Samples were subjected to FTIR. Data analysis was made using Origin Lab 8.0 statistical software, and descriptive statics were also used to describe the results obtained from the experiment.
3. Results and Discussion
3.1. Physicochemical Properties of Coffee Husk Activated Carbon
Table 2 shows the physicochemical properties of an activated coffee husk carbon. One of the most important properties that impact the adsorbent adsorption capacity is pH. The pH of coffee husk activated carbon in this investigation agrees with Malik [38] (Table 2). Coffee husk activated carbon had a moisture content of 1.07%, which was lower than the study report value of Dula et al. [39] (Table 2), allowing for increased adsorbent capacity. Activated coffee husk carbon had 5.98% ash content. This low ash level indicating that it has a higher adsorption capacity and efficiency [8], whereas the adsorbent had more carbon content and can serve as a high-quality adsorbent. Table 2 shows that the carbon content of activated carbon was 69%, which is significantly higher than Köseoğlu and Akmil-Başar [40]. Furthermore, it had fewer amounts of nitrogen compounds, and thus, indicating that different carbonaceous groups may be available for metal adsorption. In other words, the very low amount of nitrogen indicates that the coffee husk may have a very low percentage of protein, which is more preferable to protein-rich adsorbents [17]. Other important physical properties of the activated coffee husk carbon were pore volume, particle size, porosity, surface area, and carbon: nitrogen ratio, which values were 0.802 mLg-1, 250-500 μm, 94.96%, 1260 (m2g-1), and 8.38:1 respectively, and all have an important role in effective adsorption process of heavy metals. For example, adsorbents with a bigger surface area have a higher heavy metal binding capability, allowing for greater removal efficiency. In argument to this, the activated coffee husk carbon has a high Cr binding ability from the electroplating wastewater.
Comparison the activated coffee husk carbon physicochemical characteristics with other research findings.
Figures 2(a) and 2(b) show the morphology of the activated coffee husk carbon after and before adsorption. Surface topography of activated coffee husk carbon before and after adsorption was observed to be different in SEM pictures. Figure 2(a) shows how Cr adsorption has covered active sites of adsorbents. However, as seen in Figure 2(b), activated coffee husk carbon possesses a porous shape that is conducive to adsorption. After Cr adsorption, a layer forms on the adsorbent surface, and some Cr has also filled the pores, as shown in the SEM photomicrograph.
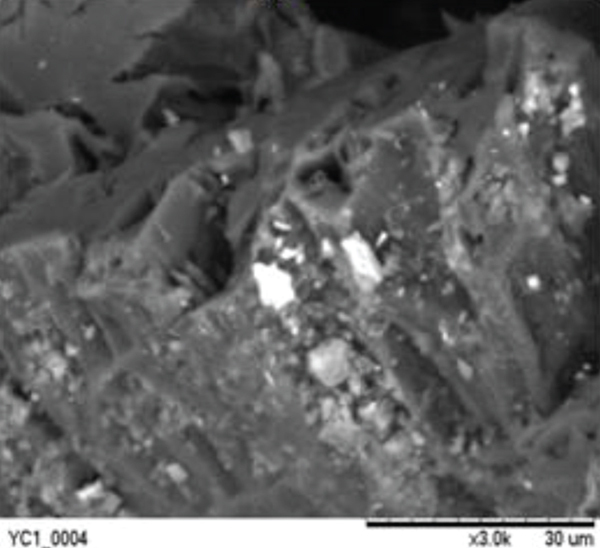
SEM micrograph of coffee husk activated carbon (a) after adsorption (b) before adsorption.

Figure 3 depicts the pH of the activated coffee husk carbon’s point of zero charge (pHPZC). The value was revealed to be 5.07. In a study conducted by [44], the pHPZC for activated carbon from saw dust was found to be pH 5.3. The value of zero charge denotes a point where the number of positive (protonated) sites equals the number of negative (deprotonated) sites [45]. As a result of the present study, it was revealed that an adsorbent’s surface acquired a positive charge below pH 5.07 and a negative charge above pH 5.07, indicating that negatively charged ions are attracted and/or bound by the adsorbent below pH 5.07 but repelled above this pH because adsorbents’ surfaces become negatively charged, allowing them to attract and bind positively charged ions in the solution.

pH of point of zero charge (pHPZC) of coffee husk activated carbon.
3.2. Electroplating Wastewater Physicochemical Properties
The Cr concentration in raw electroplating wastewater was 450 mgL-1(Table 3). This heavy metal concentration was higher than that found in Gandhi [46] that might be due to differences in the chemicals used in the electroplating and cleaning processes. Furthermore, as compared to the recommended national discharge standard limit for surface discharge national, i.e., 1 mgL-1 total Cr concentration [47], the present finding was also significantly higher, and its discharge into a nearby river poses serious environmental and health risks.
Electroplating wastewater physicochemical characteristics.
ppm: part per million; SD: standard deviation.
3.3. Factors Affecting the Adsorption Efficiency of Activated Coffee Husk Carbon
3.3.1. Effect of Adsorbent Dosage
The adsorbent dose effect was assessed by keeping other parameters constant and results a substantial impact on Cr adsorption (Figure 4(a)). As shown in Figure 4(a), the maximum removal of Cr (98.4%) was observed at 20 gL-1 adsorbent dose, but, after 20 gL-1, the adsorption efficiency was decreased. In contradict to this finding, Yu et al. [48] had observed an improved removal efficiency of metal ions as the adsorbent concentration increased. This could be owing to the increasing surface area of the adsorbent and the increased number of adsorption sites. However, the decrease in Cr adsorption efficiency in this study might be due to the increased adsorbent dose, which completely covers the accessible active sites of the adsorbents. Similarly, the adsorption capacity expressed in mgg-1 was decreased as the adsorbent dose increased (Figure 4(b)). The decreased adsorption capacity might be due to the adsorbent dose is increased [49].

Adsorbent dose effects on Cr (a) % RE and (b) mass adsorption efficiency (mgg-1).

3.3.2. Effect of Agitation Speed
This effect analysis showed that an increased agitation speed increased Cr removal (Figures 5(a) and 5(b)). Adsorption efficiency increased from 71.4% to 86.523% when the agitation speed was increased from 30 to 200 rpm (Figure 5(a)). In agreement with the present study, Saifuddin and Kumaran [50] reported that an increase in agitation speed from 30 to 150 rpm enhances the diffusion of metal ions towards the adsorbent surface and increased the adsorption capacity from 1.428 to 1.732 mgg-1. However, in this study, when the agitation speed was increased above, 150 rpm decreased the adsorption efficiency. This could be linked to metal ion desorption from the adsorbent surface as a result of excessive agitation speed [51]. Because the adsorption rate is influenced by the stirring speed, for example, low agitation speed causes a thicker film layer of solvent [52], whereas the thickness of the solvent film layer becomes thin as the stirring speed increases. As a result, the metal ions travel very quickly through the film layer, and diffusion via the pores becomes the rate-controlling step [53]. Because the rate-controlling step is the slowest, the adsorption rate is regulated via diffusion through pores.

Agitation speed effects on Cr (a) % RE and (b) mass adsorption efficiency (mgg-1).

3.3.3. Effect of Contact Time
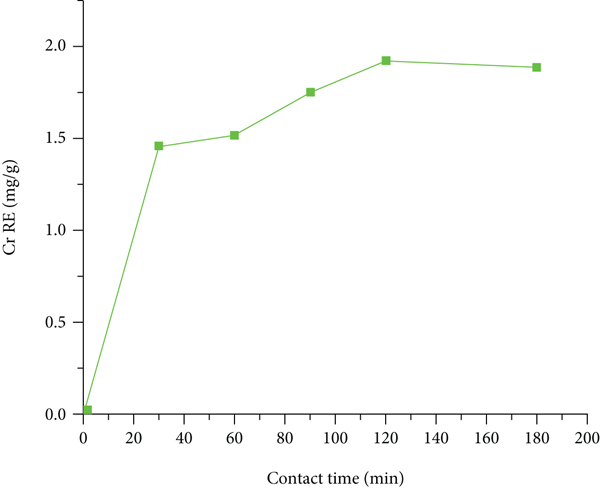
The contact time effect was also assessed, and its effect on the adsorption capacity of activated coffee husk carbon was shown in Figures 6(a) and 6(b).The results showed that at the initial contact time, the Cr adsorption efficiency was high. But later on, it showed a decreased rate of adsorption. The high adsorption efficiency achieved might be due to the concentration of Cr metal on the adsorbent surface, which corresponds to the huge number of free binding sites [49]. In this study, increasing contact time increased adsorption efficiency, but as contact time further increased, the efficiency fell and turned sharply at the optimum contact time of 120 min with removal efficiencies of 96.1% (Figure 6(a)). There was a delayed observable decrease in residual Cr concentration at the equilibrium point after 120 min of contact time. The quantity of Cr metal adsorbed on the adsorbent was in dynamic equilibrium with the amount of Cr metal desorbed at this point, and the increment became steady after that. Figure 6(b) shows a mass adsorption efficiency of 1.92 mgg-1 Cr after 120 min of contact time. As a result, 120 min of contact time was chosen as the optimum adsorption condition. According to Thakur and Parmar [53], the adsorption of metal ions increases also significantly in time up to the first 30 min and reaches a peak at 120 min. This high initial adsorption capacity could be attributable to an increase in the number of active binding sites available on the adsorbent surface. The minimal adsorption efficiency seen as time progressed could be attributed to the restricted number of active sites, which get occupied with time.

Contact time effects on Cr (a) % RE and (b) mass adsorption efficiency (mgg-1).
3.3.4. Effect of pH
The influence of pH on the extent of Cr metal adsorption on activated coffee husk carbon showed significant variation as pH value oscillates in between 2.0 and 11.0. As pH varied from 2.0 to 7.0, the adsorption efficiency was fluctuating between 82.68% and 97.62%. However, the Cr adsorption efficiency was decreased before pH 2.0 and higher after pH 7.0 (Figure 7(a)). Similarly, Kyaz [54] reported a decreased heavy metal removal efficiency at pH less than 2.0 and an increased metal removal efficiency at pH 7.0. However, further increasing the pH value revealed a significant drop in adsorption efficiency [55]. Figure 7(b) also revealed that for pH values ranging from 2.0 to 7.0, Cr adsorption capacity in mgg-1 showed an increasing trend. Following that, it decreased with an increase in pH value ranged from 7.0 to 11.0, which could be due to a weakening of the electrostatic force of attraction between the oppositely charged absorbent and adsorbent [56]. When the pH was raised from 2.0 to 7.0, the adsorption capacity of Cr rose from 1.71 to 1.95 mgg-1. However, at pH 7.0, the greatest adsorption capacity and removal efficiency were observed. The surface of the adsorbent becomes protonated under acidic conditions, and thus, attracting anionic Cr species. As the pH was increased above 7.0, there was a decreased in the electrostatic attraction between the adsorbent surface and Cr species, which consequently decrease the adsorption efficiency. Thus, the initial solution pH of 7.0 was chosen as the optimum pH value for Cr adsorption for all the remaining experiments.

pH effects on Cr (a) % RE and (b) mass adsorption efficiency (mgg-1).

3.3.5. Effect of Initial Cr Concentration
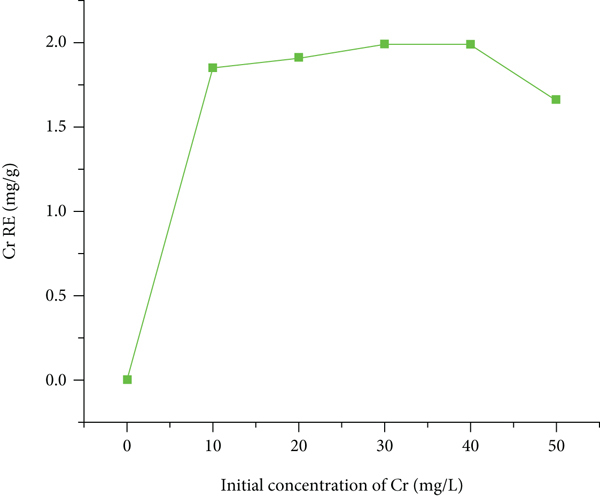
The effect of initial concentration on the Cr removal efficiency of activated coffee husk carbon was examined, and the result revealed that as the initial Cr concentration increased from 40 to 50 mgL-1, Cr removal efficiency was decreased from 99.65% to 86.48% (Figure 8(a)). This decreased in Cr removal might be due to saturation of the adsorbent sites with a certain concentration, leaving fewer active sites available for Cr ions [57]. Simultaneously, as the initial Cr concentration increased, the Cr adsorption capacity was increased (Figure 8(b) might be due to the minimal number of moles of Cr metal ions, which are accessible adsorption sites on the adsorbent at lower concentrations, and boosts the adsorption capacity). However, further increased of Cr concentrations favors majority of the adsorption sites to be occupied by ions, leaving fewer available sites, and decreased the Cr metal ion adsorption capacity [57].

Initial Cr concentration effects on (a) % RE and (b) mass adsorption efficiency (mgg-1).
3.4. Adsorption Isotherm
The Langmiur’s equation,

Cr adsorption isotherm (a) Langmuir and (b) Freundlich.

Figure 9(b) shows that the Freundlich isotherm regression coefficient was 0.987, which is higher than the correlation coefficient of the Langmuir isotherm model (0.983), and implies that Cr adsorption on activated coffee husk carbon was heterogeneous with a finite number of sites distributed uniformly over the activated carbon surfaces [62]. From slop, the 1/
The mathematical transformation of the isotherm equation was used to find the above straight line equations. The estimated model parameters with a correlation coefficient (
Langmuir and Freundlich constants for the adsorption of Cr.
3.5. Adsorption Kinetics
The adsorption kinetic of Cr is depicted in Figures 10(a) and 10(b). A straight line plot of log (

Adsorption kinetics plot of Cr at (a) pseudofirst order and (b) pseudosecond order.

3.6. Cr Desorption Studies from Activated Coffee Husk Carbon
The outcome of the Cr desorption investigation from the adsorbent is presented in Figure 11.

Cr desorption from coffee husk activated carbon.
Desorption of Cr increased with an increase in pH, as shown in the graph. The desorption of Cr from a Cr-loaded adsorbent increased when the initial pH increased, which could be attributed to the presence of hydroxyl ions, which could release Cr ions from the adsorbent via an ion exchange mechanism.
At pH 11, activated carbon desorbed 12.86% of the Cr. As a result of the alkali solution, the Cr ions were desorbed. According to Meitei et al. [65], the results of alkali metal desorption imply either chemisorptions or ion exchange as a plausible mechanism for metal ion attachment to activated carbon.
3.7. FTIR Analysis
Figure 12 shows the functional groups that exist in the activated coffee husk carbon before and after adsorption. A C–O vibration (e.g., –COOR group) was observed with a broad band between 1580 cm-1 and 1573 cm-1. Similarly, a broad band of bound –OH groups was observed between 3438 cm-1 and 3404 cm-1, which might be due to the fact that the O-H stretching peak is broad and has a rounded tip. Asymmetric –CH2–, symmetric –CH3–, and asymmetric –CH2– stretching vibrations were observed between 2929 cm-1 and 2849 cm-1. The amide absorption was also observed in between 1615 and 1701 cm-1. The weak absorptions observed at 1738 and 1721 cm-1 are attributed to the ester C = O stretching vibrations of phospholipids 2953–2856 cm-1, which shows the presence of C–H asymmetric stretching bonds related to the methyl CH3 group in the coffee husk molecule and can be successfully used to develop predictive models for quantitative analysis of activated coffee husk carbon [66]. Between 1394 and 1383 cm-1, symmetric –CH3 stretching vibrations were found. Furthermore, the CH=CH group has peaks around 1600 cm-1, and the C=C group has peaks about 1652–1617 cm-1. At 1035 cm-1, the C–O band absorption peak was also seen. These sorts of functional groups play an important role in metal binding as sorption sites [12].

FTIR spectrum of activated coffee husk carbon before and after adsorption.
4. Conclusion
The laboratory scale adsorption experiment showed that activated coffee husk carbon is a good alternative option for removing Cr from electroplating wastewater due to its high quality characteristics in terms of carbon, porosity, C/N ratio, and surface area. The Cr adsorption efficiency was influenced by pH, contact time, adsorbent dosage, and initial metal concentrations. Besides, SEM surface morphology studies also revealed that the adsorbent was porous and good for adsorption. However, the optimization process results the maximum removal efficiency of Cr from the raw electroplating wastewater at 120 min contact time, 40 mgL-1 initial concentrations, 150 rpm agitation speed, 7.0 pH, and 20 gL-1 adsorbent dosage. Strong Langmuir and Freundlich isotherm linear fits were observed for the Cr adsorption, indicating that the data was acceptable. Identified functional groups such as alcohols, phenol, alkanes, aldehydes, carbonyls, aromatics, and carboxylic played an important role in Cr adsorption. This study demonstrated that reuse of locally available absorbent materials for the removal of heavy metals from wastewater will be promising due to their cost and treatment effectiveness.
Footnotes
Abbreviations
Data Availability
The data is available in the hands of the corresponding author. Hence, we will delivered upon requesting.
Disclosure
In addition, this publication is part of my MSc Thesis, which is available as a preprint on the Addis Ababa University research portal.
Conflicts of Interest
The authors declare no conflicts of interest.
Acknowledgments
The first author appreciates the laboratory facilities provided by the Addis Ababa University, College of Natural Science, Center for Environmental Science, and I am grateful to my colleague Ermias Alayu, who assisted me in the production of this manuscript despite being a co-author.