
Abstract
The graphene oxide (GO) interaction with methylene blue (MB) cationic dye was studied in an aqueous solution at different pH during MB adsorption. The mutual interaction of MB with GO surface was studied and evaluated by Fourier transform infrared spectroscopy (FTIR) and X-ray diffraction (XRD). The π-π and electrostatic interaction of MB with GO surface are the main types of interactions, and the XRD data show the monomeric arrangement of MB cation with GO. The GO surface functional groups and point of zero charge (PZC) were determined by acid-base titration. Suitability of zeta-potential measurement and acid-base titration method was briefly discussed. The quality of prepared GO was evaluated by Raman spectroscopy, XRD, and atomic force microscope (AFM). The experimental adsorption equilibrium data were analyzed using Langmuir, Langmuir-Freundlich, Freundlich, and Temkin isotherms. The GO maximum adsorption capacity increases with higher pH, that is ascribed to the facile interaction of negatively charged GO with positively charged MB structure.
1. Introduction
The growth of the textile industry is responsible for the increasing pollution, mainly in the water environment. The textile industry commonly uses plenty of dyes, representing potential dangers for nature and health [1]. Moreover, many dyes are toxic and carcinogenic and can also consume dissolved oxygen and destroy aquatic life. In nature, dyes could undergo various types of reactions whose products could be more toxic and dangerous for living beings [2]. Therefore, it is important to look for efficient methods and materials for their removal. Many methods have been suggested for wastewater treatment and dyes removal, like adsorption [3, 4], biodegradation [5, 6], oxidation [7, 8], or photocatalytic degradation [7, 9–11]. Adsorption belongs to the simplest, noncomplicated, and low-cost method for removing various types of pollution, including dyes. Various types of adsorbents such as carbon-based materials [2, 12–16], chitosan [17], layered double hydroxides [3, 18, 19], cotton fibers [20], montmorillonite [21, 22], metal oxides, and metal oxide composites [23–25] have been studied for the adsorption of various dyes. Other materials that are often used to remove dyes include doped conducting polymers, like polyaniline doped by boron nitride [26], chitosan-grafted-polyaniline doped with Co3O4 [27], and polyaniline/Co3O4 nanocube composite [28], or polyaniline/SrTiO3 nanocubes [29], and those composites were successfully applied in adsorption or photocatalytic degradation methyl orange and MB dyes [26–29]. These materials are becoming more popular as they offer a wide range of applications such as sensors, adsorbents, photocatalysis, and batteries [26–29]. GO and its composites belong to the aforementioned popular adsorbents [30, 31]. GO belongs to the carbonaceous materials with an ideal two-dimensional structure with carbon atoms assembled to the honeycomb structure. The presence of various types of oxygen-containing surface functional groups (carboxyl, hydroxyl, epoxy, and carbonyl) belongs among the greatest GO benefits. These surface groups facilitate and contribute to the adsorption process via π-π stacking, hydrogen bonding, and electrostatic forces, such as van der Waals forces. They act as a weak acid cation exchange material, allow various GO modifications [32–36], and also complexation with positively charged molecules (dyes, pesticides, metal ions, etc.) [13, 14]. The information such as the GO surface hydroxyl group number and their effect on the adsorption process is limited in the scientific papers. GO-based materials with different degrees of oxidation were successfully applied in removing MB dyes with maximum adsorption capacity from 48.8 to 598.8 mg/g [37]. GO prepared by Hummer’s method or GO/calcium alginate was used in MB adsorption with a maximum adsorption capacity of 476.2 mg/g and 181.8 mg/g, respectively [38, 39]. According to Chen et al. [37] and Ramesha et al. [13], reduced GO can also be involved in removing the dye, with a relatively low adsorption capacity of 91 and 17.3 mg/g, respectively. MB (Figure 1) belongs to the widely used dying agents for coloring silks, cotton, paper, temporary hair color, wools, etc. [12, 16]. It is also used in medicine, analytical redox indicator, and aquaculture [2]. MB can have some negative effects on human health, including headache, confusion, high blood pressure, and vomiting [40, 41].

Methylene blue structure (CAS 61-73-4).
In this paper, we prepared monolayer GO by a simple ultrasound exfoliation process of natural graphite with subsequent oxidation, and we compared the adsorption ability of GO at various pHs for MB removal from an aqueous solution. In order to establish the GO removal capacity, different models of isotherms (Langmuir, Langmuir-Freundlich, Temkin, and Freundlich) were fitted to the experimental data. Besides, the MB adsorption kinetics were studied, and mathematical models for the pseudo-first order and pseudo-second order were applied for measured data. The Langmuir and Langmuir-Freundlich isotherms were used to obtain the maximum adsorption capacity, whereas the Temkin model was used to evaluate some indirect interaction of MB with GO. Raman spectroscopy, transmission electron microscopy (TEM), AFM, and zeta-potential were used for GO characterization, and the data combination from these methods was used to identify and characterize the mutual interactions of MB with GO structure. The GO surface functional groups (carboxylic and hydroxyl) were determined with simple and verified acid-base titration, and the effect of GO surface functional groups on MB adsorption was discussed. The suitability of zeta-potential measurement and acid-base titration method was discussed. The FTIR and XRD were used for GO characterization and analysis of the adsorbent before and after dye adsorption and for discussion of possible adsorption mechanisms. Based on FTIR and XRD data, specific interactions of surface groups with MB were shown and confirmed.
2. Experimental
2.1. Chemicals
All purchased chemicals were analytical reagent grade. MB (≥95%; calc. to the dried substance) was purchased from Sigma-Aldrich (Germany). The chemical reagents for preparation of Britton-Robinson buffer (BRB), i.e., CH3COOH, H3BO3, NaOH, and H3PO4 were purchased from Lach-Ner Ltd. The BRB solution was prepared according to the standard procedure published elsewhere [42]. Briefly, two solutions A and B were prepared. Solution A consists of a mixture of H3BO3, H3PO4, and CH3COOH with the concentration of each compound at 0.04 mol/L. Next, solution B was prepared by dissolving solid NaOH to obtain a solution with a concentration of 0.02 mol/L. By mixing solutions A and B, the solutions with the required pH (3.0, 7.0, and 11.0) were prepared. The stock solution of cationic MB dye (0.5 g/L) was prepared in BRB (
2.2. Preparation of Sample
2.2.1. Preparation of Graphene
Graphene sheets were prepared by exfoliation of natural graphite (1 g) in a bath ultrasound reactor UIP 2000hd (2 kHz, max. 2000 W, Hielscher Ultrasonics GmbH, Germany) under a high pressure of 5 bar in ethylene glycol (100 mL) [43]. The product was purified by dialysis with Spectra/Por 3 dialysis membrane in demineralized water to stable conductivity and constant pH.
2.2.2. Preparation of Graphene Oxide
The dried exfoliated graphite (1 g) was mixed with H2SO4 (60 mL) and H3PO4 (10 mL) in a round-bottom flask. KMnO4 (3 g) was carefully added last. The reaction mixture was slowly heated to 40°C for 48 h. The additional KMnO4 (1.5 g) was added in smaller doses and stirred for 3 days at the same temperature. Thereafter, the mixture was left to cool down to laboratory temperature and slowly added to the ice mixture with H2O2 (200 mL) [44]. The resulting product was purified by dialysis with Spectra/Por 3 dialysis membrane in demineralized water to constant pH and stable conductivity.
2.3. Characterization of Samples
The FTIR spectra were recorded on a diffuse reflectance spectrophotometer Nicolet 6700 IR (Thermo Scientific, USA) in transmittance mode in the 4000−400 cm−1 wavenumber range at 100 scans per spectrum with 4 cm−1 resolution. Software OMNIC 7.3 was used for raw data processing. The GO sample for FTIR was firstly lyophilized (24 h) and subsequently grounded with KBr in a ratio from 1 : 100 to 1 : 400 in an agate mortar and then in a ball mill (5 min). A hydraulic press (80 kN, 5 min) was used to prepare KBr pellets of 13 mm in diameter.
Raman spectra were collected using a DXR Raman microscope (Thermo Scientific, USA) the following way: 256 two-second scans were acquired with a 532 nm laser (0.5 mW), 25 μm slit under a 10× objective Olympus microscope in full range with distinction of 2 cm−1. Crystal phase analysis was performed using Bruker D2 (Germany) with the LYNXEYE 1-dimensional detector (CuKα radiation, 30 kV, 10 mA). The primary divergence slit module width of 0.6 mm, Soler Module 2.5, Airscatter screen module of 2 mm, and Ni Kbeta-filter of 0.5 mm were used in the range of 5-90°, step of 0.00805°, and time per step of 1.0 s. The XRD sample patterns after interaction with MB were processed by the following procedure. First, the GO suspension (0.1 mL) was mixed with MB solution (2.1 mL, 0.2 g/L) in 4 mL vials and were shaken for 4 h. Further, the samples were centrifuged (30 min, 10 000 RPM), washed four times with deionized water, and followed by centrifugation (shorter time). Finally, the samples were transferred to a silicon wafer, dried and measured.
Morphology of the samples deposited on microscopic copper grids covered by a transparent amorphous lacey carbon film was investigated using HRTEM FEI Talos F200X (Japan) at 120 kV. The obtained micrographs and SAED patterns (Selected area electron diffraction) were processed and evaluated by the TIA (TEM Imaging & Analysis software, FEI Company). AFM measurements were performed using Bruker Dimension Microscope (Germany) in ScanAsyst-air contact mode to determine lateral size and height profile of GO sheets. An aqueous suspension was pipetted onto mica support prior the measurement.
2.4. Titration of GO Sample
According to our procedure published in our previous work [44], acid-base titration was used to determine the number of surface functional groups, i.e., carboxylic and hydroxyl. Titration of GO sample was realized by automatic titrator 794 Basic Titrino (Metrohm, Switzerland) with potentiometric endpoint determination. GO water suspension containing 4 mg of solid in the initial volume (4 mL) was titrated with sodium hydroxide solution (0.1 mol/L) under continuous stirring and a nitrogen atmosphere. Equivalence points were evaluated from titration curves transformed in the 1st derivation curves.
2.5. Sorption Experiments
Free MB dye in an aqueous solution was evaluated and measured by the double-beam UV/VIS spectrophotometer Cintra 2020 (GBC Scientific Equipment, Australia) controlled by Cintral software vs. 2.6. All adsorption experiments were realized in the Eppendorf vials (2 mL) at
The
2.6. Kinetic Study Experiment
The batch adsorption experiments in a beaker (50 mL) were used to study the adsorption kinetics. MB stock solutions in BRB (0.5 g/L, 32 mL), BRB (6 mL), and GO suspension (2 mL) were pipetted into the beaker. The initial MB concentration for the kinetic study was 400 mg/L. The beaker was placed on the magnetic stirrer. At selected times, aliquots were taken into the Eppendorf vials (2 mL). The Eppendorf vials were centrifuged for 30 min at 14 000 RPM and immediately the absorbance of free MB dye was measured by UV/VIS spectroscopy at 658 nm. The previously obtained calibration curves were used to calculate the concentration of free MB dye in the solution.
2.7. Zeta Potential Measurements
Zeta potential of prepared particles was monitored by electrophoretic light scattering (ELS) measurement performed on Lizesizer™ 500 (Anton Paar, Austria) coupled to a Metrohm automatic titrator with an 867 pH module and an 846 dosing interface controlled by the software Kalliope™. The temperature was 25°C, the initial pH was 11, and the final pH was 2, with a step of 0.5 modified with 0.5 M of HCl or NaOH with stabilization time of 5 min per step. The Smoluchowski approximation method was used.
3. Results and Discussion
3.1. Sample Characterization
The Raman spectrum (Figure 2(a)) shows typical GO bands G (~1591 cm–1) and G
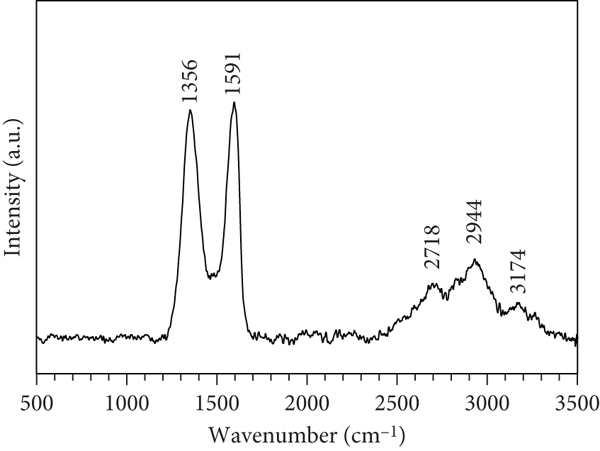
Raman (a) and XRD pattern (b) of prepared GO sample.
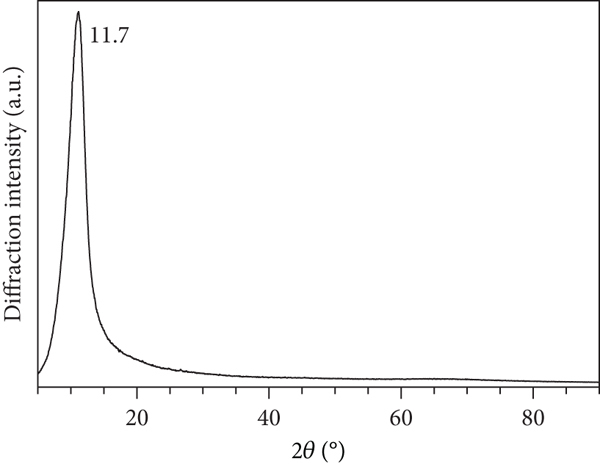
XRD patterns of prepared graphene oxide (GO) are shown in Figure 2(b). A broad and very strong peak localized at 11.7° is characteristic for interplanar
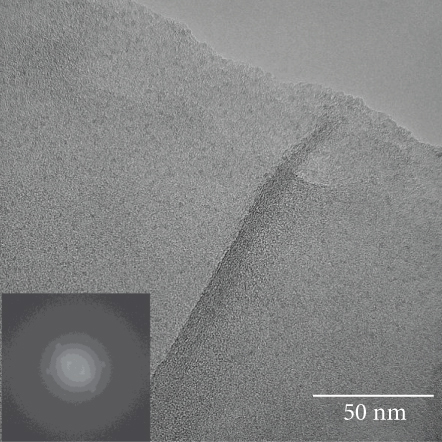
HRTEM image of the prepared GO shows monolayered sheets (Figure 3(a)). In Figure 3(b), the fast Fourier transform (FFT) is shown where the points in the GO hexagonal honeycomb structure are present; i.e., it confirms that the plate is a monolayer. Figure 3(c) shows the TEM image with SEAD analysis of GO (inlet) which revealed a spot pattern, which proves single-layered GO. From the TEM image (Figure 3(c)), the presence of the monolayer is not clearly visible; therefore, the data from the AFM are present. GO AFM image shows large differences in the lateral size of GO sheets with a height profile of 1 nm in all measured cases (Figure 3(d)).

HRTEM image (a), FFT analysis (b), TEM image with SAED patterns (c), and AFM image with height profile (d) of GO sample.


3.2. Evaluation of Surface Hydroxyl Groups
The potentiometric titration was used to evaluate surface functional groups. The measured titration curve with the 1st derivation is shown in Figure 4(a). Two equivalence points (EP1 and EP2) were present on the titration curve. According to our previous research, the EP1 corresponds to the NaOH consumed to neutralize the carboxylic groups type (
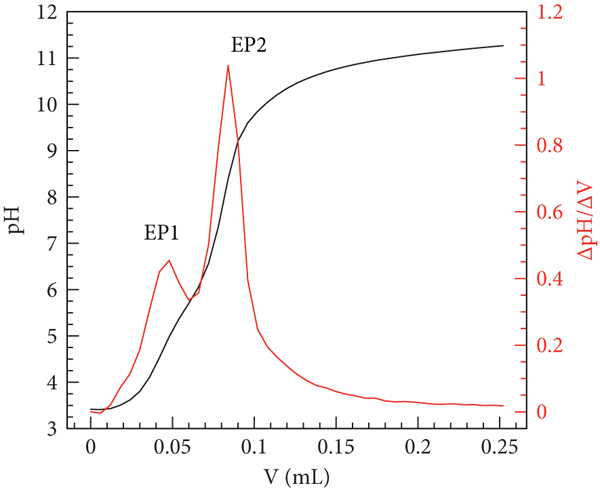
(a) Titration curve with the 1st derivative curve of the prepared GO sample with two distinct equivalent points (EP1 and EP2). (b) Curve corresponding to the total concentration of protons consumed in the titration process (TOTH). The inset plot present pH corresponds to the point of zero charge (PZC).
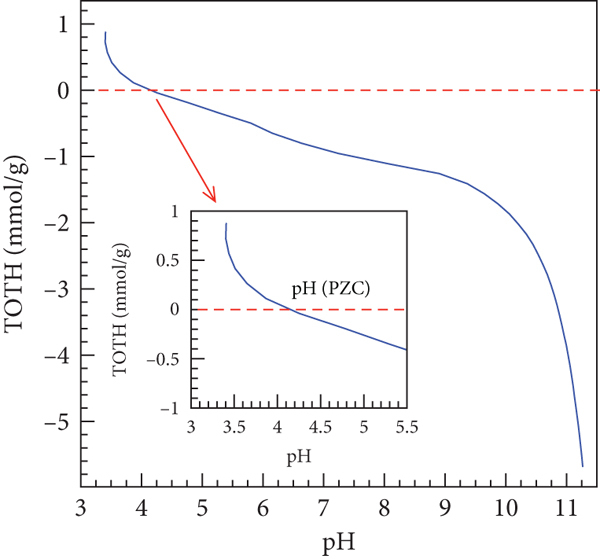
The measured titration curve was transformed into the curve corresponding to the total concentration of protons consumed in the titration process (TOTH, see Figure 4(b)) and can be calculated by [14, 56]
In Equation (2),
The amphoteric behavior of GO surface groups provides the ability of the GO material to become positively or negatively charged depending on solution pH. The hydroxyl and carboxyl groups exhibit amphoteric behavior. The TOTH curve in Figure 4(b) shows the ability to release or associate protons per solid weight into or from the solution. The positive TOTH values represent proton association and can be described by Equation (3). In contrast, negative values represent the opposite process (Equation (4)). The GO surface becomes positively charged at low pH values due to the proton association (TOTH positive values). In contrast, the GO surface becomes negatively charged at high pH values due to the proton release (TOTH negative values) [57, 58].
The TOTH curve (Figure 4(b)) shows that the GO surface was positively charged below
The high degree stability of GO nanosheets was confirmed by zeta potential measurements (
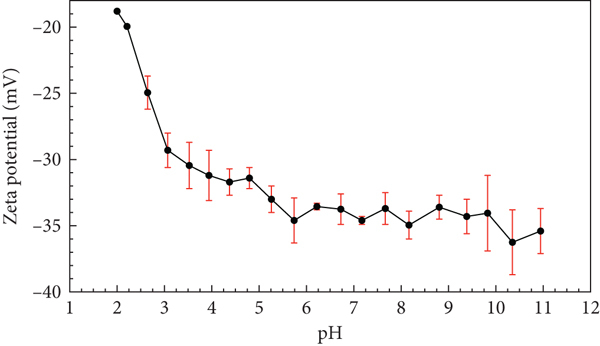
GO zeta potential change with pH.
The isoelectric point values (IEP) represent external surface charges of nanosheets in solution, at which the zeta potential of the surface or molecule is equal to zero. The IEP value indicates the pH at which the GO nanosheets do not move in an electric field [67]. Conversely, pH(PZC) is connected to GO nanosheets’ total net surface charge distributions (internal and external). The pH(PZC) values are defined as the negative logarithm of the activity of the potential determining ions at which the net surface charge distribution is equal
According to Menéndez et al. [67], the relatively low value of pH(PZC) showed the high acidity of GO material and, thus, an increased number of oxygen-containing surface groups with an acidic character. Acid-base titration as well as the zeta potential methods belong to the powerful techniques for GO surface characterization.
3.3. Adsorption Isotherm Data
The adsorption isotherms describe the relationship between the adsorbent and adsorbate in the equilibrium state. The relationship between the solution dye concentration and equilibrium state has been described by the most widely used Langmuir, Freundlich, Langmuir-Freundlich, and Temkin isotherms [4, 75, 76]. The experimental data for MB adsorption in an aqueous solution (
Monolayer adsorption on a homogeneous surface can be described by the Langmuir (L) adsorption isotherm. The Langmuir isotherm assumes the surface with a finite number of definite localized places which are identical and equivalent [13, 79]. The Langmuir adsorption isotherm in non-linear form can be expressed by
The Freundlich (F) adsorption isotherm is frequently used to describe the non-ideal and reversible adsorption at heterogeneous surfaces and to describe the adsorption process of organic compounds on carbon-based materials or molecular sieves [79, 80]. The formation of a monolayer is not limiting for this isotherm. The Freundlich isotherm can be expressed in non-linear form by
The Langmuir-Freundlich (LF) isotherm is a useful and flexible mathematical model, combining the advantages and behaviour of Freundlich and Langmuir isotherm [81]. The main advantage of LF isotherm is that, at low adsorbate concentration, it reduces to Freundlich isotherm. In contrast, at high adsorbate concentrations, it behaves as the Langmuir isotherm with monolayer adsorption capacity [79, 82]. The Langmuir-Freundlich isotherm can be expressed in a nonlinear form by
In addition, for the evaluation of some indirect GO-MB interactions, the Temkin isotherm was used. This model suggested that the adsorption heat of all the molecules in the layer linearly decreases with coverage [78]. The Temkin isotherm in a nonlinear form can be expressed by
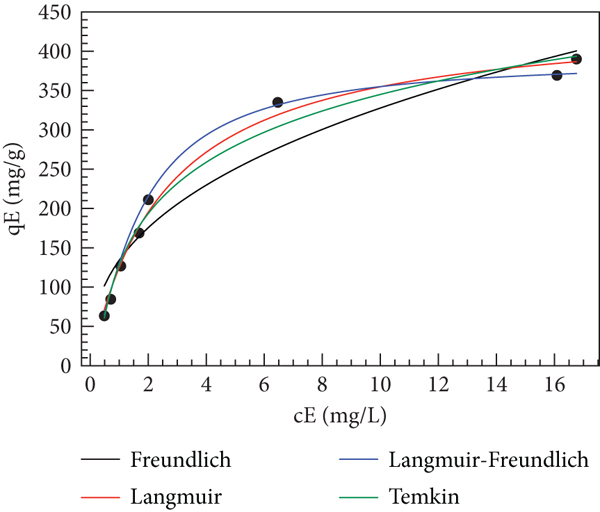
MB sorption experiments were performed in acidic, neutral, and basic pH values (3.0; 7.0; 11.0). The pH effect on the MB sorption process and adsorption isotherm data are shown in Figure 6, and isotherm parameters are presented in Table 1.
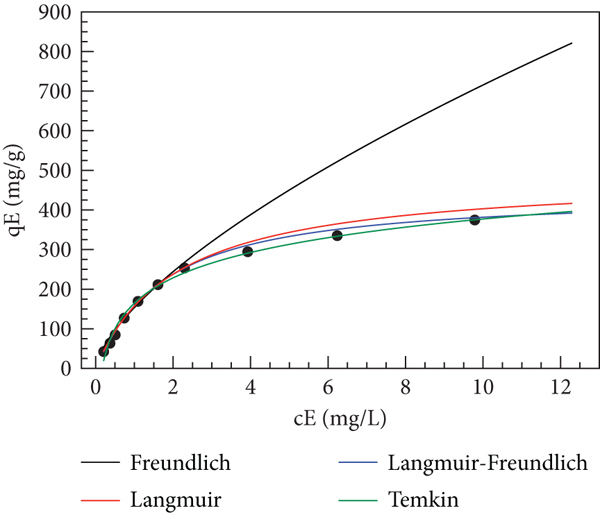
Fits of the Freundlich, Langmuir, Langmuir-Freundlich, and Temkin isotherms for the adsorption of MB on GO sample at

Freundlich, Langmuir, Langmuir-Freundlich, and Temkin model constants and correlation coefficients for the adsorption of MB by GO sample.
aFixed parameters.
In comparison with the other experiments on GO carried out by Li et al. [12] (2 times) and Ramesha et al. [13] (30 times) at
Comparison of GO adsorption capacity towards MB with other values from the literature.
The data summarized in Table 2 show significant differences in
The sorption process is describable at different pH values by various mathematical models. It shows the variability of the GO behavior and its ability to eliminate MB dye from aqueous solutions at different pH values. The calculated parameters (Table 1) have shown differences in MB sorption depending on solution pH. In acidic (
The Langmuir, Langmuir-Freundlich, and Temkin models appear to be the most suitable for the description of the MB sorption by GO under our conditions. The mathematical models (L and LF) suggested the creation of MB monolayer with GO active sites, which are identical and homogeneously distributed on the GO surface [16, 87]. Conversely, the Temkin mathematical model was used to evaluate the indirect MB-GO interaction. According to R2 values, the Temkin model can be evidently also used to describe MB on GO. The data obtained by a nonlinear fitting (Temkin model) suggested the presence of various indirect MB interactions with GO surface. Those indirect interactions probably come from the MB interactions with functional groups and GO carbon honeycomb structure (see Figure 7). The Temkin equilibrium binding constant

Potential interactions of MB dye with GO surface.
In contrast, the Freundlich mathematical model is not suitable for the description of MB adsorption concerning
The higher sorption ability of the GO sample is dependent on the pH. It can be most likely explained by the deprotonation of the GO surface functional groups, which support MB interaction with negatively charged GO surface [2, 92]. According to data published elsewhere, the GO materials with rich oxygen-containing functional groups showed and played an essential role in the increased adsorption capacity to radioactive iodine [93], arsenic(III) [85], cadmium [94], and MB [48, 91]. Oxygen-containing functional groups enable the formation of covalent bonding, electrostatic attraction, and cation exchange with MB dye. The MB adsorption mechanism can be attributed to (a) electrostatic/ionic interactions of positively charged MB structure with negatively charged –OH, carboxyl, carbonyl, and epoxy groups on the basal plane and edges of GO and (b) π-π interaction and conjugation based on the electron donor-acceptor interaction with honeycomb GO structure (see Figure 7). The adsorption mechanism involves mainly the interaction of π electrons in C=C bond in MB structure with the π electrons in the GO honeycomb structure [48, 91, 95].
Maximum adsorption capacity (L and LF) supports the above-mentioned effect of surface groups. The pH value greatly affects MB sorption, as demonstrated [2, 13], but contradicts the results of Liu et al. [92]. Adsorption efficiency for MB removal (at measured pH) achieved 98.2% (
A heterogeneity parameter (
Besides that, we calculated the separation factor (
Calculated values (0.05–0.475 g/L MB concentration range) have shown a favorable MB sorption process onto the GO sample under our experimental conditions. As shown in Figure 8,
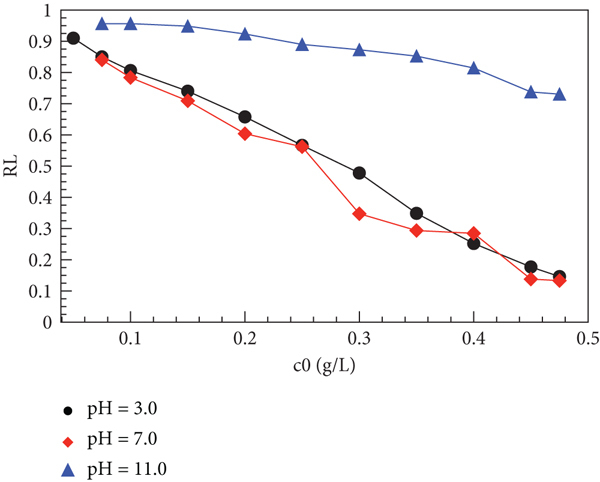
Separation factor value (
3.4. Kinetics Studies
To evaluate the effectiveness of the pH solution on the MB adsorption, the plot in Figure 9 shows the amount of MB adsorbed

The adsorption kinetics of MB at
To investigate the adsorption kinetics of MB dye on the GO, the pseudosecond-order kinetics model (10) and pseudofirst-order model (11) were tested. The pseudosecond-order and pseudofirst-order kinetics model in a nonlinear form can be expressed by [12, 97]
The adsorption kinetics parameters for MB adsorption on the GO.
The mutual correlation of measured and calculated parameters is complicated. Thus, we tried a correlation between the maximum adsorption capacity (

Mutual correlation of maximum adsorption capacity
3.5. Characterization of Samples before and after Sorption of MB by FTIR
The FTIR spectra of prepared GO sample are shown in Figure 11. The most intensive bands are localized in the 3800–3000 cm–1 region, corresponding to the stretching vibration of O—H bonds in hydroxyl from carboxyl groups and residual water intercalated in the GO sheets. The further bands were localized in the 2000–1000 cm–1 fingerprint region. The vibration band found at 1732 cm–1 is the characteristic of stretching vibration of C=O bonds in carboxylic groups [99–101]. The C=C stretching vibration (for carbon with sp 2 hybridization) in GO was localized at 1625 cm–1 [56, 100, 101]. The bands corresponding to the bending and stretching vibration of alkoxide (C—O) and epoxides (C—O—C) functional groups were found at 1226 and 1078 cm–1 [99–101].

(a) FTIR spectra of prepared GO sample, MB cationic dye, and GO with adsorbed MB dye, details of the fingerprint region on (b).

The FTIR spectra of MB dye are shown in Figure 11. The fundamental bands are localized in the 1800–600 cm–1 region. The stretching vibration bands corresponding to the Chet=N+(CH3)2 bonds were found at 1648 cm–1. The intensive stretching vibration of C=C and C=N bonds is localized at 1600 cm–1. The stretching vibration of C—N and C—C bond of heterocycle was found at 1540 and 1225 cm–1 and the deformation vibration of C—N bond of heterocycle at 1143 cm–1. The C=S+ stretching vibration of MB heterocycle is seen at 1491 and 1355 cm–1. The next bands localized at 1446 and 1398 cm–1 can be ascribed to asymmetric and symmetric deformation vibration of C—H bond in N(CH3)2. The stretching vibration of C—N in N—CH3 is found at 1340 cm–1 and deformation and bending out-of-plane vibration of C—H at 1251, 1225, and 1189 cm–1. Finally, the C—S—C bond vibration of MB heterocycle is located at 1069 cm–1. All these vibrations correspond with the literature [102–104].
The FTIR spectra shown in Figure 11 correspond to the GO after sorption of MB dye. It should be mentioned that the intensity of characteristic GO bands decreased, particularly the intensity of the characteristic stretching vibration of (O—H) bonds in 3800–3000 cm–1 region. The vibration band at 1730 cm–1 corresponding to C=O bonds in carboxylic groups nearly disappeared, the band at 1625 cm–1 slightly shifted to 1638 cm–1, and the intensity also decreased for C=C stretching vibration. The most intensive bands of MB were also found in the sample of GO after MB adsorption as 1491, 1398, 1355, and 1340 cm–1. Only two vibration bands were slightly shifted at 1143 and 1069 cm–1 to 1149 and 1074 cm–1, corresponding to deformation vibration of C—N and stretching vibration of C—S—C of heterocycle of MB (Figure 11). The attenuation of the GO bands could be ascribed to covering of GO sheets by MB and just slight shifting tends to the suggestion that most probably π-π interaction coming from aromatic rings of MB and GO is present [16, 87].
3.6. Characterization of Samples before and after Sorption of MB by Powder XRD
The mechanism of MB adsorption was studied by Bujdák et al. [105], where orientations of MB cation were compared with experimental data. The calculated height of the MB cation is 0.77 nm. The arrangements of MB cation as intercalated dimer and monomer were determined and compared with the results obtained by Bujdák et al. [105]. The interlayer space was found to be at the range 7.2°–7.7° 2Θ corresponding to ~1.15-1.25 nm and monomeric arrangement of MB cations for all samples after sorption of MB at pH 3, 7, and 11 (Figure 12). The zones with no occupancy by MB cation were confirmed by the presence of large diffraction line at the range 10.9°–13.5° 2Θ (~0.81-0.66 nm). So, the interlayer space decreases significantly by the absence of MB cation.

XRD patterns of GO before and after sorption MB at pH 3, pH 7, and pH 11.
4. Conclusions
Graphene oxide prepared by a simple and low-cost verified synthesis process can serve as an effective sorbent for removing dyes in effluents or other contaminated waters. We have shown a higher GO adsorption capacity for MB removal in the whole pH range compared to other works [12, 13, 37, 38, 83] and GO-based composites. Solution pH plays a crucial role in the MB removal by GO and also affects the dissociation degree of surface functional groups, i.e., hydroxyl and carboxyl. The number of surface groups was determined by acid-base titration, and IEP was evaluated by zeta potential measurement. Negatively charged oxygen-containing groups in the whole studied pH range were confirmed. According to MB kinetic adsorption studies at
Footnotes
Data Availability
The data is stored in the repositories of the institutions listed in the manuscript or can be provided on request. For data, please contact Dr. Jakub Ederer (
Additional Points
Highlights. (i) GO sheets of good quality had large lateral size. (ii) The adsorption mechanism is via π-π and electrostatic interaction. (iii) The interaction of GO with MB dye was studied by FTIR. (iv) GO sheets can be used efficiently to remove cationic dyes in the whole pH range.
Conflicts of Interest
The authors declare no conflicts of interest.
Acknowledgments
The authors acknowledge the assistance provided by the Research Infrastructure NanoEnviCz, supported by the Ministry of Education, Youth and Sports of the Czech Republic under Project No. LM2018124, and supported under the project with No. UJEP-IGA-JR-2021-44-002-2 by the Internal Grant Agency UJEP and by the Technology Agency of the Czech Republic, project TH04030285.