



Abstract
In this study, Pb (II) removal from wastewater was investigated using a modified vitric crystal tuffite with a BET surface area of 11.7 m2/g. For this purpose, tuffite was used in its natural and modified form with ethylenediaminetetraacetic acid (EDTA). Batch adsorption experiment was performed. The effects of contact time (0–90 min), adsorbent dosage (1–10 g/L), initial concentration (10–200 mg/L), and pH (2–12) on the removal of Pb (II) were investigated. The isotherm data were fitted to Langmuir, Freundlich, Temkin, and Redlich-Peterson isotherm models. Kinetic models such as pseudo-first-order, pseudo-second-order, and intraparticle diffusion models were used. In order to optimize the adsorption system and investigate the kinetic behaviour of adsorption, nonlinear isotherm and kinetic models were used as well as linearized models. Error analyses were made in order to express the obtained results more accurately. pH 5 was the optimum value for adsorption. According to nonlinear isotherm model calculations, Bayburt stone (BS) and its modified form (MBS) had
1. Introduction
Interest in scientific studies on heavy metals has been increasing in recent years due to the carcinogenic effects of these substances and their dramatic deterioration in aquatic environments. Most heavy metals have negative effects on human health, even at low concentrations. Plants require small amounts of heavy metals such as copper, zinc, nickel, boron, iron, and molybdenum [1]. However, some heavy metals such as lead, mercury, cadmium, and arsenic are just the opposite. These substances have been blacklisted by various international organizations as they cause soil and water pollution as a result of activities such as industrial and urban waste discharges and fertilization. [2–5].
Lead is frequently used in battery, paint, and metal coating manufacturing processes [6]. Lead toxicity is associated with exposure to lead in air or water and has harmful effects on hematopoietic, kidney, reproductive, and central nervous systems as well as enzyme inhibition. Among heavy metals mentioned above, lead is considered to be one of the metals with the highest toxicity in its ionic state. Therefore, when it accumulates in living tissues, it has the property of being fatal [7]. Acute toxicity risks of lead must be reduced at every stage of the life cycle [8]. Although the action level of EPA is 15 ppb, lead concentrations are well above this level in most of the water bodies on the planet [9, 10].
Types, forms, and concentrations of heavy metals in water and wastewater play a primary determinant role in the selection of treatment processes. [2]. In addition, this selection depends on the economic conditions and discharge standards determined by the state institutions as well as the wastewater characteristics such as pH, temperature, flow rate, and biological oxygen demand. There are many traditional and novel wastewater treatment methods for lead treatment in the literature such as chemical precipitation [11]; micro-, ultra-, and nanofiltration [12]; reverse osmosis [13]; autocatalytic electrocoagulation [14]; capacitive deionization [15]; complex-assisted filtration [16]; electrocoagulation with low voltage [17]; biological lead removal [18]; and adsorption [6, 19]. However, since these technologies generally have higher costs and lower removal efficiencies, they have a more limited application area than adsorption. Among the most heavy metal removal processes, adsorption is one of the promising one due to its high efficiency, simple operation, and low cost [20].
In recent years, there have been many articles in the literature using adsorbent with various properties. One of the most critical points in adsorption studies is to prepare adsorbents with a large specific surface area and high adsorption efficiency as economical as possible. For example, although activated carbon is a very good adsorbent with other properties, it is considered an adsorbent with limited use due to its high cost and slow diffusion properties [5]. For this reason, adsorption studies have focused on reducing the cost and increasing the adsorption efficiency by modifying the adsorbents by chemical or physical methods in recent years [5, 21–23]. Improving the adsorption capacity by modifying the sorbent surface with chemical methods is a common and easier method than physical modification. In addition, it was stated that the selectivity of the adsorbent on metal ions after chemical modification increased more than other methods [24]. Ethylenediaminetetraacetic acid (EDTA) for the chemical modification of the adsorbent is one of the effective agents in metal adsorption since it forms strong metal complexes by chelating with metal ions through the complex formation mechanism [25]. For this reason, it has a widespread use in metal adsorption studies.
Bayburt stone (BS) is a natural vitric crystal tuffite that is abundant and quite cheap especially in the Eastern Anatolia Region of Turkey. In addition, there are very limited articles made with similar materials in the literature, but no adsorption studies have been found with this natural stone. It is thought that the study will yield useful results for natural materials with similar properties and also for the modification of natural stones to be used in adsorption.
The aim of this study is to investigate the usability of BS for Pb (II) adsorption and to reveal how its modified form (MBS) using EDTA changes the adsorption performance. In this way, it is thought that an effective and novel metal ion adsorbent will be presented to the field of application. In order to achieve this aim, the effects of operation parameters on adsorption, such as pH, temperature, mixing speed, time, adsorbate, and adsorbent concentrations, were investigated. In addition, behaviour of adsorption was tried to be revealed by analysing the kinetic models. All trials were performed for both raw and modified tuffite.
2. Materials and Methods
2.1. Chemicals
Aqueous Pb(NO3)2 stock solution at a concentration of 1000 mg/L Pb (II) was used in all experimental runs. HCl and NaOH, Na2EDTA, and HNO3 solutions were used for pH adjustments, for modifying the adsorbent, and for regenerating the adsorbent in desorption process, respectively. All the chemicals were of analytical reagent grade from E. Merck, Darmstadt, Germany.
2.2. Adsorbent
BS was obtained from Bayburt province in the Eastern Anatolia Region of Turkey. This material is an abundant and easily found regional stone within the borders of Bayburt province. The proved reserve of this stone in the region is 2,500,000 tons. BS has a unit weight of 2.38 g/cm3 and a porosity of 23% [26]. As can be seen from Table 1, this tuffite has a lighter structure than most natural stones. It is thought that this feature of the adsorbent will provide an additional advantage in terms of operation in industrial adsorption applications.
Average specific gravity of various stone types.
[27].
Chemical components of BS are given in Table 2.
Chemical components of BS used in this study.
[28].
In the modification process of BS, the adsorbent samples were first cleaned with compressed air and washed several times with tap water. It was then passed through distilled water and allowed to dry for 24 hours in an oven at 105°C. The dried samples were ground and sieved to a grain size of 0.1 mm and below. Then, 100 g of the cleaned and dried stone samples was mixed with 1000 mL of 0.1 M NaOH and shaken for at least 3 hours. The mixture was filtered and the samples were cleaned with pure water until the pH value of the filtrate was approximately neutral. It was then left to dry in a drying oven at 105°C for at least 2 hours. The same procedures were repeated using EDTA to improve the selectivity of BS toward the adsorption of Pb (II). Prepared MBS and BS samples were stored in a moisture-free environment during the study.
2.3. Analyses
All analyses performed throughout the study were repeated at least three times. The results presented are given as the average of these trials. In addition, error function analyses were used to reveal the accuracy of the results.
pH measurements were made with CrisonpH25+ brand pH meter device. All of the samples were centrifuged before Pb (II) analyses (Nüve NF 1200R). During the adsorption/desorption experiments, Pb (II) concentrations in the samples were measured at 283.3 nm wavelength, 10 mA current, and 0.5 nm slit width using Shimadzu AA6800 atomic adsorption spectrophotometer.
Scanning electron microscopy (SEM-EDS), Fourier-transform infrared spectroscopy (FTIR), and Brunauer-Emmett-Teller (BET) analyses were performed with ZEISS SIGMA 300, Bruker VERTEX 70v and Micromeritics 3 Flex instruments, respectively. These analyses were carried out in the laboratories of Atatürk University Eastern Anatolia High Technology Application and Research Centre (DAYTAM).
2.4. Zeta Potential Measurements
Zeta potential measurements were carried out with Malvern Zetasizer Nano ZSP brand device between pH 2 and 12, and the maximum potential value was obtained as -29.8 mV at pH 10.
2.5. Experimental Procedures
Adsorption experiments were carried out by using stoppered glass Erlenmeyer flasks (250 mL). 1000 mg/L stock solution of lead was prepared by dissolving required amount of Pb(NO3)2 in deionized water. Various amounts of BS or MBS (1 to 10 g) and solutions diluted in the range of 10 to 200 mg Pb/L from the stock solution according to the experimental conditions were added to Erlenmeyer flasks for each experiment.
With the help of the CrisonpH25+ model multiparameter, the pH of the mixture was kept between 2 and 12 using HCl and NaOH solutions to determine the optimum pH value, and then, experiments were carried out at the determined optimum pH value.
Experiments were carried out at 25, 30, 35, and 40°C temperature conditions with the aid of a heat-adjustable Edmund Bühler Incubator HoodTH15 brand shaker at the optimized pH value.
Stirring speeds of 100, 200, and 300 rpm were applied in the study, and the trials were initially continued for up to 300 minutes. After determining the time for adsorption to reach equilibrium, the experiments were continued with this mixing speed.
Adsorbed Pb (II) amount onto per unit weight of adsorbent (mg/g) is calculated with the following equation [29]:
The isotherm study, in which the adsorption capacity was tried to be determined, was carried out at the optimum pH value, using different temperatures (25 to 40°C), initial lead (10 to 200 mg/L), and adsorbent (1 to 10 g/L) concentrations. In the kinetic study to determine the adsorption rate, 5 different initial lead concentrations of 10, 25, 50, 100, and 200 mg/L were used. In each experiment, the remaining lead concentration analyses were made in the samples taken from the solution at certain time intervals.
2.6. Desorption Experiments
In order for the materials used as adsorbent to be widely used, their renewability is an important factor in addition to their properties such as adsorption capacities and costs. BS and MBS were subjected to desorption process to investigate their reusability after adsorption process. For this purpose, the adsorbent was regenerated by using 0.1 M HNO3 solution and distilled water under mechanical stirring at 200 rpm for 8 hours at room temperature (25°C), and the amount of lead transferred to the solutions was evaluated with sampling at time intervals. In order to reveal the pH effect, the pH range of the regeneration solution was changed between 2 and 12 as in the adsorption procedure in this study. Adsorption and desorption processes were considered as a whole process in this study, and this procedure was carried out for all samples immediately after the completion of the adsorption process.
3. Results and Discussion
3.1. The Effect of the Operational Parameters
In the study, ambient pH, adsorbent amount, ambient temperature, mixing speed, and initial concentration were chosen as operational parameters, and the effect of all these parameters on adsorption was revealed.
pH is considered to be one of the most important parameters controlling adsorption, especially in metal ion adsorption processes. The acidity of the solution has a significant influence on the chemical behaviour and functionality of the material surface through the formation of hydrolysis, precipitation, ion exchange, and stable complexing with elements. [30]. If the pH in Pb (II) solution is below 3.30, the dominant species in the solution is Pb (II) ions, and as the pH approaches the neutral value, Pb(OH)2 begins to precipitate in the solution [31]. In addition, at low pH values, the adsorbent surface will become overloaded and will begin to remove metal ions from itself. Therefore, in both cases, the adsorption efficiencies are below the expected values [32]. For this reason, it is necessary to reveal the optimum pH value at which this balance is achieved in adsorption studies. In this research study, the experiments were carried out by keeping the pH between 2 and 12 in accordance with the literature, and first of all, the optimum pH value was investigated.
As seen in Figure 1, the maximum zeta potential value was actually obtained around pH 10. However, as mentioned above, Pb (II) removal efficiency was low as precipitation became dominant at this pH value. The maximum adsorption efficiencies obtained in the experiments were around pH 5, and at values above and below this value, the adsorption efficiencies decreased significantly due to precipitation and positive charging, respectively. In other words, lead ion adsorption increases due to electrostatic attraction between negatively charged adsorbent surface and positively charged cationic lead at this pH value. Figure 1 shows the relationship between pH and adsorption efficiency at 10 g/L adsorbent, 10 mg/L initial Pb (II) concentration, and 35°C conditions. The same behaviour of removal efficiency against solution pH was observed in all other conditions. Therefore, the optimum pH value for this study was accepted as 5, and effects of contact time, adsorbent concentration, mixing speed, and temperature on the Pb (II) adsorption ability of BS and MBS were investigated by adjusting the solution pH value to 5. Each trial was performed in at least three repetitions.

Zeta potentials and Pb (II) removal efficiencies versus pH for BS and MBS. ± SD shown by error bar.
Figure 1 also shows the adsorption efficiency differences between BS and MBS. As seen in the figure, while the highest efficiency achieved with BS was 90%, this value increased to 95% and above with MBS. As can be seen, the adsorbent modification process increases the adsorption efficiency at all pH values.
To evaluate the effect of initial Pb (II) concentration on the adsorption, lead concentrations were applied in the range between 10 and 200 mg/L. The behaviour of the adsorption system for MBS with increasing lead concentrations is given in Figure 2(a). As can be seen in Figure 2(a), lead adsorption is highly influenced by the initial lead concentration. The amount of Pb (II) remaining in the solution increased with increasing initial concentration. Maximum adsorption efficiencies were found as 91.2% and 94.9% for BS and MBS, respectively, at 10 mg Pb (II)/L, 10 g adsorbent/L, 200 rpm, and 35°C conditions. These values were observed as 87.4% and 90.2% for BS and MBS, respectively, for initial Pb (II) concentration of 200 mg Pb (II)/L and under the same other conditions. As can be understood from these results, MBS showed higher capacity than BS in terms of adsorption efficiency. Experimental data revealed the same trend in other trials.

Pb (II) concentration changes over time at different conditions for MBS. ± SD shown by error bar.


Figure 2(b) shows the change in the Pb (II) concentration remaining in the solution when the adsorbent dosage is changed from 1 mg/L to 10 mg/L. In this series of studies, the initial Pb (II) concentration, temperature, pH, and stirring speed were 10 mg/L at 35°C, 5, and 200 rpm, respectively. As can be seen in Figure 2(b), the concentration of Pb (II) remaining in the solution decreases as the adsorbent dosage increases from 1 to 10 g/L due to the presence of more adsorbent surface area in the solution. According to the data obtained, it is observed that the amount of Pb (II) adsorption increases rapidly up to the adsorbent dosage of 5 g/L, and the acceleration is slightly decreased up to 10 g/L, but there is still a significant increase. Since it was seen that the adsorption efficiency would not increase significantly in the adsorbent dosage increases after this point, the maximum adsorbent dosage was accepted as 10 g/L. Experiments showed that the system reached equilibrium in 90 minutes, and after this period, 0.68, 0.60, 0.53, and 0.51 mg/L Pb (II) concentrations remained in the solution at 1, 2, 5, and 10 g/L adsorbent dosages, respectively.
The effect of agitation speed on adsorption efficiency was investigated by changing the speed between 100 and 300 rpm (increasing 50 rpm in each trial). The agitation speed has an important role in adsorption processes. As can be seen from Figure 2(c), the amounts of adsorbed Pb (II) were increased with increasing speed until 200 rpm. The amount of Pb (II) removed at 250 rpm decreased slightly and reached the lowest level at 300 rpm. It is thought that this situation occurs because high mixing speeds cause a decrease in the boundary layer and decrease the bed resistance, resulting in a decrease in the amount of adsorbed material [33].
Temperature has a significant effect on increasing or decreasing the amount of adsorption. In this study, experiments to reveal the effect of temperature on adsorption were carried out at four different temperatures ranging from 25 to 40°C. Other conditions in these experiments were adjusted as 10 g/L adsorbent dose, 10 mg/L initial Pb (II) concentration, and pH 5. Figure 2(d) shows the variation of the amount of lead remaining in the solution with time. It was observed that temperature increases from 25 to 35°C affect the adsorption efficiency positively. The efficiencies tended to decrease with the increase in temperature from 35 to 40°C. This is due to the exothermic nature of the process or the decrease in the effect of physical forces at high temperature [34]. According to these results, it was seen that the best temperature value for Pb (II) adsorption with BS and MBS was 35°C.
As a result of these experiments, best values of contact time, adsorbent dosage, mixing speed, and temperature were observed as 90 min, 10 g/L, 200 rpm, and 35°C, respectively.
3.2. Characterization
Scanning electron microscopy (SEM-EDS), Fourier-transform infrared spectroscopy (FTIR), and Brunauer-Emmett-Teller (BET) analyses were performed to examine the characteristic structure of MBS. The BET and Langmuir surface area of MBS were 11.7 m2/g and 55.6 m2/g, respectively. Table 3 shows the specific BET surface area,
Surface area and
SEM imaging and EDS methods were used to examine the structure of MBS and to reveal the changes that may occur after adsorption. SEM analysis is a frequently used method for surface morphology analysis of an adsorbent. SEM images of MBS before (Figure 3(a)) and after adsorption (Figure 3(b)) under optimum test conditions (

SEM images of MBS used in this study ((a) and (b) represent before and after adsorption, respectively).
The EDS graph is given in Figure 4. The components of the tuffite used in the study, which are given in Table 2, appeared significantly in the peaks in the EDS graph (Figure 4(a)). The lead peak, observed after adsorption, can be seen in EDS graphs of MBS (Figure 4(b)).

EDS graphs before (a) and after (b) Pb (II) adsorption.

The surface chemistry characterisation of MBS was investigated by FTIR spectroscopy (Figure 5). As can be seen from Figure 5, FT-IR spectrum peaks of raw MBS have upper or lower transmittance values than those of after adsorption. Generally, FTIR spectra of the zeolitic tuff samples display a broad band at 3700–3100 cm−1 [41]. The broad, strong band around 3650 cm-1 can be assigned to the O–H stretching mode of hexagonal groups and adsorbed water [34]. The FTIR spectrum of MBS has asymmetric stretching vibrations (1025-1030 cm−1) of Si–O–Al band [42]. Bands that appear in the region of 1025–980 cm−1 can be assigned to Si–O or Al-O stretching mode [43] and 536 cm−1 can be assigned to Si–O–Si(Al) bending [44].

FTIR spectrum of Bayburt stone before and after Pb (II) adsorption.
3.3. Equilibrium Modelling
3.3.1. Langmuir Isotherm
Langmuir model equation is given in Equation (2) [45]:
3.3.2. Freundlich Isotherm
Freundlich model equation is given in Equation (4) [45].
3.3.3. Temkin Isotherm
Temkin isotherm equation is given in Equation (5) [46].
3.3.4. Redlich-Peterson Isotherm
Redlich-Peterson isotherm is given with Equation (6) [47].
The batch equilibrium technique was used to examine the adsorption isotherms of Pb (II) on BS and MBS. Experiments were carried out in a temperature-controlled shaker. Different temperature (25-45°C), different adsorbent dose (1-10 g/L), and different initial lead concentration (10-200 mg/L) ranges were applied for modelling. The remaining Pb (II) concentrations in the solution were analysed in the samples taken at various time intervals. The results from the isotherm study were used to evaluate the applicability of the Langmuir, Freundlich, Temkin, and Redlich-Peterson isotherm models. Figure 6 shows the linear model plots of these isotherms.

Langmuir, Freundlich, Temkin, and Redlich-Peterson isotherm model plots with linear estimation at 35°C, pH 5, and 200 rpm operating conditions for BS (a1, b1, c1, and d1, respectively) and MBS (a2, b2, c2, and d2, respectively). ± SD shown by error bar.
In order to obtain more realistic isotherm factors and parameters in isotherm modelling calculations, nonlinear isotherm calculations have been made as well as linear ones. Nonlinear and linear isotherm model constants are given in Table 4 for different operating conditions. In addition, the error analyses presented in Table 5 were also used to more accurately assess the fit of the isotherm models to the experimental data. [48]. All calculations are carried out using OriginPro 2022b.
Isotherm model parameters of Pb (II) adsorption for various temperatures.
Error analysis of isotherm adsorption parameters.
It can be seen from Table 4 that the

Adsorption isotherm for Pb (II) on MBS (
3.4. Adsorption Kinetics
In order to reveal the reaction rate, pseudo-first-order, pseudo-second-order kinetic models, and intraparticle kinetic model representing diffusional kinetics were used. And to make the results more useful, these models were analysed in both linear and nonlinear forms. Equations of these models are given in [39, 51]
Kinetic model parameters of Pb (II) adsorption at 35°C.

Pseudo-first-order (a), pseudo-second-order (b), and intraparticle (c) kinetic model plots at 35°C, pH 5, and 200 rpm operating conditions for MBS. ± SD shown by error bar.

Sorption kinetics of Pb (II) onto MBS and nonlinear fits of pseudo-first-order, pseudo-second-order, and intraparticle diffusion models (
Error analysis of kinetic adsorption parameters.
Five different concentrations were used in the study, with an initial concentration of Pb (II) in the range of 10 to 200 mg/L. When the results given in Table 6 are evaluated, it is seen that the pseudo-second-order kinetic model has more appropriate values than the other models studied. In this study, the order of magnitude of the correlation coefficients is pseudo-second-order > intraparticle diffusion > pseudo-first-order. The values of
The comparison of the equilibrium adsorption uptake (
3.5. Adsorption Thermodynamics
In addition to the isotherm and kinetic models, it is also useful to investigate the adsorption thermodynamics to define the affinity of the adsorbent for adsorption [33, 40, 54–56]. The thermodynamic parameters can be calculated using the following equations:
Adsorption thermodynamic parameters of Pb (II) on BS and MBS at 100 mg/L of initial concentrations.
3.6. Regeneration
Since pH is one of the most important parameters in desorption processes, desorption experiments were carried out at different solution pH values [57]. For this purpose, samples obtained from batch adsorption experiments, which were repeated enough for desorption experiments to be carried out at different pH values, were filtered through filter paper, rinsed with distilled water 3 times to eliminate free Pb (II) and placed in solutions brought to different acidic pH values using 0.1 M HNO3. Samples were taken from the solutions at intervals of 5 to 10 minutes and Pb (II) analyses were performed. As a result of the analysis, the desorption ratio [52] of BS and MBS was calculated with the help of the following equation:
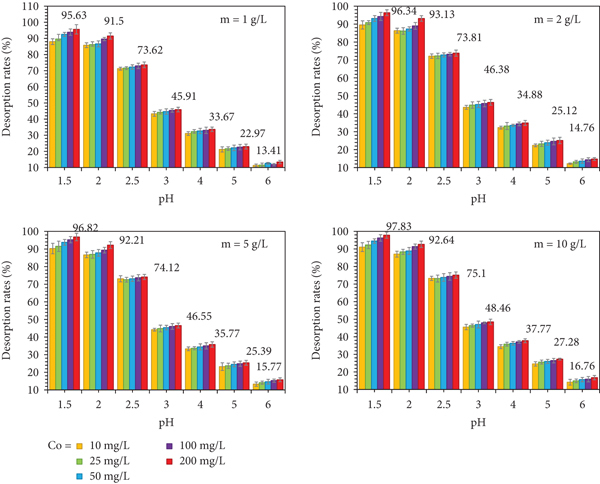
Desorption rates of Pb (II) versus pH graphs for different adsorbent dosages. ± SD shown by error bar.
As can be clearly seen from Figure 10, the desorption of lead from MBS is highly related to the pH of the solution. In this study, while adsorption was maximum at pH 5, the maximum value of desorption was reached as 97.8% at pH 1 for 10 g/L sorbent concentration. As the ambient pH value increased, the desorption amounts decreased rapidly (16% at pH 6). In addition, desorption efficiencies increased with increasing adsorbent concentrations and initial Pb (II) concentrations. According to these results, it can be said that MBS has a very stable structure during the adsorption/desorption of Pb (II) and is a reusable sorbent for removal of Pb (II).
4. Conclusions
In summary, both BS and MBS are suitable for Pb (II) adsorption. Significant improvements were observed in the isotherm model correlation coefficients,
The MBS exhibited excellent adsorption performance for Pb (II) with
Footnotes
Data Availability
The data used to support the findings of this study are included within the article.
Conflicts of Interest
The authors declare that there are no conflicts of interest regarding the publication of this paper.
Acknowledgments
This research was carried out in Atatürk University Engineering Faculty Environmental Engineering Department research laboratories. The authors would like to thank the staff of Ataturk University East Anatolia High Technology Application and Research Center (DAYTAM).