
Abstract
As an eco-friendly material, Zn-adeninate bio-metal-organic framework (bio-MOF) was investigated as an efficient adsorbent for both anionic and cationic dyes. The adsorption capability of the synthesized Zn-adeninate bio-MOF was confirmed by its notable surface area of 52.62 m2 g−1 and total pore volume of 0.183 cm3 g−1. The bio-MOF adsorption profiles of anionic direct red 81 (DR-81) and cationic methylene blue (MB) dyes were investigated under different operating parameters. The optimum dosages of Zn-adeninate bio-MOF were 0.5 g L−1 and 1 g L−1 for MB and DR-81 decolorization, respectively. The pHPZC of Zn-adeninate bio-MOF was 7.2, and maximum monolayer adsorption capacity was 132.15 mg g–1 for MB, which decreased to 82.54 mg g–1 for DR-81 dye. Thermodynamic data indicated the spontaneous and endothermic nature of the decolorization processes. Additionally, the adsorption processes were in agreement with the Langmuir and pseudo-second-order kinetic models. The synthesized Zn-adeninate bio-MOF could be reused several times with high decolorization ability. These findings demonstrated that the synthesized Zn bio-MOF is an effective and promising adsorbent material for the removal of both cationic and anionic dyes from polluted water.
1. Introduction
Water accounts for approximately 70% of the Earth’s surface, but only approximately 3% is freshwater. A large fraction of the freshwater is locked up in glacial ice caps or at great depths under the surface of the earth, which is difficult to extract and hence is not used by humans. Moreover, a high percentage of the freshwater has become highly polluted, leaving only 0.4% as usable, which is insufficient for the 7.80 billion people living on the earth [1]. The safety of water sources is the most challenging matter related to water sustainability that is faced by several countries worldwide. Contamination of water with harmful materials, such as organic dyes and heavy metal ions, is a severe problem because of their toxic and carcinogenic nature [2].
Currently, a large number of fabricated dyes are produced annually around the globe, and approximately 10% of these are discharged into the environment as wastewater because they (50% concentration) do not strictly bind to the fibers and can act as liquid contaminants [3]. Additionally, the multifaceted aromatic structures of the synthetic dyes make them stable and difficult to decompose [4]. The aromatic amines created after the degradation of azo dyes, a type of synthetic dye, are highly toxic [5]. Moreover, approximately 40% of the dyes contain organically bound chlorine, which is a known carcinogen [6]. Further, the discharge of dye-polluted liquids into streams and rivers lowers dissolved oxygen and enables anaerobic media, which can destroy aquatic organisms [4].
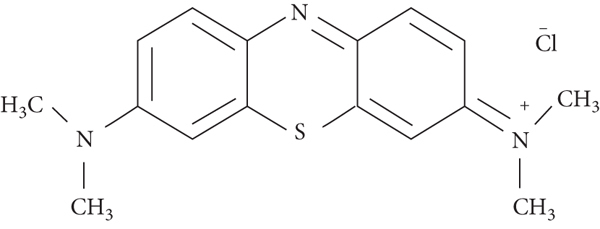
Direct dyes are characterized by their affinity for bleached and unbleached chemical pulps and are primarily used in the pulp and textile industries. They usually contain sulfonic acid groups and at least one azo group that imparts water solubility to the dyes. Direct red-81 dye (DR-81) is one of the most famous anionic azo dyes used in industrial applications (Figure 1(a)) [7]. By contrast, methylene blue (3,7-bis(dimethylamino)-phenothiazin-5-ium chloride) (MB) or basic blue-9 is a univalent cationic dye with the molecular formula of C16H18N3ClS, as shown in Figure 1(b), and is utilized for biological staining as well as coloring hair, papers, wool, and cotton [8]. However, the accumulation of MB in water has undesirable health effect, including eye burns, breathing problems, diarrhea, and nausea [9].

Structures of (a) direct red-81 and (b) methylene blue.
Accordingly, researchers have investigated various techniques for wastewater treatment, such as advanced oxidation processes [10], electrocoagulation, coagulation/flocculation [11], adsorption [12–14], activated sludge processes [15], filtration [16], ion exchange [17], photodegradation [18], membrane bioreactors [19], bed biofilm reactors [20], and constructed wetlands (CW) [21]. Among these techniques, adsorption is a very efficient removal technique because of its ease of operation, high removal efficiency, reusability of the adsorbents, and cost-effectiveness. Adsorption involves transition of solids from the solution to the adsorbent surface [22]. Several adsorbents, such as carbon-based nanoadsorbents, polymer-based adsorbents, biosorbents, transition metal-based oxides, and metal-organic frameworks (MOFs), have been employed to remove dyes from wastewater [1, 23–25]. Recent studies have found that MOFs are powerful adsorbents compared to other materials owing to their high surface areas and porous structures [1, 26].
MOFs are a category of hybrid materials that contain metal ion-based matrices and organic ligands that attach the vertices to form two- or three-dimensional periodic structures [1]. The appropriate choice of organic ligands and vertices results in the synthesis of MOFs with different pore sizes, topologies, and geometries. Several techniques, such as defect engineering, modulation of noncovalent interactions, and functionalization of organic ligands [26], have been developed to prepare porous frameworks for adsorbing organic dyes with high selectivity. Significant advancements have been made in the design of water-stable MOFs. MOFs can be soaked in water for extended periods at various pH values without changing their structures [27]. Consequently, MOFs are considered promising materials for wastewater remediation owing to their impressive properties and specific interactions with the pollutants, in addition to their catalytic activities against specific organic pollutants [28].
In recent years, bio-MOFs have attracted significant interest as green sustainable frameworks. Derived biomolecules that are usually readily biodegradable and nontoxic are combined to synthesize bio-MOFs [1, 29]. Biomolecules, such as polysaccharides, amino acids, nucleobases, and peptides, are combined with metal ions to synthesize bio-MOFs. Salamat et al. studied the combination of a polysaccharide with metal ions for MOF crystallization under biocompatible conditions. The hydroxyl groups present on the polysaccharide molecules were found to assist in the coordination interactions with the metal ions. Hence, functional polysaccharides trigger the formation of MOFs by controlling the morphological structure and particle size of the prepared MOFs [30]. Furthermore, the integration of the functionalized biopolymers with MOF materials can improve the biocompatibility, adsorption, and flexibility of the composite materials, which can extend their application in biocatalysis and biological sciences [31]. Zn-based bio-MOFs have been used for the wastewater remediation because of their high porosity, which simplifies the decontamination process of pollutants [1]. The existence of tunable chemical functions, such as −NH2 groups, result in excellent removal capacities of the negative and positive dyes [32]. In this study, an eco-friendly reusable Zn-adeninate bio-MOF was synthesized and investigated as an effective adsorbent material for the anionic DR-81 and cationic MB dyes from polluted water.
2. Materials and Methods
2.1. Materials
Adenine and 4,4
2.2. Synthesis of Zn-Adeninate Bio-MOF
In a 25 mL screw-capped tube, 0.03378 g of adenine was dispersed in 5 mL of DMF. The dispersed adenine powder was sonicated at 70°C for 6 h in an isothermal sonicator to obtain a well-dispersed solution of the organic ligand. In another 25 mL screw-capped tube, 0.1097 g of zinc acetate dihydrate was dissolved in 10 mL of DMF. Additionally, 0.12111 g of 4,4
2.3. Characterization of the Synthesized Zn Bio-MOF
The functional groups of the synthesized Zn-adeninate bio-MOF were determined by analyzing its infrared absorption spectrum obtained using a Thermo Scientific Nicolet (USA). X-ray photoelectron spectroscopy (XPS, Thermo Fisher Scientific, USA) was used to evaluate the chemical states of the synthesized Zn-adeninate bio-MOF. To determine the crystal structure of the synthesized Zn-adeninate bio-MOF, X-ray diffraction (XRD) pattern of the synthesized sample was obtained by a Shimadzu XRD-6100 diffractometer with Cu-Kα radiation at
2.4. Decolorization of Cationic and Anionic Dyes using the Synthesized Bio-MOF
The characteristic adsorption affinity of the prepared Zn-adeninate bio-MOF was investigated for different pollutant dyes, including cationic and anionic dyes, using a batch technique. Subsequently, 50 mg of the synthesized Zn-adeninate bio-MOF was shaken at 23°C with 50 mL of the dye solution at different initial concentrations. The influence of adsorption parameters, such as pH (1–11), contact time (0–180 min), initial dye concentration (5–100 mg L–1), material dosage (0.1–2 g L–1), and reaction temperature (23–85°C), were investigated. The adsorption experiments were performed in triplicate to confirm the results, and the mean values were used for the data analysis. After the adsorption experiment, the supernatant was separated from the adsorbent material by centrifugation and the absorbance of the supernatant was determined using a colorimetric method with a UV-visible spectrophotometer at 665 and 465 nm for MB and DR-81, respectively. The decolorization percentage of the dye by the synthesized Zn-adeninate bio-MOF was calculated using the following equation [33]:
The point of zero charge of the synthesized Zn-adeninate bio-MOF was determined by mixing 0.1 g of the adsorbent material with 25 mL of 0.01 molar NaCl. The pH of the solution was adjusted to 1–12 using 0.01 M NaOH and/or 0.01 M HCl. Equilibration was achieved by shaking the solution in a thermostatic bath at 25°C for 24 h. The powdered material was separated, and the final pH of the supernatant was determined. The pH of the final solution was plotted against the initial pH, and the pH value at which the curves intersected (
2.5. Thermodynamics, Equilibrium, and Kinetics of the Bio-MOF Adsorption Behavior
The nature of the decolorization processes by the synthesized Zn-adeninate bio-MOF was evaluated by determining the thermodynamic parameters. The adsorption equilibrium was analyzed using the Langmuir, Freundlich, and Temkin isothermal models. Furthermore, the kinetics of the dye removal processes by the synthesized material were tested by applying the pseudo-first-order, pseudo-second-order, Elovich, and intraparticle kinetic models.
2.6. Regeneration of the Prepared Zn Bio-MOF
One gram of the used Zn-adeninate bio-MOF was recovered and washed three times with distilled water and 50 mL of methanol at 23°C, agitated at 150 rpm for 10 min, and dried at 150°C overnight for use in the subsequent adsorption experiments. Furthermore, the readsorption processes were performed at the following optimized removal conditions:
3. Results and Discussion
3.1. Characterization of the Fabricated Zn-Adeninate Bio-MOF
The FT-IR spectrum of the prepared Zn-adeninate bio-MOF exhibited various characteristic peaks of both the organic framework ligands and metal. The C–O stretching peak of the carboxylic unit in the adeninate group was observed at 1600 cm-1, as shown in Figure 2. The peak at 1373 cm-1 accounts for the C–C stretching; additionally, most bands in the range of 3000–3800 cm−1 were assigned to the OH unit of carboxylic acid [34]. The stretching frequencies of the N–H group of adenine are located in the range of 3117–3338 cm−1 [35]. The peaks observed in the wavenumber range of 420–1000 cm−1 are characteristic of the Zn–O bonds, confirming the presence of metal in the synthesized bio-MOF [36]. Therefore, the FT-IR spectrum contains the characteristic peaks of the synthesized Zn-adeninate bio-MOF.
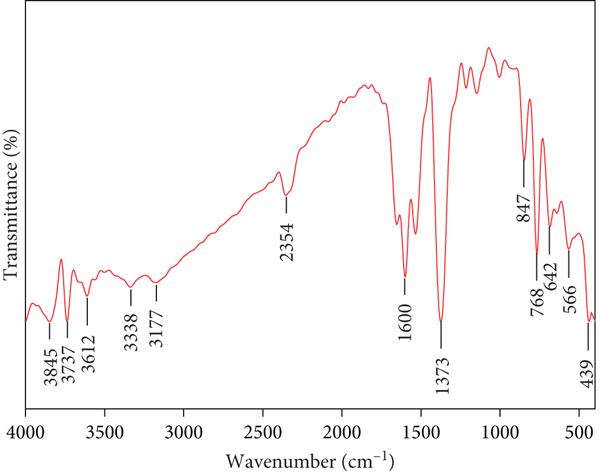
FTIR spectrum of the prepared Zn-adeninate bio-MOF.
The crystalline structure of the prepared Zn-adeninate bio-MOF was determined using XRD, as shown in Figure 3. The XRD pattern contains distinct Zn-adeninate bio-MOF peaks at 6.5°, 13.6°, and 21.8°, which can be attributed to the (111), (222), and (440) planes, respectively. These peaks are characteristic of the crystalline structure of bio-MOF and are completely different from the XRD patterns of ZnO [12, 37].
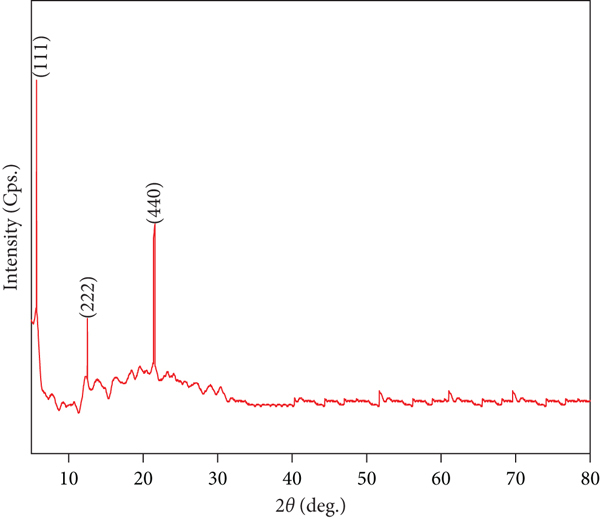
XRD pattern of the synthesized Zn-adeninate bio-MOF.
The chemical structure of the synthesized Zn-adeninate bio-MOF was investigated using XPS (Figure 4). The four peaks located at 284.2, 400, 531.6, and 1022.3 eV were assigned to C 1s, N 1s, O 1s, and Zn 2p, respectively. The C 1s spectra contained three peaks at binding energies (BE) of 284.2, 286.3, and 288.2 eV, which were related to the C=C, C=O, and COO−/COOH functional groups, respectively [35]. The N 1s peak in the XPS spectrum of the synthesized Zn-adeninate bio-MOF indicated the presence of −NH2 and −NH2/NH3 + units [38]. Moreover, the N 1s peak characteristic of the −NH2 species appeared at 399.3 eV, while the peaks corresponding to the H-bonded and/or quaternary ammonium structures were present at approximately 400 eV [1]. The O 1s spectrum contained the characteristic peak of the bridging hydroxyl (μ 3-OH) group at 533 eV, while the Zn carboxylate and (μ 3-O) in Zn–O peaks appeared at 531.6 eV and 531.4 eV, respectively [39]. The presence of Zn was confirmed by the appearance of Zn 2p peaks at 1022.3 and 1045.5 eV [35].

XPS spectra of the fabricated Zn-adeninate bio-MOF; (a) full spectrum, (b) C 1s spectrum, (c) N 1s spectrum, (d) O 1s spectrum, and (e) Zn 2p spectrum.


The morphology of the Zn-adeninate bio-MOF was analyzed using SEM, HRTEM, and SAED, as shown in Figure 5. The presence of large crystals in the SEM image was attributed to the agglomeration of the particles, which was proved via TEM. The SEM and TEM images confirmed the presence of uniform morphology with small nanoparticles in the synthesized Zn-adeninate bio-MOF sample, which was different from the extensive size distribution at the microscale observed in the previously prepared bio-MOFs. The reduction in the particle size of the synthesized sample can be attributed to the variations in the synthesis conditions, such as the long stirring time that results in the formation of smaller nanoparticles with a higher yield compared to the procedures previously described in the literature [40]. Moreover, the circular pattern observed in the SAED image revealed the homogeneous polycrystalline nature of the synthesized Zn-adeninate bio-MOF, which is in agreement with the XRD data.

Morphological structures of the Zn-adeninate bio-MOF: (a) SEM and (b) TEM, HRTEM, fringe lattices, and SAED.
The surface properties of the synthesized Zn-adeninate bio-MOF before and after the adsorption of different dyes were determined using the Brunauer-Emmett-Teller (BET) method and N2 isotherms, as shown in Figure 6. The isotherms before and after adsorption were type III with relatively similar shapes, exhibiting an indistinct hysteresis loop related to N2 condensation in the mesopores [41]. The specific surface area, mean pore diameter, and total pore volume of the prepared Zn-adeninate bio-MOF were approximately 52.62 m2 g−1, 14.454 nm, and 0.183 cm3 g−1, respectively. The large pore size and surface area of Zn-adeninate bio-MOF are appropriate for the utilization of the synthesized bio-MOF as an adsorbent for water pollutants [1]. After the adsorption process, the BET surface area of Zn-adeninate bio-MOF decreased to 34.06 m2 g−1 and 32.59 m2 g−1 for MB and DR-81, respectively. This was expected because of the agglomeration and blockage of pores in Zn-adeninate bio-MOF after the adsorption of MB and DR-81 ions [42].

N2 adsorption/desorption isotherm before and after decolorization of MB and DR-81 by the synthesized Zn-adeninate bio-MOF.
The thermal profile of the synthesized Zn-adeninate bio-MOF was obtained in a nitrogen gas atmosphere to test its thermal stability. Multiple degradation stages are present in the thermogram of the synthesized bio-MOF, as shown in Figure 7. The first weight loss of approximately 17.5% occurred at 298°C, which can be assigned to the loss of gases and water molecules that penetrated the pores of bio-MOF [1, 33]. The second weight loss of stage is approximately 59% occurred in the temperature range of 298–510°C, which is related to the breakdown of the organic framework of the bio-MOF. These results demonstrated the excellent thermal stability of the prepared Zn-adeninate bio-MOF.
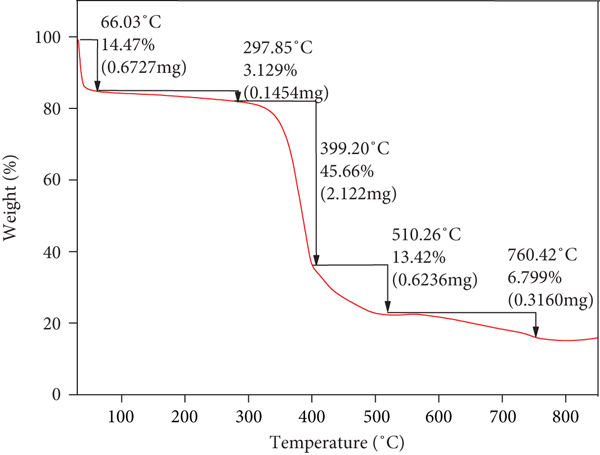
TGA plot of the synthesized Zn-adeninate bio-MOF.
3.2. Assessment of the Synthesized Zn-Adeninate Bio-MOF for Cationic and Anionic Decolorization from Wastewater
The performance of the prepared Zn-adeninate bio-MOF was investigated for the decolorization of MB and DR-81 from the polluted synthetic solutions at room temperature via a batch technique.
3.2.1. Influence of Contact Time on the Decolorization of Cationic and Anionic Dyes
The effect of the contact time on the adsorption capacity of the synthesized Zn-adeninate bio-MOF for MB and DR-81 was evaluated at different time intervals of up to 180 min, as shown in Figure 8. The adsorption capacities increased with time until the equilibrium state was reached. The improvement in the adsorption capacities for the cationic and anionic dyes in the initial stage can be attributed to the functional groups that can bind with the target dyes and large surface area of the Zn-adeninate bio-MOF [1, 12]. The optimum contact time at neutral pH was 10 min for MB and 30 min for DR-81 with adsorption capacities of 9.88 and 8.41 mg g–1 for MB and DR-81, respectively. After equilibrium was achieved, the active sites of the prepared adsorbent became saturated with MB and DR-81, limiting further removal [13]. These results demonstrated the high capacity of the synthesized Zn-adeninate bio-MOF to decolorize both anionic and cationic dyes in short contact times.

Effect of contact time on the adsorption capacity of the synthesized Zn-adeninate bio-MOF for the MB and DR-81 dyes (
3.2.2. Influence of Initial pH on the Decolorization of Cationic and Anionic Dyes
The pH plays a significant role in the dye decolorization from wastewater. The pH directly affects the surface charge of the adsorbent and ionization degree of the pollutants [12, 43]. The pHPZC of Zn-adeninate bio-MOF was 7.2, as shown in Figure 9(a). This illustrates that the synthesized Zn-adeninate bio-MOF is positively charged till

(a) The pHpzc of the synthesized Zn-adeninate bio-MOF and (b) the effect of pH on the adsorption capacity of the synthesized Zn-adeninate bio-MOF for MB and DR-81 (contact

3.2.3. Influence of the Synthesized Zn-Adeninate Bio-MOF Dosage on the Decolorization of Cationic and Anionic Dyes
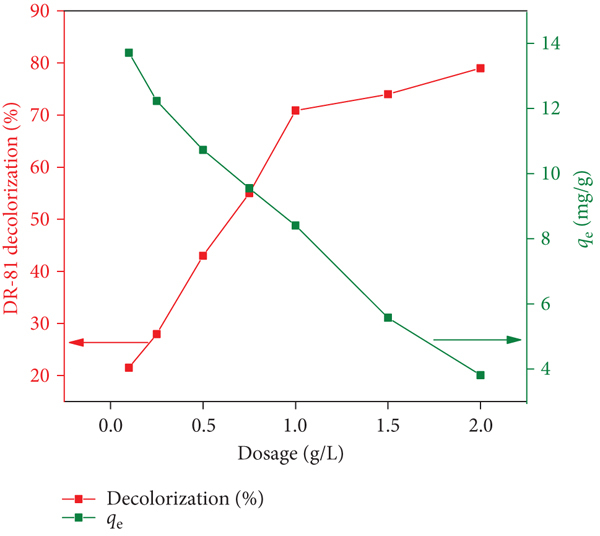
The adsorbent dosage is an important factor that controls the adsorbent capacity and, hence, the decolorization process [43]. The effect of the adsorbent dosage of the synthesized Zn-adeninate bio-MOF was tested after 10 and 30 min for MB and DR-81, respectively. The decolorization of MB and DR-81 dyes by the synthesized Zn-adeninate bio-MOF was enhanced by increasing the material dosages from 0.1 g to 2 g L−1, as shown in Figure 10. Furthermore, the decolorization capacity of the synthesized Zn-adeninate bio-MOF toward the two different dyes decreased with the increasing amounts of the synthesized adsorbent. The reduced decolorization capacity toward numerous types of dyes at high dosages of the prepared bio-MOF can be attributed to the unsaturated decolorization residual sites on the synthesized bio-MOF [1]. By contrast, increasing the dosage of the synthesized bio-MOF enabled the extra active sites available for dye decolorization, which in turn increased the removal percentage of the dyes from the wastewater. These findings can be attributed to the high surface area of the fabricated Zn-adeninate bio-MOF [48]. Therefore, the optimum dosages (or the economical dosages) of the synthesized Zn-adeninate bio-MOF were chosen as 0.5 and 1 g L−1 for the decolorization of MB and DR-81 dyes, respectively.

Influence of the dosage of the synthesized Zn-adeninate bio-MOF on the decolorization of (a) MB and (b) DR-81 (contact
3.2.4. Influence of Initial Concentrations of the Dyes on the Decolorization Processes
The effect of the initial dye concentration on the decolorization process was investigated in the concentration range of 5 to 100 ppm at the optimum contact time, pH, and material dosage for each dye solution. Figure 11 shows that the adsorption capacity increased as the initial dye concentration increased from 5 to 100 ppm, which agrees with the results of the previous investigations [12, 49]. This may be attributed to the saturation of the surface-active sites of the adsorbent at high initial concentrations of the MB and DR-81 dyes. These results indicated that the synthesized Zn-adeninate bio-MOF possesses practical and effective ability to decolorize the cationic and anionic dyes from the wastewater at different initial dye concentrations.

Effect of initial concentrations of the dyes on the adsorption capacity of the fabricated Zn-adeninate bio-MOF for MB and DR-81 (contact
3.2.5. Influence of Solution Temperature on the Decolorization of Cationic and Anionic Dyes
Figure 12 shows the influence of the solution temperature on the decolorization of the MB and DR-81 dyes by the synthesized Zn-adeninate bio-MOF. When the solution temperatures were increased from 23 to 85°C, the decolorization processes were enhanced, indicating a favorable decolorization process at high temperatures. These results indicated that the decolorization processes by the fabricated Zn-adeninate bio-MOF are endothermic [1].

Effect of the solution temperature on the adsorption capacity of the synthesized Zn-adeninate bio-MOF for MB and DR-81 (contact
3.2.6. Thermodynamic Modeling of the Decolorization Processes
The decolorization mechanism in terms of favorability, energy, and reversibility was studied and analyzed using the decolorization thermodynamics. To determine the thermodynamics of the decolorization process, the changes in enthalpy (
The standard entropy and enthalpy values were calculated using the Van’t Hoff equation as
The Hoff plot for
The values of the thermodynamic parameters (
Thermodynamic parameters for the decolorization of MB and DR-81 by the synthesized Zn-adeninate bio-MOF.
3.2.7. Equilibrium Isotherms of MB and DR-81 Decolorization
To examine the decolorization behaviors of the MB and DR-81 dyes by the synthesized bio-MOF, three models, namely, Langmuir, Freundlich, and Temkin, were utilized. For nonlinear estimation, a trial-and-error method was developed to minimize the error distribution between the experimental and theoretical adsorption data using the Solver add-in of Microsoft Excel. The Langmuir nonlinearized plots exhibited good correlation coefficients (
A comparison of the nonlinear fittings of the Langmuir, Freundlich, and Temkin models is presented in Figure 13 and Table 2.

Adsorption isotherms for MB and DR-81 by the synthesized bio-MOF.
Isotherm parameters of the Langmuir, Freundlich, and Temkin models for the decolorization of MB and DR-81 by the synthesized bio-MOF.
The Langmuir model was found to be the most appropriate for describing the dye removal processes of MB and DR-81 by the synthesized bio-MOF because this model showed the highest correlation coefficients. Additionally, the values of the separation factor
3.2.8. Comparison of the Decolorization Capacity of MB and DR-81 for the Synthesized Zn-Adeninate Bio-MOF with other Adsorbents
The monolayer decolorizing capacities (
Comparison of the monolayer decolorization capacities of MB and DR-81 for different nanoadsorbents.
3.2.9. Decolorization Kinetic Analysis of the MB and DR-81 Dyes
Pseudo-first-order and pseudo-second-order models were used to understand the decolorization kinetics of MB and DR-81 by the synthesized Zn-adeninate bio-MOF. The two nonlinear decolorization models can be described by Equations (9) and (10), respectively [59, 60]:
The correlation coefficients of the four kinetic models are listed in Table 4. The nonlinearity of
Parameters of the kinetic models for MB and DR-81 removal by the synthesized Zn-adeninate bio-MOF.
3.2.10. Decolorization Mechanism of MB and DR-81 by the Synthesized Bio-MOF
The FT-IR spectra before and after the decolorization of MB and DR-81 were compared, as shown in Figure 14. Following MB and DR-81 adsorption, the FT-IR spectra showed distinct changes due to the decolorization of the cationic and anionic dyes by the Zn-adeninate bio-MOF. The transition in the peak at 1005 cm−1 may be due to the symmetric bending of S–O in MB with Zn bio-MOF. Furthermore, the variation in the characteristic peak at 1600 cm−1 may be due to the chemical combination of C–C in Zn bio-MOF with the electrophilic N+ groups of DR-81 and MB [1]. Furthermore, the Zn–O peak in the lower wavenumber region shifted, indicating the interaction between Zn–O and the positively charged groups in the dyes [64]. The characteristic peak of the asymmetric vibration at 3611 cm−1 shifted, indicating chemical bonding between the –NH2 group and positively charged functional groups of the dyes [36]. These findings indicated that the decolorization mechanism of the MB and DR-81 dyes by the synthesized Zn-adeninate bio-MOF might be chemically controlled.
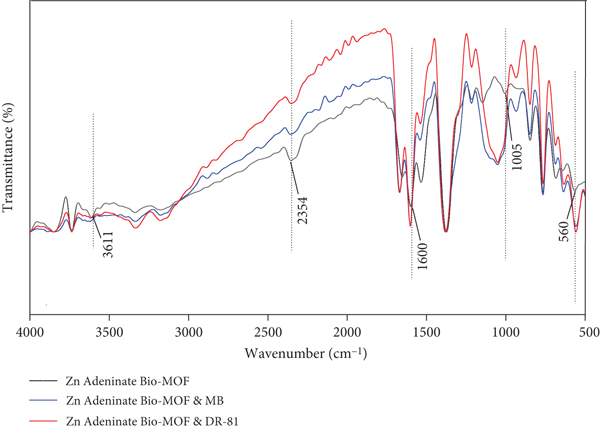
Comparison of the FT-IR spectra of (a) the synthesized Zn-adeninate bio-MOF, (b) Zn-adeninate bio-MOF and MB, and (c) Zn adeninate bio-MOF and DR-81.
3.2.11. Recyclability Study of the Synthesized Zn-Adeninate Bio-MOF
The regeneration of the adsorbent is significant because it affects the cost of practical applications [1, 14]. The synthesized adsorbent was washed and reused to decolorize MB and DR-81 from wastewater. The decolorization-desorption cycles were repeated five times, as shown in Figure 15. The results indicated that the prepared Zn-adeninate bio-MOF could be reused several times with high decolorization performance for both MB and DR-81 [1].

Reusability test of the synthesized Zn-adeninate bio-MOF against cationic and anionic dyes.
4. Conclusions
In this study, a novel, efficient, environmentally benign, and nontoxic adsorbent of porous Zn-adeninate bio-MOF was reported for the decolorization of both cationic and anionic dyes from wastewater. The prepared Zn-adeninate bio-MOF was characterized using different techniques, such as XRD, FT-IR, BET, SEM, TEM, XPS, and TGA. The synthesized Zn-adeninate bio-MOF had a surface area of 52.62 m2 g−1 and total pore volume of 0.183 cm3 g−1. The decolorization processes of the MB and DR-81 dyes were in agreement with the Langmuir model, which represents monolayer decolorization by the prepared Zn bio-MOF. The best-fit kinetic model for the MB and DR-81 dye decolorization was the pseudo-second-order model. Furthermore, the maximum decolorization capacity of the synthesized Zn-adeninate bio-MOF against MB and DR-81 was 132.15 and 82.54 mg g−1, respectively. The synthesized Zn-adeninate bio-MOF could be reused several times with a high decolorization performance. Accordingly, the prepared Zn-adeninate bio-MOF is a promising and effective adsorbent for MB and DR-81 from wastewater, with high stability and good reusability for numerous cycles.
Footnotes
Data Availability
All the investigated data in this study are included in the submitted article.
Conflicts of Interest
The authors declare no conflicts of interest.
Acknowledgments
This work was supported by the Science, Technology & Innovation Funding Authority (STDF) (grant number 43565).