
Abstract
In this study, the CeO2-Fe2O3 mixed oxide catalysts have been prepared by combustion method using gel-created tartaric acid. The ability of effective carbon monoxide (CO) oxidation to carbon dioxide (CO2) by CeO2-Fe2O3 catalyst under low-temperature conditions was also demonstrated. The calcined CeO2-Fe2O3 material has a porous honeycomb structure and good gaseous absorption-desorption ability. The solid solution of CeO2-Fe2O3 mixed oxides was formed by the substitution of Fe+3 ions at some Ce4+ ion sites within the CeO2 crystal lattice. The results also showed that the calcination temperature and the molar ratio of Ce3+ ions to Fe3+ ions (CF) affected the formation of the structural phase and the catalytic efficiency. The catalytic properties of the CeO2-Fe2O3 mixed oxide were good at the CF ratio of 1 : 1, the average crystal size was near 70 nm, and the specific surface area was about 20.22 m2.g-1. The full conversion of CO into CO2 has been accomplished at a relatively low temperature of 270 °C under insufficient O2 conditions.
1. Introduction
Every year, the world emits a large amount of CO gas from thermal power plants, metallurgical plants, vehicles, wood burning, and waste burning. According to research in several developmental countries, thousands of people are died each year due to CO gas poisoning [1, 2]. The easy cause of CO gas poisoning is because its colorless, odorless, and nontoxic properties are difficult to recognize. CO gas is the incomplete oxidation product of carbon compounds at low temperatures and O2 deficiency [3–5]. Under suitable conditions, CO exhibits strong reducing properties for medium metal oxides, so it has been studied and used in the metallurgical industry early [6]. Because of its possible toxic property to humans, the study and treatment of CO gas together with its secondary CO2 product are very important. In some technical and industrial fields, CO2 has begun to be captured and applied to reduce the greenhouse effect [7]. There are two popular methods for CO treatment as follows: adsorbing to capture CO gas [8–10] or converting CO to CO2 by metal oxide catalysts [11].
Nowadays, CeO2 is one of the important metal oxides in gas conversion catalysis. Cerium (Ce) belongs to the rare earth family and orders the second in the lanthanide series. Ce reserves account for a small proportion of the earth’s crust, so exploitation is difficult and expensive. Ce has the electron configuration [Xe]4f15d16s2, which it can exist in the oxidation states Ce+3 ([Xe]4f15d6s) and Ce+4 ([Xe]4f5d6s). Thus, CeO2 and Ce2O3 are the compounds of Ce with oxygen, and CeO2 is more stable due to the electron configuration of Ce+4 ([Xe]4f5d6s) being similar to that of the inert xenon gas [12]. The flexible conversion of the two Ce4+ and Ce3+ states through the electron donor mechanisms on the surface of CeO2 makes it widely used in catalytic reactions such as wastewater treatment [13–16], water-gas phase transition [17], and gas conversion [18–21]. CeO2 oxides can be prepared by hydrothermal method [21, 22], coprecipitation [23–25], sol-gel [19, 26], impregnation [27], and combustion [18]. The choice of the fabrication method decides the crystal structure, morphology, and physicochemical properties of CeO2, leading to affect the CO conversion ability of the catalyst [21, 22, 28]. The surface of the fabricated CeO2 crystals is often imperfect due to lattice defect, vacuous O2- ion (denoted VO) sites, and unsaturated bonds leading to the existence of Ce3+ and Ce4+ states [20, 29]. The ratio between the number of Ce3+ ions to Ce4+ ions (Ce3+/Ce4+) is related to the number of VO vacancies on the CeO2 crystal surface, so it determines the oxygen storage capability and oxygen lease capability [25]. When the Ce3+/Ce4+ ratio is large, the number of VO vacancies on the surface is also large [30]. Besides, the number of VO also depends on the crystal morphology, and it decreases gradually with nanorods > cubes nanoscale > nanopolyhedra [29]. The density functional theory (DFT) calculations show that for low-index faces, the energy to release an O2- ion from the lattice to create a VO vacancy of (111) face is the largest in comparison with the (110) and (100) face, so the number of VO on the faces decreases in the order (110) > (100) > (111) [29]. In addition, CeO2 is a direct bandgap semiconductor with bandgap energies of 2.56 eV for the bulk sample and 3.23 eV for the nanoscale, corresponding to the absorption transition energy 2p (O2-) →4f (Ce4+) [26, 30]. When an O2- ion on the crystal surface gets an excitation agent to promote the electron transition 2p → 4f, it will separate from the crystal lattice leaving a VO vacancy in company with the oxidation state transformation Ce+4(4fo) → Ce+3(4f1) [11]. VO vacancies are capable of adsorbing CO or O2 molecules at these positions, so they play an important role in catalytic reactions. An O2 molecule can be captured by a VO vacancy to form an O2- lattice ion [31]. The combination reactions of CO molecules with the absorbed O2 molecules on the surface of the oxide catalyst are occurred by the Langmuir-Hinshelwood (L-H) mechanism or with the O2- ions of the lattice by the Mars-van Krevelen (M-K) mechanism [29]. The CeO2 oxide catalyst material becomes thermal stable, has a fast catalytic rate, and has a low catalytic temperature when combined with some rare metals such as Pt [32], Pd [33], Au [34], and Ag [35]. However, a current trend uses the low-cost transition metal iron (Fe) element to make Fe2O3-CeO2 mixed oxides. In nature, iron exists in both Fe2+ and Fe3+ oxidation states. The radius of Fe3+ ion (0.64 Å) is smaller than that of Ce4+ ion (1.01 Å), so the substitution of Fe3+ ions in some Ce4+ ion positions can shrink the CeO2 crystal lattice, the
From the above-mentioned characteristics, it shows that the CeO2-Fe2O3 mixed oxide material has many advantageous photochemical properties that need further studying and applying for life. This study was carried out with the purpose of making CeO2-Fe2O3 mixed oxide materials from popular Fe metal, reducing the content of rare earth Ce and the reactive catalytic temperature of complete CO conversion to CO2 while applying to treat the exhaust gas in simple incinerators.
2. Chemicals and Experiments
2.1. Preparation of Mixed Oxide Catalysts
High-purity chemicals were used as Fe(NO3)3·6H2O (99.98%), Ce(NO3)3·6H2O (99.98%), and tartaric acid (TA) (99.98%). TA was dissolved with twice distilled water at 80 °C to get A solution. The above nitrate salts were also dissolved to give B solution such that the molar ratio of CF mixture to TA solution always was 1 : 3. A regulator matter was utilized to keep the pH of the solution equal to 2. The B solution was slowly added to the A solution, stirred, and heated at 80 °C for 2 h to obtain a pale-yellow homogeneous gel solution. The gel was then dried at 100 °C for 4 h to obtain a porous shape sample. The obtained sample was analyzed by TGA to investigate the phase transition of the sample in accordance with the calcination temperature. The samples calcined in turn at 450, 550, 650, 750, 850, and 950 °C for 2 h to obtain mixed oxides which denote as CF450, CF550, CF650, CF750, CF850, and CF950. To investigate the influence of the CF molar ratio on the structural phase formation of mixed oxides, the weight of the nitrate salts in the B solution was calculated so that the CF molar ratio of the obtained gels is in turn 9 : 1; 3 : 1; 1 : 1; 1 : 3, and 1 : 9. These gels, calcined at 650 °C for 2 h, received the mixed oxides of CF91, CF31, CF11, CF13, and CF19, respectively.
2.2. Analytics
2.2.1. Differential Thermal Analysis and Thermogravimetric Analysis
Differential thermal analysis (DTA) and thermogravimetric analysis (TGA) were performed on a Labsys Evo 1600 system. Samples were measured in air, heating rate 10 °C.min-1.
2.2.2. X-Ray Diffraction Analysis
X-ray diffraction (XRD) measurements of the studied samples were performed on a Siemens D5000 X-meter
2.2.3. Scanning Electron Microscopy Image
The surface morphology of the materials was recorded by scanning electron microscopy (SEM). Samples were measured on a Hitachi S-4800 instrument operating at 10 kV with a magnification of 80000-100000 times.
2.2.4. Determine the Specific Surface Area
The sample surface area was determined by the Brunauer-Emmett-Teller (BET) method on the Autosorb IQ Station measuring system. BET equation:
2.2.5. Fourier Transform Infrared Spectra
The Fourier transform infrared (FTIR) spectra of the samples were recorded in the range of wavenumbers from 400 cm-1 to 4000 cm-1 on the Impact 410 spectrometer.
2.2.6. Determination of CO Conversion
The TPSR temperature surface response program was conducted with a Siemens temperature controller. The CO conversion of the catalytic material performing on the microcurrent device was calculated by the following formula:
3. Results and Discussions
3.1. DTA and TGA Spectra of CeO2-Fe2O3 Mixed Oxides
The DTA and TGA spectra of the gel sample with the CF/TA ratio of 1 : 3 presented in Figure 1. The DTA curve showed the temperature increased from 100 °C to 250 °C. The sample weight decreased by 38.89%, with an endothermic peak at 217 °C. This reduction may be due to the physical evaporation of the adsorbed water on the gel surface [42, 43]. In the temperature range from 250 °C to 550 °C, the sample weight decreased by 34.83% on the TGA curve corresponding to the exothermic peak of 328 °C on the DTA curve, which was caused by the pyrolysis processes of the nitrate salts released O2 and NO2 gas; the combustion process of the TA released CO2 gas and H2O according to the following reactions (1), (2), and (3) [43, 44]:

TGA and DTA spectra of the gel sample with the CF/TA ratio of 1 : 3.
2C4H6O6+5O2 → 8CO2↑ +6H2O(1)
4Fe(NO3)3 →2Fe2O3+12NO2↑ +3O2↑(2)
2Ce(NO3)3 →2CeO2+6NO2↑ + O2↑(3)
or 4Fe(NO3)3 +2Ce(NO3)3 +2C4H6O6 + O2 →2(Fe2O3-CeO2) +18NO2↑ +8CO2↑ +6H2O(4)
When the temperature increased from 550 °C to 900 °C, the sample weight was almost unchanged, showing that the Fe2O3-CeO2 mixed oxide was formed and stable.
3.2. FTIR Spectra of CeO2-Fe2O3 Mixed Oxides
The appearance of vibrations characterized to the bonds of CeO2-Fe2O3 mixed oxide determined via the FTIR spectra. In Figure 2, the FTIR spectra of all samples in the broad absorption range from 3000 cm-1 to 3500 cm-1 appeared a peak at about 3378 cm-1 characterized by the stretching vibration of the O-H group because of the physically adsorbed water; however, this peak intensity decreased gradually as the calcination temperature of samples increased. A peak at about 2337 cm-1 characterized the stretching vibration of adsorbed CO2 molecules from the air for CF450, CF550, and CF650 samples, and this peak was completely suppressed for CF750 and CF850 samples. The peaks at 1630, 1380, and 1121 cm-1 represented the C=O and C-O stretching vibrations of the -COO- group [42, 43]. At the high calcination temperature, the process of CO2 separation occurred, so the absorption intensity of the band related to -COO- decreased and expanded into a large halo as on the CF850 sample. It is noteworthy that the appearance of the peak at 529 cm-1 with strong absorption intensity for samples calcined at 850 °C was typical for Fe-O vibrations, the peaks of 643 and 443 cm-1 were characteristic of Ce-O vibrations [42, 43, 45], and the above peaks appeared clear for the CF650 sample. This also shows that the characteristic phases of the CeO2-Fe2O3 mixed oxide were soon formed, and it was also consistent with the result of the TGA-DTA analysis.

FTIR spectra of gel samples with the CF/TA ratio of 1 : 3 calcined at different temperatures for 2 h.
3.3. The Role of Calcination Temperature and Metal Ion Molar Ratio in the Structural Phase Formation of CeO2-Fe2O3 Mixed Oxides
3.3.1. The Role of Calcination Temperature
The thermogravimetric analysis shows that the suitable calcination temperature range was from 450 to 900 °C. Figure 3 presents the XRD pattern of the CeO2-Fe2O3 mixed oxides calcined at 450, 550, 650, 750, 850, and 900 °C for 2 h. At 450 °C and 550 °C, the XRD pattern of CF450 and CF550 only appeared the (111), (200), and (220) faces corresponding to the

XRD pattern of CeO2-Fe2O3 mixed oxides. Samples with the CF molar ratio of 1 : 1 calcined at different temperatures for 2 h (a) and CF650 sample was redrawn (b).

The diffraction intensity on all faces became narrower and stronger as the calcination temperature increased. This meant that the samples had better crystallinity, a complete crystal structure, and larger crystal sizes [46]. However, when the samples calcined to 750 °C and 850 °C, a separating tendency of mixed oxide phase into two single oxide phases of CeO2 and Fe2O3 was happened because of these more thermal stable oxides. Based on the XRD pattern and Brass’ formula, it is able to determine the
The results showed that there was a slight increase of the
3.3.2. The Role of Metal Ion Molar Ratio
XRD pattern of CeO2-Fe2O3 mixed oxides with different CF molar ratios calcined at 650 °C for 2 h, as seen in Figure 4. When the molar quantity of Ce3+ ions was more than that of Fe3+ ions (CF91 and CF31 samples), the XRD pattern manifested the (111), (200), (220), (311), (222), (400), (331), (422), and (511) faces corresponded to the
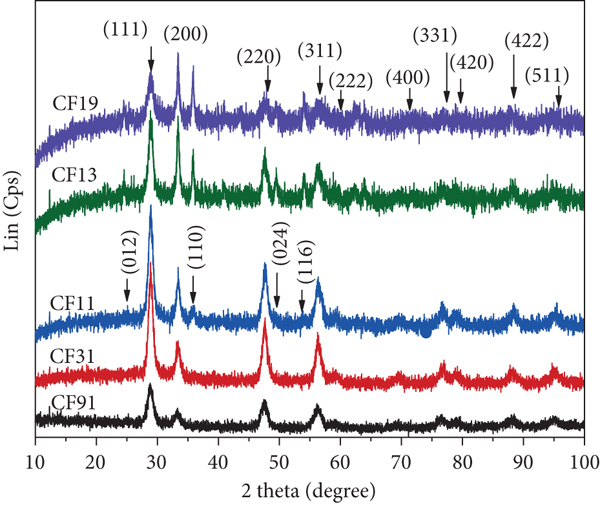
XRD patterns of CeO2-Fe2O3 mixed oxides. Samples with different CF molar ratios calcined at 650 °C for 2 h (a) and CF11 sample was redrawn (b).
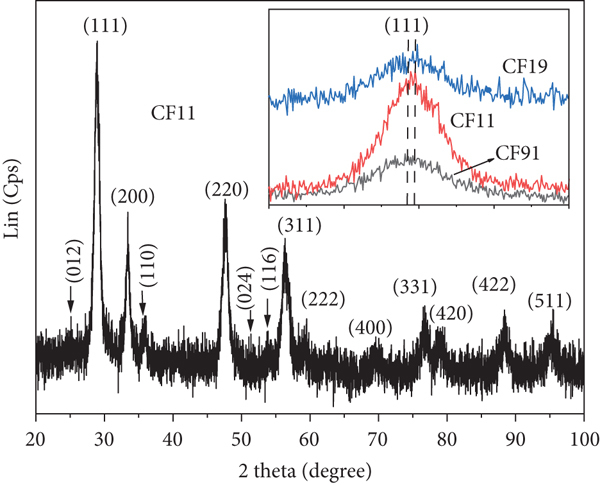
This may be because with the calcination condition to 650 °C, and the used Fe3+ ion content was smaller in comparison with the Ce4+ ion content, so Fe3+ ions were dissolved in the crystal lattice of CeO2 oxide [23]. When the molar quantity of Ce3+ ion and Fe3+ ions was equal, the characteristic faces of the Fe2O3 phase appeared and interwove with those of CeO2, and the XRD pattern of CF11 was presented again in Figure 4(b). The presence of the typical (110) face of Fe2O3 shows that the mixed oxide has separated into phases [47]. When the molar quantity of Ce3+ ions was smaller than those of Fe3+ ions (for CF13 and CF19 samples), the diffraction intensity on the (110) face became more narrow and stronger. This phenomenon was known that the molar quantity of Fe3+ ions in mixed oxides was high, which led to the split gradually mixed oxides into two individual oxide phases of CeO2 and Fe2O3 [23]. The
3.4. Morphology of Fe2O3-CeO2 Mixed Oxides
SEM images of the CeO2-Fe2O3 mixed oxides were shown in Figure 5 with the CF molar ratio of 1 : 1 which were calcined at temperatures of 450 °C, 650 °C, and 850 °C for 2 h. It is observed that the surface of the CF450 sample was porous. This is the characteristic of materials that are prepared by the combustion method using organic compounds to create gels (Figure 5(a)) [48]. For the CF650 sample, the porous property became clear to many honeycomb-like cavities. It can be explained that the molecular structure of TA consists of strongly polar functional groups HOOC(HO)CC(OH)COOH that played the role of stretching and uniformly dispersing Ce3+ and Fe3+ ions in solution [49]. At 650 °C, the decomposition of the organic component and the pyrolysis of nitrate salts led to a decrease in volume and mass, creating a system of space-connected microcapillary tubes (Figure 5(b)). This created a porous property of mixed oxides as well as the obtained result in other reports [50]. The average crystal size of the oxide was determined to be about 70 nm. For the CF850 sample, the crystals tended to break the spatial porous block into discrete nanosized particles (Figure 5(c)) [42].

SEM images of CeO2-Fe2O3 mixed oxides with the CF ratio of 1 : 1 calcined at 450 °C (a), 650 °C (b), and 850 °C (c) for 2 h.


From the dependence of

Nitrogen adsorption-desorption isotherms of CeO2-Fe2O3 mixed oxide with the CF molar ratio of 1 : 1 calcined at 650 °C for 2 h.
3.5. Process of CO Conversion to CO2
The process of CO oxidation by CeO2-Fe2O3 mixed oxide catalysts and the curves of CO conversion according to temperature is described via Figure 7. Under the catalytic temperature condition below 300 °C and deficient O2 gas, the activities of CO oxidation took place [6]. The CF91, CF31, CF13, and CF19 samples with the different molar quantities of Ce3+ and Fe3+ ions shown that the CO conversion curves were similar variation, and the ability of CO conversion was lower than that of the CF11 sample (Figure 7(a)). For the CF11 sample (also named as CF11(CF650) or CF650(CF11)), the CO conversion curve was left-skewed, meaning that at the same catalytic temperature, the CO conversion of the CF11 sample was higher and finished earlier than other samples. This can be because the molar quantity of Ce3+ and Fe3+ ions was the same, the quantity of O2- ions in the -Ce-O-Fe- bonds was more dominant than that in two -Ce-O-Ce and -Fe-O-Fe- bonds of other samples, so the catalytic reactions of CF11 sample also happened better than the others [38]. The CO conversion for all samples can be explained by the following reactions:

CO conversion of CeO2-Fe2O3 samples according to temperature. Samples with different CF molar ratios calcined at 650 °C for 2 h (a) and samples calcined at different temperatures for 2 h (b).

2CO + O2 →2CO2↑(7)
2CeO2 + CO → Ce2O3 + CO2↑(8)
3Fe2O3 + CO →2Fe3O4 (or FeO.Fe2O3) + CO2↑(9)
2FeO+2CeO2 (or 2FeO.CeO2) → Ce2O3 + Fe2O3 (or Ce2O3.Fe2O3)(10)
2Ce2O3 + O2 →4CeO2(11)
When the catalytic temperature increased from 75 °C to 175 °C, the amount of CO gas was converted about 12%; this may be because a part of CO gas was oxidized by O2 in (7) [11]. In addition, these reactions can also occur between adsorbed CO and O2 gases on the surface of the CeO2-Fe2O3 catalyst to emit CO2 by the J-H mechanism. When the temperature increased from 175 °C to 260 °C, the CO conversion was rapid for all samples but reached the fastest 50% at 211 °C for CF11. The intensification of CO oxidation can be because CO combines with an O2- at the lattice sites in -Ce-O-Fe-, -Ce-O-Ce- and -Fe-O-Fe- bonds to release CO2 by the M-K mechanism in (8) and (9) [27, 29]. The Fe3O4 product was a mixture of two FeO·Fe2O3 oxides, meaning that only a part of Fe3+ ions were reduced to Fe2+ ions. This low-temperature reaction was also carried out early by another researcher [6].
When the temperature was over 260 °C, the CO conversion process slowed down because it needed the recovery of the CeO2 oxidizing agent from Ce2O3 according to (10) and (11) and then reached 100% at 275 °C faster for the CF11 sample. The recovery here was due to the redox potential of Fe+3/Fe+2 (0.711 V) < Ce+4/Ce+3 (1.61 V) [20], so a tendency happened the redox process Ce+4 + Fe+2 → Ce+3 + Fe+3 [23, 52], or this was also the process of transferring an O2- ion from Ce4+ ion to a neighboring Fe2+ ion, creating the charge balance [38]. The (11) reaction turned Ce3+ into initial Ce4+, which was an important agent that helped Fe ion form a closed-loop bridge of oxidation states by the (9) and (10) reactions as follows: Fe2O3 → Fe3O4 → FeO → Fe2O3. The participation of Fe3+ ions in the mixed oxide made the deformation of lattice structure and increased the reaction centers of gases storage and release. Therefore, the conversion of CO to CO2 became more efficient under low temperatures and O2 deficiency [4, 5]. It can be seen that thanks to the redox process between Fe+2 and Ce+4, the catalyst system was restored to its original properties and was not degraded.
With the same catalytic mechanisms above, among all CeO2-Fe2O3 mixed oxide samples calcined at different temperatures for 2 h, the CO conversion of the CF650 sample was better than all of those (Figure 7(b)). The CF650 curve was also skewed to the left and rapidly reached 100% at 270 °C. It is possible that for the samples CF450 and CF550, the crystallization of the oxides had not been complete, and there were still carbonate components of organic combustion products as analyzed in the TGA-DGT and FTIR spectra, which interfered with the process of CO oxidation. For the CF750 and CF850 samples, the crystal grain size increased, and the surface area decreased, leading to a decrease in the contact and oxidation capacity. Moreover, at high calcination temperature, there was a tendency of phase separation into two single oxides as mentioned in the XRD pattern, so their oxidation ability became less than that of mixed oxide catalysts [23]. Thus, the calcination temperature changed the crystallinity and affected the CO catalytic ability of the CeO2-Fe2O3 mixed oxides. From the above arguments, it is able to describe the mechanisms of CO oxidation, capture O2, and release O2- ions, creating VO vacancies on the surface of CeO2 crystal, as shown in Figure 8.

The mechanisms of CO oxidation and the oxidation state conversion of metal ions between Ce+4/Ce+3 and Fe+3/Fe+2 pairs on the CeO2-Fe2O3 catalyst surface.
For the J-H mechanism, a CO molecule reacted with adsorbed an O2 molecule at VO vacancy to emit a CO2 molecule (7):
For the M-K mechanism, a CO molecule combined with an O2- ion of the crystal lattice to release a CO2 molecule and a VO vacancy (8) and (9).
The transformation of Ce+4 to Ce+3 and Fe+2 to Fe+3 was in (10).
The transformation of Ce+4 from Ce+3 after an O2 molecule was captured by a VO vacancy (11):
The CO conversion temperatures at
Some publications have shown that the
a,b,cThe maximum CO conversion catalytic temperatures (
The correlation between
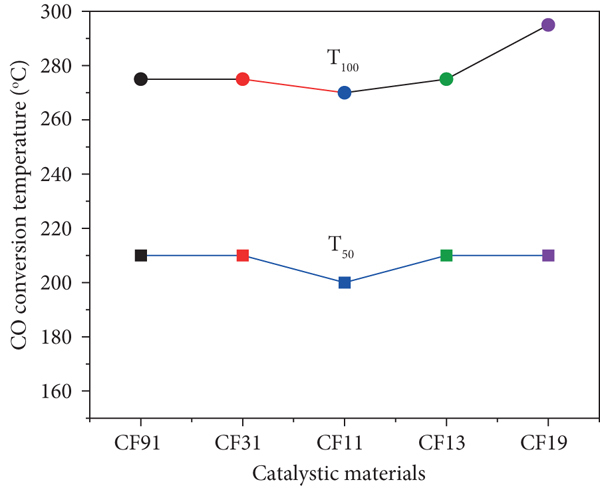
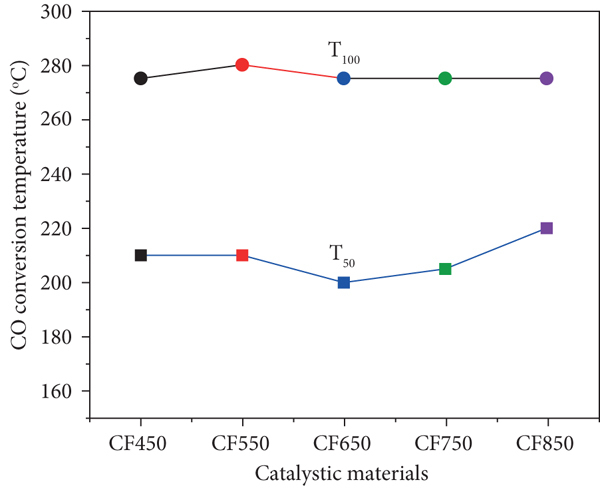
Figure 10 shows five oxidation cycles at
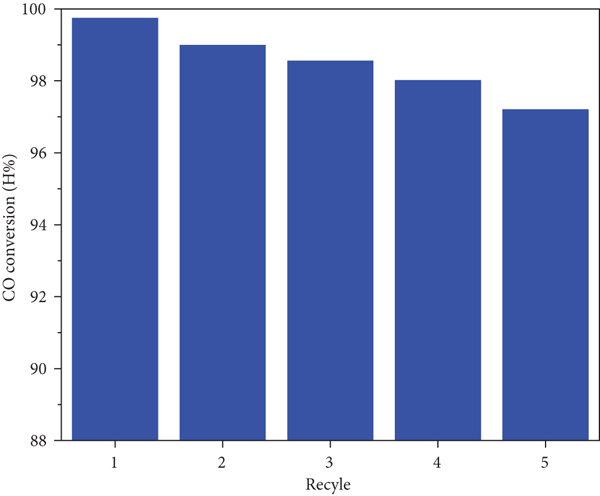
CO conversion of sample CF650(CF11) at

The studied results showed that Fe3+ ions joined in CeO2 crystal lattice, which has caused the deformation of the lattice structure, increasing the quantity of VO vacancies. The VO vacancies acted as the reaction centers, thereby promoting easier oxidation processes. The CeO2-Fe2O3 mixed oxide catalysts are fabricated by the combustion method using gel-created TA matter for CO conversion is effective.
4. Conclusion
CeO2-Fe2O3 mixed oxides have been prepared successfully by the combustion method using gel-created tartaric acid. The solid solution of CeO2-Fe2O3 mixed oxides formed a molar ratio of Ce+3 ions to Fe3+ ions of 1 : 1 at 650 °C for 2 h with a uniform average crystal size of 70 nm and a surface area of 20.22 m2.g-1. In particular, the transformation of metal-ion states in Fe3+/Fe2+ and Ce4+/Ce3+ pairs through the redox processes have formed a closed loop of Fe-ion oxidation states: Fe2O3 → Fe3O4 → FeO → Fe2O3, and maintains the catalytic properties of the CeO2-Fe2O3 mixed oxides. The participation of Fe-metal ions in CeO2-Fe2O3 mixed oxide solution enhanced the density of VO vacancies and promoted the catalytic reactions of CO conversion. The choice of Ce3+ to Fe3+ molar ratio of 1 : 1 has halved the needed Ce content. The complete conversion of CO into CO2 has taken place at a low temperature of 270 °C under deficient O2 conditions. The studied results can open a prospect of using CeO2-Fe2O3 mixed oxide catalysts for simple CO emission incinerators.
Footnotes
Data Availability
The data used to support the findings of this study are available from the corresponding author upon request.
Conflicts of Interest
The authors declare that they have no conflicts of interest.
Acknowledgments
This research is funded by the Vietnam Academy of Science and Technology (reference number TĐVLTT.01/21-23).