
Abstract
Equilibrium and kinetic adsorption behaviours of hydrogen fluoride (HF) onto zeolite 3A were investigated under different temperatures (298–338 K) and pressures (0.15–1.1 bar). The HF adsorption isotherms on zeolite 3A were well described by the Dubinin–Astakhov (DA) model. The isosteric heat of HF adsorption was calculated based on the DA model and Clausius–Clapeyron equation, and different kinetic models were used to analyze the HF adsorption kinetic. The results showed HF adsorption isotherms are type I of the IUPAC classification. The maximum adsorption capacities by the DA model are 0.443–0.5631 mg/g. The
1. Introduction
Fluorine-containing chemicals are widely used in atomic energy, metallurgy, machinery, chemical industry, and other industries because of their unique physical and chemical characteristics [1]. As a basic fluorine chemical product, hydrogen fluoride (HF) is widely used in producing refrigerants, fluorine resin, fluorine rubber, and fluorine-containing intermediate and fine chemicals [2]. HF is corrosive and toxic, and it poisons humans and animals through the food chain, destroys the normal metabolism of calcium and phosphorus, inhibits enzyme activity, and affects the nervous system [1]. In the use of fluorine (F2), e.g., uranium enrichment, optics, and material fluorination, HF is often accompanied by F2, which reduces the purity of fluorine [3–5]. Therefore, HF purification treatment and recovery are indispensable to save resources and protect the environment.
The common methods of collecting and recovering HF are compression condensation, absorption, and adsorption [6]. The compression condensation method can purify HF gas well in theory, but this method needs low temperature and consumes more energy [7]. The HF amount treated by the absorption method is huge. However, absorption purification is wet with high requirements for equipment and chemical treatment problems [8]. Collecting HF by adsorption method cannot only remove HF gas but also reduce the emission of toxic gas HF and energy consumption. The adsorption method is mainly based on the HF adsorption performance. Thus, the basic HF adsorption data is required [9]. The frequently used adsorbents for HF adsorption are porous, e.g., sodium fluoride, activated alumina, activated carbon, and silica gel [2]. Zeolite is a commonly used adsorption material in gas separation and gas purification [6]. The application of zeolite can be extended to HF treatment.
The studies on HF treatment by adsorption have been investigated by some scholars. Sodium fluoride (NaF) is a commonly used adsorption material for HF [10–12]. NaF reacts with HF to produce NaHF2. When the temperature is higher than 250°C, NaHF2 can be decomposed into NaF and HF. Afzal et al. conducted experiments on HF adsorption with NaF by the fixed bed, and the influence of concentration, temperature, and other parameters on the surface loading has been studied in detail [10–12]. The experimental results show that Langmuir and Temkin can better describe the HF adsorption isotherm than Freundlich [11]. Moreover, Liu et al. used NaF to adsorb and remove trace HF in the production of high-purity tungsten hexafluoride, and the HF adsorption by NaF under different temperatures, pressures, and gas flows was measured by orthogonal test [13]. The results showed the suitable adsorption temperature was 20–80°C, and the flow rate has a significant effect on adsorption efficiency. Activated alumina (Al2O3) is also used for HF adsorption. Activated alumina reacts with HF to produce AlF3 and H2O. In addition, Wu et al. studied the adsorption characteristics and influencing factors for HF adsorption by Al2O3, and the relationships between crystal structure, the specific surface area of Al2O3, and HF adsorption have been considered [14]. Sheng studied the HF adsorption behaviour on activated carbon, calcium oxide, activated alumina, iron oxide, and fly ash, and the Freundlich model described the adsorption isotherms well [15]. In addition to NaF and Al2O3, some other porous materials are also gradually applied to HF adsorption. Che et al. studied the HF adsorption behaviour on DB18C6/SiO2 composite [16]. Siahooe et al. studied the HF adsorption on carbon nanotubes and found that the HF adsorption density decreased with temperature increase [17]. Wang et al. investigated the HF adsorption behaviour on three metal–organic frameworks (MOFs) and found that MOFs had better HF adsorption performance than commercial Al2O3 and 13X zeolite [18]. Bahrami et al. investigated the HF gas adsorption by three kinds of activated carbon under vacuum and described the experimental data by isotherm adsorption models [19].
Zeolite 3A is an excellent performance adsorbent for gas storage and separation [20]. However, the studies about HF adsorption on zeolite 3A are very lacking. Therefore, the study of the adsorption characteristics and influencing factors of HF on zeolite 3A is necessary. In this study, the equilibrium and kinetic adsorption curves of HF on zeolite 3A at different temperatures and pressures were measured. The HF adsorption isotherms on zeolite 3A were described by the three isotherms model. The DA model and the Clausius–Clapeyron equation were used to calculate the isosteric heat of HF adsorption, and different kinetic models were used to analyze the kinetic process for HF adsorption on zeolite 3A. The adsorption mechanism of HF onto zeolite 3A was evaluated based on kinetics and thermodynamics.
2. Materials and Methods
2.1. Materials
Zeolite 3A (8(K12[(AlO2)12(SiO2)12]·24H2O) used in this study was commercial zeolite manufactured by Lu Xinyuan Company (Henan, China). In this investigation, spherical 3A particles of 0.2 cm radius were studied. Hydrogen fluoride and helium with a purity of 99.99% were provided by China Shipbuilding (Handan) Perry Special Gas Co., Ltd.
2.2. Characterization of the Zeolite 3A
The compositions were measured by X-ray diffraction (XRD) using a Rigaku Smartlab 9kW with Cu Kα radiation (40 kV and 40 mA). The Fourier transform-infrared (FT-IR) of zeolite 3A spectra was obtained from an FT-IR spectrometer (Thermo Nicolet iS5, USA) using pellets of zeolite/KBr. The surface morphology was obtained by SEM (Zeiss sigma500) at an accelerating voltage of 10 kV. The pore structure distribution (PSD) of zeolite 3A was measured by the low-temperature CO2 adsorption method at 273 K using 3H-2000 PM.
2.3. Adsorption Isotherm and Kinetics Measurements
Equilibrium and kinetics measurements of HF adsorption on zeolite 3A were performed in a static volumetric instrument. The detailed composition of the experimental instrument is shown in Figure 1. The pressures of the experimental system were recorded using a precision pressure sensor (Keller, Switzerland, ±0.01% precision). An automatic thermostatic oil bath with ±0.01 K accuracy was used to keep the system temperature constant.

A schematic of experimental setup for HF adsorption.
The main experimental procedures for equilibria and kinetics adsorption are:
Sample pretreatment and filling. The 3A sample used in the adsorption experiment was first dried in the drying oven at 385 K for 24 h, weighed, and then quickly transferred to the sample cell. The constant temperature of the oil bath was set to 358 K and vacuumed for 12 h to remove the water and other impurities adsorbed in the sample transfer process Leakage test for adsorption system. After the sample pretreatment, the temperature of the oil bath was set to 338 K. After the system temperature is constant, helium (He) was fed into the reference and adsorption cells to a certain value (maximum pressure required for adsorption). The leakage testing time was 12 h. The system was heated and vacuumed for 4 h after the leakage test Measurement of void volume. The void volume of the adsorption cell filled with adsorbent was measured by the helium expansion method. The temperature for the helium expansion test was set to the adsorption experimental temperature. The helium density used in void volume measurement is calculated by the BWR equation [21]. Helium expansion tests were repeated at least four times and the values were averaged to minimize error Equilibrium adsorption experiment. A certain HF amount was injected into the reference cell when the temperature of the adsorption system was constant with the experimental setting value. The gas pressure for the reference cell was recorded until it is stable. The valve between the reference and sample cells was opened, the HF flowed into the sample cell from the reference cell and the adsorption began. The system pressure was recorded when the system pressure was constant for 5 h. The above operations were repeated until the maximum pressure point of the equilibrium adsorption is reached Adsorption kinetics experiment. HF was injected into the reference cell to a calculated pressure value when the temperature of the adsorption system was constant with the experimental set value. The valve between the reference and sample cells was then opened, the HF flowed into the adsorption cell, and the system pressure was recorded in real time by the high-precision pressure transmitter until the final system pressure was stabilized at the desired value. The kinetic experimental conditions were 0.15, 0.35, 0.5, 0.70, 0.95, and 1.10 bar at 298 K and 298, 308, 318, 328, and 338 K at 0.5 bar
During the experiment, the calculation process for HF adsorption capacity was based on the mass conservation under the ideal gas state, so the adsorption capacity is [19]:
2.4. Adsorption Theory
2.4.1. Isotherm Models
The relationship between adsorption capacity, temperature, and pressure in the adsorption process is usually described by the adsorption model. The Langmuir and Freundlich models had been successful in adapting the described HF adsorption process [11, 12]. The DA model is often used to describe the gas adsorption in micropores [22]. The DA model is expressed as follows:
The saturated vapor pressure
2.4.2. Heat of Adsorption
The isosteric heat of adsorption is an important thermodynamic parameter which indicates that heat released since the adsorbed state is more stable than the unadsorbed state for adsorbate molecule [24]. The Clausius–Clapeyron equation was used to calculate the isosteric heat at constant adsorption capacity, and its expression is as follows [24]:
The isosteric heat of adsorption (
2.4.3. Adsorption Kinetics
(1) Adsorption Rate Models. The pseudo first-order (PFO) model assumes that the adsorption rate is directly proportional to the number of active sites. The rate expression is given by [25, 26]:
After integrating Eq. (7) with the boundary conditions (
The pseudo second-order model (PSO) assumes the adsorption rate is proportional to the square of number of active sites; therefore, the rate model is given by [25, 26]:
With the boundary conditions (
(2) Diffusion Models.
Film diffusion
Boyd’s film diffusion model assumes that the main diffusion resistance is boundary film around the adsorbent particles [26, 27]. Therefore, the model was used to distinguish whether the film diffusion was a rate-controlling step in HF adsorption on 3A. The expression of this model is given by [26]:
where
when Interparticle diffusion
The model assumes interparticle diffusion control the adsorption rate, the model is given by the following expression [26, 27]:
By plotting Intraparticle diffusion
If the HF adsorption process on zeolite 3A is controlled by intraparticle diffusion, the HF adsorption (
3. Results and Discussion
3.1. Characterizations of the Zeolite 3A
The powder XRD pattern of zeolite 3A is shown in Figure 2. The XRD characteristic diffraction peaks are in accordance with 3A crystals by Wang [30], indicating that the sample is a typical 3A zeolite. The FT-IR of zeolite 3A spectra is shown in Figure 3. The broad bands around 3,447.9 cm−1 belong to the stretching vibration of the O-H group. The bands at around 1,659.3 cm−1 belong to the bending and tensile vibrations of the O-H and Si-OH groups, respectively [31]. At about 1,005.5, 665.8, and 462.9 cm−1, three typical absorption peaks formed by amorphous aluminosilicate structure were observed, which belong to the asymmetric tensile vibration of the tetrahedron in the sample, the symmetric tensile vibration of the Si-O-Si bond, and the bending vibration of T-O (T is Si or Al) bond, respectively [31]. The same absorption peaks have also been found by Cao et al. [31]. The absorption peak at 554.6 cm−1 belongs to the vibration of double binary ring D4R, the main subunit structure unit of zeolite 3A.

XRD pattern of zeolite 3A.

IR spectra of zeolite 3A.
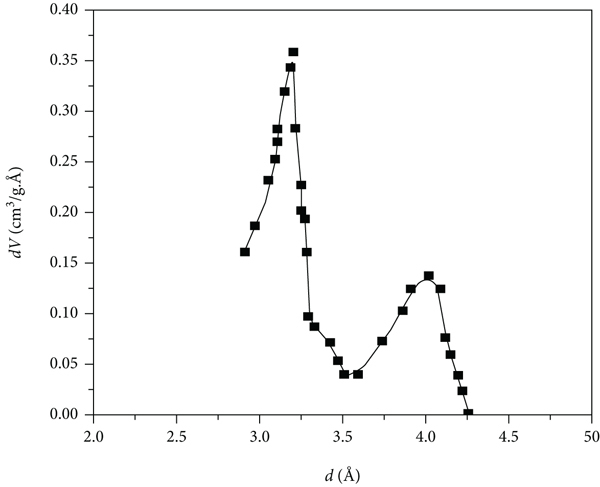
The surface morphology of zeolite 3A is shown in Figure 4, which indicates that the surfaces of the samples are not homogeneous. Zeolite 3A has a large grain size, good dispersibility, and many surface fractures, which has also been found in the literature [30]. The low-temperature CO2 isotherm and PSD of zeolite 3A are shown in Figure 5. The pore size of zeolite 3A is mainly concentrated at ~0.3 and 0.37 nm. The specific surface area of zeolite 3A and the pore volume are 402.81 m2/g and 0.1325 cm3/g, respectively.

SEM images of zeolite 3A.
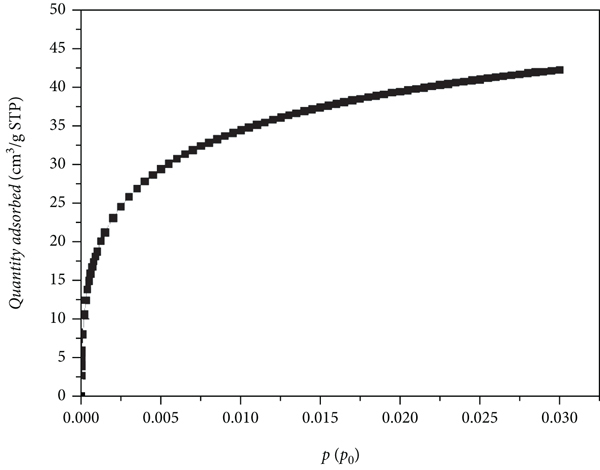
(a) Low-temperature CO2 isotherm. (b) PSD of zeolite 3A.
3.2. Adsorption Equilibrium
3.2.1. Adsorption Isotherms
The HF adsorption isotherms on zeolite 3A at 298 to 338 K are shown in Figure 6. All adsorption isotherms are type I according to the IUPAC classification. The adsorption amount of HF on zeolite 3A is close to that on activated carbon by Shen et al. [15] but less than that on activated carbon by Bahrami et al. [19] and MOF [18], which is mainly due to the pore characteristics and surface physicochemical properties of the adsorbent. The adsorption capacity increases with increasing pressure at the same temperature. The adsorption capacity decreases with the temperature increase because the binding strength of the zeolite 3A surface decreases with temperature, indicating that the HF adsorption on the zeolite 3A surface is exothermic. The Langmuir, Freundlich, and DA models were used to correlate the HF adsorption data using regression analysis [19]. Three statistical functions, including SSE, RMSE, and

Adsorption isotherm and DA fitting of HF on zeolite 3A.
The fitting parameter values for the three models are listed in Table 1. The Langmuir parameters
Fitting results of the studied isotherm model.
The values of SSE, RMSE, and
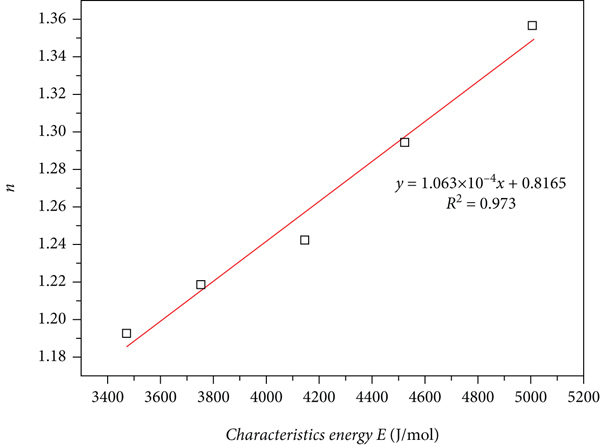
Linear relationship between DA parameter
The regeneration of 3A zeolite affects the reuse of materials [18]. The adsorption capacity after regeneration was tested at 298 K. The zeolite 3A after HF adsorption was treated at 393 K in the muffle furnace for 12 h and then quickly transferred and sealed to the adsorption equipment (sample cell in Figure 5) and then vacuumed at 373 K for 10 h to reactivate its capacity. The HF repeatability experiments on zeolite 3A at 298 K are shown in Figure 8(a). The remaining HF capacity after regeneration was slightly reduced, which suggested the high stability of exposure to dry HF gas. The IR spectra of the zeolite 3A before and after HF adsorption are shown in Figure 8(b), suggesting no change in the surface functional group of the zeolite 3A molecular sieve after HF adsorption.

(a) Repeatability experiments of HF on zeolite 3A at 298 K. (b) IR spectra of the zeolite 3A before and after HF adsorption.

3.2.2. Heat of Adsorption
The isosteric heat of adsorption (
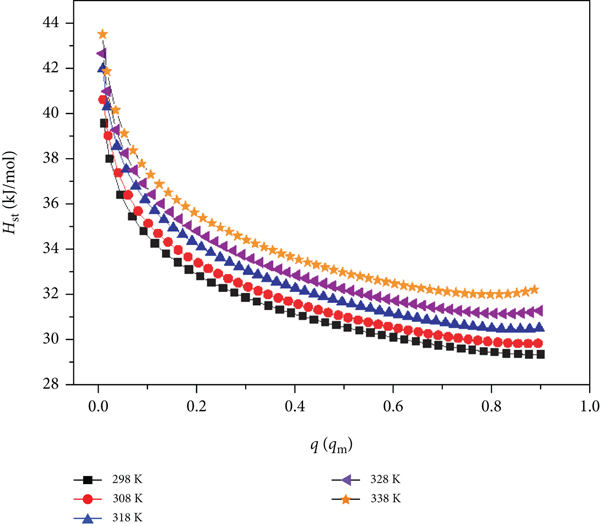
The isosteric heat of adsorption (
3.3. Adsorption Kinetics
3.3.1. Effect of Pressure on Adsorption Kinetic
The adsorption kinetic curve of HF on zeolite 3A at 298 K is shown in Figure 10. The adsorption capacity continuously increases with the adsorption time. The adsorption capacity rapidly increases in the initial stage, which is mainly due to the high adsorption energy sites on the adsorbent surface and the rapid occupation of HF molecules onto the adsorption sites, so the adsorption rate is high. When large numbers of active adsorption sites are occupied, the adsorption sites available for HF molecules become less; hence, the adsorption rate becomes slow. When the active sites are almost occupied, HF molecules reach dynamic equilibrium on the surface of zeolite 3A. At this time, the number of HF molecules on the adsorbent surface will not increase; therefore, the total adsorption rate tends to zero and the adsorption capacity will not increase.
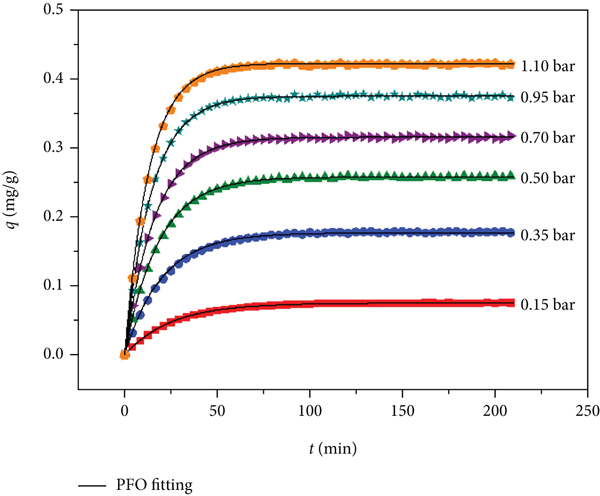
Dynamic curves of HF under different pressures at 298 K.
(1) Adsorption Rate. The HF adsorption kinetics curves and the corresponding curves predicted by the PFO model are shown in Figure 10. The kinetic constants calculated with the PFO and PSO models and the characteristic parameters of the kinetic model are listed in Table 2. The larger
The fitting kinetic parameters for PFO and PSO.
Both
(2) Diffusion Mechanism. The HF adsorption process on zeolite 3A can be divided into five continuous processes, as shown in Figure 11: (a) HF molecules diffuse from free state to adsorbent gas film (bulk diffusion), (b) HF molecules diffuse in the film (film diffusion), (c) HF molecules diffuse in pores between particles (interparticle diffusion), (d) HF molecules diffuse in 3A crystal (intraparticle diffusion), and (e) surface adsorption. Generally, surface adsorption and bulk diffusion are very fast, so they are ignored in the analysis of the HF adsorption kinetic process, and the role of the other three processes in the adsorption process is mainly considered.
Film diffusion

Adsorption mechanism of HF on 3A zeolite.
Equations (11)–(14) can be used to predict HF adsorption control by particle or film diffusion [26, 27]. By plotting Interparticle diffusion

Plots of Boyd’s film model for HF adsorption on 3A.
Kinetic parameters of linear fitting of film diffusion model.
The fitting results for the adsorption kinetics data with the interparticle diffusion linear form are shown in Figure 13 and Table 4. A good correlation between Intraparticle diffusion

Linear fitting for experimental data with interparticle diffusion model.
The linear fitting results for interparticle diffusion model.
The intraparticle diffusion curves for HF adsorption on zeolite 3A are shown in Figure 14. The curves are observed to be nonlinear. According to the intraparticle diffusion model, the adsorption amount

Prediction of intraparticle diffusion model for HF adsorption on 3A.
The adsorption rate of each HF molecule is controlled by four processes at a certain pressure. In the first stage, the adsorption rate is controlled by the film diffusion, as shown in segment I of Figure 14. The interparticle diffusion would be the rate-controlling process when the HF molecules diffuse into the particle pore. The intraparticle diffusion then controls the rate. Finally, the rate is governed by surface adsorption. The slope of each linear segment before region IV can be used to deduce which stage controls the whole HF adsorption rate [27]. Moreover, Figure 14 shows that the linear slope in region III is the smallest. The linear portion with the lowest slope is the rate-controlling step [27, 28]. This suggests that HF diffusion into the 3A particle is slower and the intraparticle diffusion stage is the rate-controlling stage. The linear slopes for regions II and III gradually increase with increasing pressure, which may be because the film thickness decreases as the pressure rises and the film diffusion rate will increase.
3.3.2. Effect of Temperature
Kinetic experiments at 298–338 K and 0.50 bar were conducted to investigate the effect of temperature on the HF kinetic adsorption on zeolites 3A. The HF adsorption kinetics curves at five temperatures are shown in Figure 15. The HF kinetic curves at five temperatures can be divided into three different stages: rapid adsorption, slow adsorption, and adsorption equilibrium stages. The HF adsorption capacity gradually decreases with increasing temperature, which is consistent with the discovery in literature [19]. High temperature enables the HF molecules to obtain more energy to overcome the intermolecular force and electrostatic interaction; thus, HF molecules remain in the free state. Simultaneously, the affinity between HF molecules and zeolite 3A surface will be weakened by the increasing temperature and will result in the decrease in adsorption capacity. In addition, high temperature is not conducive to the formation of a more orderly and stable configuration of adsorbed molecules, resulting in the reduction of adsorption capacity. Higher temperature is not conducive to improving HF adsorption recovery. It can also be found that the time to reach equilibrium decreases with the increasing temperature, which also shows that the temperature is conducive to the gas adsorption rate.

Dynamic curves of HF under different temperature at 0.5 bar.
(1) Adsorption Rate. The PFO and PSO models were used to predict the HF adsorption kinetic curves. The fitting results are shown in Figure 15 and Table 5. The adsorption rate constants
The fitting kinetic parameters for PFO and PSO.
(2) Diffusion Mechanism.
Film diffusion
The calculated Interparticle diffusion

Plots of Boyd’s film model for HF adsorption on 3A.
Kinetic parameters of linear fitting of film diffusion model.
The linear fitting results for the HF adsorption kinetic curve using the interparticle diffusion model at five temperatures and 0.5 bar are shown in Figure 17 and Table 7. A good correlation between Intraparticle diffusion

Linear fitting for experimental data with interparticle diffusion model.
The linear fitting results for interparticle diffusion model.
The quart-linear characteristics for intraparticle diffusion curves can be observed in Figure 18, which indicated that three different processes are involved in the adsorption mechanism. The curves of the five temperatures in the first stage I are relatively close, indicating that the influence of temperature on the HF diffusion velocity from the free state to and through the gas film of zeolite 3A is little. In the second and third stages, the difference between the five curves increases with time. The linear slope for each stage decreases with increasing temperature, suggesting that the pore diffusion rate in the particles decreases slightly at this stage, which may be due to the impediment of diffusion by the interaction of HF molecules under high pressure. The same trend is also found in CO2 in porous MgO [27]. The extended line for straight lines corresponding to regions II and III does not pass through the origin. The linear portion for stage III with the lowest slope indicates that the diffusion rate is controlled by intraparticle diffusion.

Prediction of intraparticle diffusion model for HF adsorption on 3A.
4. Conclusion
HF adsorption isotherms data on zeolite 3A at 298–338 K were type I. The adsorption capacity increased with increasing pressure and decreases with increasing temperature. HF adsorption isotherms data on zeolite 3A can be described well by the DA model. The
The HF adsorption by zeolite 3A at different adsorption conditions followed simple first-order kinetics. The first-order rate increased with pressure and temperature. The calculated
In this study, the HF adsorption mechanism onto zeolite 3A was evaluated based on kinetics and thermodynamics. However, only one adsorbent zeolite 3A was studied due to limited conditions, and other porous materials have not been analyzed in this paper. The adsorption kinetics and thermodynamics of HF on different materials will be compared in subsequent studies.
Footnotes
Data Availability
All data included in this study are available upon request by contact with the corresponding author.
Conflicts of Interest
The authors declare that they have no conflicts of interest.
Acknowledgments
This work was supported by the Project of the State Key Laboratory of Laser Interaction with Matter (SKLLIM1813), Natural Science Foundation of Hebei Province (E2020402072), and The Handan Science and Technology Research and development projects (19422091008-31).