
Abstract
This research work reports on pure and acid-treated fennel seed biomaterials for the removal of metal ions of copper Cu(II), lead Pb(II), and methylene blue (MB) dye from aqueous solution by batch adsorption. Pure fennel seeds were labelled as PFS; nitric and sulphuric acid-treated seeds were designated as NAFS and SAFS, respectively. The adsorbents were characterised by SEM, EDX, FTIR, XRD, and BET. The SEM images revealed that the surface of the adsorbents was porous. However, physicochemical characterization further revealed that BET surface area, pore size, and pore width increased for NAFS and SAFS compared to PFS. FTIR results revealed that the peaks for cellulose −COC and −OH decreased considerably for NAFS and SAFS; this indicated that cellulose was hydrolyzed during acid treatment. Adsorption data showed that all biomaterials had a higher affinity for MB dye more than Pb(II) and Cu(II) metal ions. The maximum adsorption capacities onto PFS were 6.834, 4.179, and 2.902 mg/g and onto NAFS are 15.28, 14.44, and 4.475 mg/g, while those onto SAFS are 19.81, 18.79 and 6.707 mg/g respective for MB dye, Pb(II), and Cu(II) ions. Postadsorption analysis revealed that adsorption of Pb(II) and Cu(II) was controlled mainly by the electrostatic attraction, while that of MB was synergistic of electrostatic attraction, π-π interaction, and hydrogen bond. It was found that the uptake processes of MB dye onto all adsorbents fitted Freundlich while both cations were described by Langmuir model. The thermodynamic parameters
1. Introduction
Pollution of water by harmful substances such as metals ions and dyes is a serious challenge faced by this generation. Over 100 million people worldwide do not have access to safe drinking water, and it is projected that this number will double in the near future [1, 2]. Excessive discharge of toxic metal ions and dyes into the environment and aquatic bodies primarily originates from numerous anthropogenic activities [3, 4]. Growing industrialization and urbanization have resulted in large amounts of pollutants such as toxic metals ions [copper Cu(II) and lead Pb(II)] and organic dye [methylene blue (MB)] that have been frequently encountered in water [5–7].
Copper, lead, and methylene blue are of importance in numerous factories and firms such as paints, textile, batteries, and mining. Copper is particularly identified as an essential mineral in biochemical processes at trace amounts. However, these substances are harmful to living organisms at high concentrations. Drinking water containing these toxic substances results in adverse health. Therefore, their presence in water is of critical concern.
Pb(II) ions are toxic and nonbeneficial to the human body. The maximum acceptable level of Pb(II) ions in drinking water has been set to 0.01 mg/L by the WHO [8]. Concentrations beyond the acceptable level are detrimental and cause dysfunction of the liver, kidney, brain, and reproduction system; mental retardation, and damages to the central nervous system [9]. On the other hand, Cu(II) ions are beneficial to the living organisms at low concentrations. The maximum acceptable concentration of Cu(II) ions in drinking water is 1.5 mg/L [10]. However, at high concentrations, Cu(II) causes stomach cramps, nausea, diarrhea metabolism disorder, damage to the neurological system, liver, kidney damage, and lungs [11]. MB dye has a poisonous effect on living organisms and the environment [12–16]. Its toxic effect includes mental disorder, vomiting, nausea, abdominal pain, eye burns, tissue necrosis, and cyanosis [17–19].
The degree of health problems caused by these substances is alarming. For this reason, several conventional technologies such as chemical, physical, and biological methods were developed for wastewater treatment. These includes filtration, advanced oxidation, flocculation and coagulation, catalysis, photo and chemical degradation, and adsorption [20]. However, due to low cost and easy operation, adsorption is the most appropriate and reasonable choice for the removal of organic pollutants and inorganic heavy metal ions from wastewater [21]. Adsorption is the process that involves deposition of pollutants onto the surface of the adsorbent, by interaction with functional groups on the surface [22, 23]. Biosorption is a green technology that typically employs agricultural materials as adsorbents for the removal of various pollutants from aqueous solution [24]. Agricultural and biogenic materials have attracted the attention of many researchers worldwide [7, 25, 26] due to the versatility shown by the materials in removing various pollutants from water.
In recent years, a number of agricultural materials and waste have been discovered for the removal of various pollutants in water. These biosorbents are materials such as paw-paw seeds [27], black cumin seeds [28], argan nut shell [29], rice husk [30], Corncob [31], and banana peel [32].
Fennel (Foeniculum vulgaris) is a perennial flowering plant species [33]. It belongs to a family of the Apiaceae [34]. It is cultivated in many parts worldwide. It is because the entire fennel plant is versatile; the leaves, seeds, stalks, and bulb are edible [35]. However, its flowers are used in the production of yellow and brown dyes [36]. For this reason, fennel plant and seeds are readily available and accessible. One of the commercial and traditional use of fennel seeds is to make fennel tea/drink [37, 38]. Thereafter, tons of used fennel seeds are disposed in the environment, and this in the near future will cause unbearable pollution. So the purpose of this study was to simulate the used fennel seeds and further chemically treat the seeds and apply them for the removal of Cu(II), Pb(II) ions, and MB dye from water.
The fennel seeds have been extensively used in medicine and culinary purposes [39–41]. This is because of the chemical content of the seeds such as vitamins, essential oil compounds, fiber protein, antioxidants, minerals, aroma, and flavour [34, 42]. The major structural constituents of fennel seeds are carbohydrates (51.5%), fats (33.5%), and proteins (15.6%). The carbohydrates found in fennel seeds are mostly lignocellulosic materials (hemicellulose, cellulose, and lignin) and small amounts of other natural occurring sugars [43]. Lignocellulosic materials are natural polymers, containing variety of monomers, especially different sugar units [35]. The structure of lignocellulosic materials consist abundant functional groups such as (−OH), (−CO), (−COOH), and (−C=C) which could be a good candidate for adsorption processes. However, very little attention has been given to fennel seeds as a potential adsorbent in the adsorption of pollutants.
The surface of agriculture materials has various functional groups. However, efforts have been made to enhance the adsorption performance of the materials. One process that addresses this issue is chemical modification by agents such as nitric acid [44] and sulphuric acid [45]. This promotes the content of oxygen containing functional groups and also increases the surface area as well as pore distribution on the surface of the material [46]. This results in the enhancement of the adsorption capacity.
Prior to this study, no similar work on fennel seeds was documented that reported on porous acid-treated fennel seeds. Also, to date, most studies on fennel seeds have explored the efficiency of removing pollutants primarily the adsorption focused on single pollutant removal ([47, 48] [49–51]). However, in reality, water pollutants coexist as mixtures in wastewater. No study has ever reported on the feasibility of fennel seeds when multiple pollutants coexist in solution. The targeted pollutants were selected due to their persistence in natural resources such as water and soil. The objective of this research work was to develop new porous fennel seed adsorbents for the removal of Cu(II), Pb(II), and MB from aqueous solution. The results from this study will add new knowledge to the database of fennel seed application in water treatment. The work also established the kinetics, thermodynamics, isotherms, and equilibrium studies of Cu(II), Pb(II), and MB towards fennel adsorbents. The reusability test of the adsorbents was evaluated.
2. Methodology
2.1. Chemicals and Materials
Unprocessed fennel seeds (brand: natural products) were purchased from Dischem Pharmacy in Vaal Mall, Vanderbijlpark. The following chemicals were used in this work: concentrated sulphuric acid (H2SO4)—99.99%, concentrated nitric acid (HNO3)—70.00%, lead nitrate (Pb(NO3)2)—99.95%, copper(II) nitrate hydrate (Cu(NO3)2)·2H2O—99.95%, and methylene blue (C16H18ClN3S)—95.00%. All chemicals were AR grade and obtained from Sigma-Aldrich, Johannesburg, South Africa.
2.2. Preparation of Biosorbents
2.2.1. Pure Fennel Seeds (PFS)
Several packs of fennel seeds were milled to a fine powder using a household blender. The obtained powder was put in boiling water for 30 min then dried in the oven overnight then passed through a sieve mesh of 0.8-1 mm. Then, the sieved material was labelled pure fennel seeds (PFS).
2.2.2. Sulphuric Acid-Treated Fennel Seeds (SAFS)
Exactly, 100 g of PFS was weighed and transferred to a beaker containing 1000 mL and diluted H2SO4 solution (5 M). The solution and material were stirred for 120 min at room temperature. Thereafter, the material was isolated and soaked in distilled water several times to get rid of excess acid. Afterward, the material was dried in an oven overnight. The resultant material was labelled sulphuric acid-treated fennel seeds (SAFS).
2.2.3. Nitric Acid-Treated Fennel Seeds (NAFS)
Exactly, 100 g of PFS was weighed and transferred to a beaker containing 1000 mL and diluted HNO3 solution (5 M). The solution and material were stirred for 120 min at room temperature. Thereafter, the material was isolated and soaked in distilled water several times to get rid of excess acid. Afterward, the material was dried in an oven overnight. The resultant material was labelled nitric acid-treated fennel seeds (NAFS).
2.3. Biosorption Procedure
A stock solution of 1000 mg/L containing Cu(II), Pb(II) ions, and MB dye was prepared using respective salts. A stock solution was prepared by dissolving 1 g each of the following salts: Cu(NO3)2, (Pb(NO3)2, and (C16H18ClN3S), in 1 L volumetric flask. The ratio of Cu(II) : Pb(II) : MB in the stock solution was 1 : 1 : 1. Then, the working standard solutions (20, 40, 60, 80, and 100 mg/L) were prepared from the stock solution (1000 mg/L) by a series of dilutions. Adsorption study of Cu(II), Pb(II), and MB onto PFS, SAFS, and NAFS was done by varying parameters such as the initial concentration of the solution, contact time, pH, and temperature of the system. The initial concentration of the solution was studied at 298 K for 120 min on working standard solutions (20, 40, 60, 80, and 100 mg/L). Contact time was evaluated at 298 K at time intervals 5-120 min on working standard solution 100 mg/L. pH was tested at 298 K for 120 min at various pH 1-8 on working standard solution 100 mg/L. The temperature of the system was evaluated at 288, 298, and 308 K for 120 min on a working standard solution of 100 mg/L. For each parameter, 10 mg of the adsorbent was transferred into 20 mL of the specified working standard in capped vials. To confirm repeatability of the results, the samples were prepared in duplicates, then agitated and rocked on an orbital shaker at 200 rpm. After the time has elapsed, the solid was separated from the solution by centrifugation at 2500 rpm for 5 min. The remaining supernatant solution was run on AAS and UV-vis.
2.4. Adsorption Data Management
Adsorption capacity (
3. Characterization
The adsorbents were characterized by SEM, EDX, FTIR, XRD, and BET to determine the surface morphology, chemical composition, functional groups on the surface of the biomaterials, phase, and nitrogen adsorption-desorption, respectively. SEM images and EDX spectra were taken on a Nova Nano SEM 200 from FEI operated between 5 and 15.0 kV. Clean sample holder and forceps were used to glue the sample on adhesive double-sided carbon conductive tape. Fennel seed adsorbents are nonconductive; therefore, a coating machine was used. Thereafter, the samples were transferred into the SEM for analysis. Perkin Elmer FTIR/FTNIR spectrum 400 (Massachusetts, USA) was operated between 4000 and 500 cm-1 to affirm the functional groups attached to the surface of the adsorbents. XRD spectra were obtained from MAXima_X 7000 operated between 2theta (10-60o). Micromeritics ASAP 2020 plus (Micromeritics Instrument, Georgia, Corporation, USA) was used to determine the BET surface area of the biomaterial under nitrogen adsorption-desorption; the sample was degassed for 12 hrs at 40°C. The concentration of MB dye before and after adsorption was measured. A Thermo Scientific Evolution 220 UV-Visible spectrophotometer was used to measure the concentration of MB before and after adsorption. Inductive couple plasma spectroscopy (ICP) and Thermo Scientific iCAP 7000 Plus Series ICP-OES spectrometer (Thermo Fisher Scientific, Massachusetts, USA) using ASX-520 autosampler were used to measure the solutions containing Pb(II) and Cu(II) ions before and after adsorption.
4. Results and Discussion
4.1. Characterization
4.1.1. SEM Analysis
The surface morphology of the adsorbents was analyzed by SEM images shown in Figures 1(a)–1(f). The images of PFS (Figures 1(a) and 1(b)) revealed that the surface of pure biomaterial had pores and bulges of different shapes and sizes. Similar results were observed by [49, 51] reporting on fennel seeds. It was also observed that the structure of the pure biomaterial was heterogeneous. However, upon nitric and sulphuric acid treatment in Figures 1(c) and 1(d) (NAFS) and Figures 1(e) and 1(f) (SAFS), respectively, refinements were observed. The images of NAFS in Figures 1(c) and 1(d) revealed that acid treatment entered the plant cell tissues and caused significant structural changes. The surface has been transformed into somewhat flaky arrangements that are horizontal and relatively porous. Also, the images of SAFS in Figures 1(e) and 1(f) showed that acid treatment had caused damage to the cell tissues. Thus, the inner surface was exposed and revealed amorphous structure that had pores. However, the refinements in SAFS were less compared to NAFS. Porous surfaces are important in adsorption processes of metal ions and dyes [52]. The main reason for the changes and refinements in morphologies could be due to the hydrolysis of cellulose, lignins, and hemicellulose in the biomaterial during nitric and sulphuric acid treatment [53, 54].

SEM analysis of pure ((a, b) PFS) and treated ((c, d) NAFS and (e, f) SAFS) fennel seed adsorbents.
4.1.2. EDX Analysis
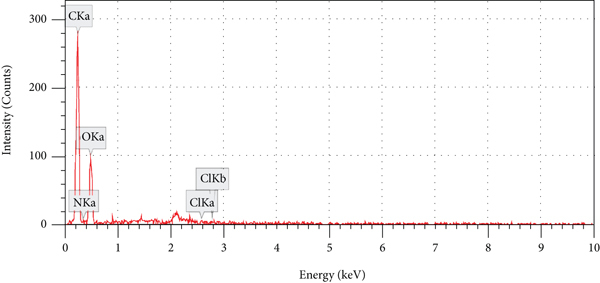
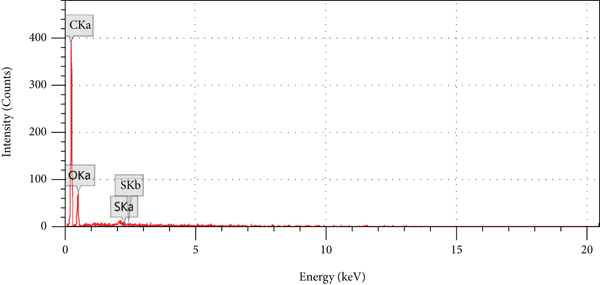
EDX analysis in Figures 2(a)–2(c) was carried to evaluate the elements present on the biomaterials. The plots indicate that carbon and oxygen (C and O) are the dominant constituents. This is in full agreement with the chemical composition of lignocellulose materials which are the main ingredients of biomaterials generally. These elements are typically recorded in agriculture materials [55, 56]. The results for PFS (Figure 2(a)) also recorded the presence of phosphorus (P) and chloride (Cl). Telkapalliwar and Shivankar, [57] reported similar results, and such elements are naturally occurring in plant-based materials. The plots of NAFS (Figure 2(b)) and SAFS (Figure 2(c)), moreover registered nitrogen (N) and sulphur (S), respectively. The presence of these elements may be attributed to the pretreatment of the biomaterial with nitric and sulphuric acids. This resulted in nitrogen (N) and sulphur (S) groups been functionalized to the treated biomaterials. The registered elements are compared in Table 1.
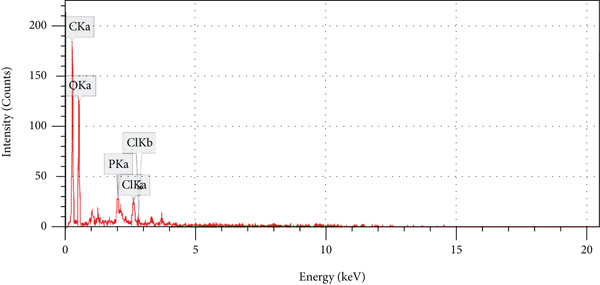
EDX plots of pure ((a) PFS) and treated ((b) NAFS and (c) SAFS) fennel seed adsorbents.
EDX chemical composition comparison study of fennel seed adsorbents.
4.1.3. FTIR Analysis
The FTIR spectra of the biomaterials are shown in Figure 3. It was observed that PFS had a peak for the hydroxyl (-OH) group at 3291 cm-1. The peak for (−OH) was linked to cellulose (−COC) content in the biomaterial around 1016 cm-1 [49]. However, both peaks significantly decreased in intensity and slightly shifted to high wavenumber in NAFS and SAFS. The changes in the spectra of NAFS and SAFS indicated that some of the components especially lignocellulose materials were hydrolyzed from the seeds during acid treatment [58]. The peak for (−CH=CH) at 2993 cm-1 was observed in PFS and SAFS but not in NAFS. The strong peaks for (−CH) stretch at 2927 and 2858 cm-1 were exhibited by all adsorbents; this was associated with (−CH) vibration of the carboxylic group [50]. PFS observed a peak for the carboxylic group (−COOH) at 1587 cm-1. However, in both NAFS and SAFS, the peak for (−COOH) shifted to 1623 cm-1. Carbonyl group (−C=O) for amide was observed at 1738 cm-1 in all materials. A peak at 1306 cm-1 was observed in NAFS alone; this might be due to the formation of nitrate (−NO) group on the surface of the material [59]. A new peak was formed in NAFS and SAFS at 1451 assigned to stretch of (−CO) group for primary alcohol [48]. A newly developed peak at 1141 cm-1 in SAFS was attributed to the sulphonate (−SO) group introduced into the material during pretreatment ([60]), while for NAFS the peak around 1141 cm-1 was assigned to (−CO) group for primary alcohol.

FTIR spectra of pure (PFS) and treated (NAFS and SAFS) fennel seed adsorbents.
4.1.4. XRD Analysis
The XRD results of PFS, NAFS, and SAFS are shown in Figure 4. The diffraction peaks in PFS at 19.89, 23.02, and 23.95o are characteristic to amorphous cellulose in the biomaterial [58]. However, in NAFS and SAFS, a sharp peak at 19.89o considerably decreased in intensity while a doublet positioned at 23.02 and 23.95o disappeared. This was due to hydrolysis of cellulose from the biomaterial during nitric and sulphuric acid [61].

XRD spectra of pure (PFS) and treated (NAFS and SAFS) fennel seed adsorbents.
4.2. Physicochemical Characterization
The data in Table 2 show the results for physicochemical characterization of the fennel adsorbents. pH(PZC) plays a vital role in adsorption processes; it influences the ionization state of the adsorbents. The data show that the values of pH(PZC) for PFS, NAFS, and SAFS were found to be 7.53, 6.05, and 6.18, respectively. The results for PFS were close to neutrality, while those of NAFS and SAFS were slightly acidic. Moreover, the data revealed that BET surface area, pore size, and pore width increased for NAFS and SAFS compared to PFS. The obtained results suggested that NAFS and SAFS may be efficient adsorbents in the uptake processes.
Physicochemical characterization of pure (PFS) and treated (NAFS and SAFS) fennel seed adsorbents.
4.3. Adsorption Studies
4.3.1. Concentration Effect and Isotherm Studies
The influence of initial concentration on the adsorption of Pb(II), Cu(II), and MB was evaluated on solutions 20-100 mg/L at 298 K in Figures 5(a)–5(c). The plots (Figures 5(a)–5(c)) showed that the uptake of the pollutants increased when the initial concentration of the solution was increased [62]. Therefore, the adsorption of Pb(II), Cu(II), and MB onto PFS, SAFS, and NAFS was concentration dependent. At the initial concentration of 20 mg/L, it was observed that the mass transfer was low, due to hindering forces such as high mass transfer resistance [63]. However, at the initial concentration of 100 mg/L, the chances of collision between Pb(II), Cu(II), and MB with the adsorbent surface were greater resulting in higher mass transfer [64]. It was observed that all biomaterials had a higher affinity for MB dye than for Pb(II) and Cu(II) metal ions. The maximum adsorption capacities on 100 mg/L solutions onto PFS were 6.834, 4.179, and 2.902 mg/g for MB, Pb(II), and Cu(II), respectively. Adsorption of pollutants from bulk solution was controlled mainly by three steps: (i) film and particle diffusions which involves movement of pollutants from the solution to the exterior surface of the adsorbents and then to the interior surface ([65]), (ii) pore diffusion whereby pollutants were trapped in the pores on the surface of the adsorbent ([66]), and (iii) electrostatic attraction and pi (π) interaction between MB and the adsorbents. Furthermore, the maximum adsorption capacities onto NAFS for MB, Pb(II), and Cu(II) were enhanced to 15.28, 14.44, and 4.475 mg/g. However, for SAFS, the maximum adsorption capacities further improved for all pollutants to 19.81, 18.79, and 6.707 mg/g, respectively.
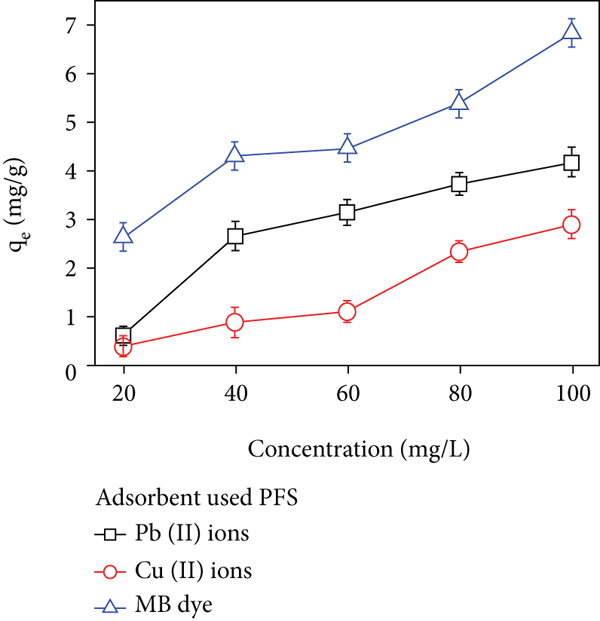
Effect of the initial concentration of Pb(II), Cu(II), and MB onto pure (a) PFS and treated (b) SAFS and (c) NAFS fennel seed adsorbents (system parameters:


To evaluate whether the uptake processes followed the Langmuir or Freundlich isotherm model, the value of
Isotherm models for the adsorption of Pb(II), Cu(II), and MB onto pure (PFS) and treated (NAFS and SAFS) fennel seed adsorbents.
4.3.2. Time Effect and Kinetic Studies
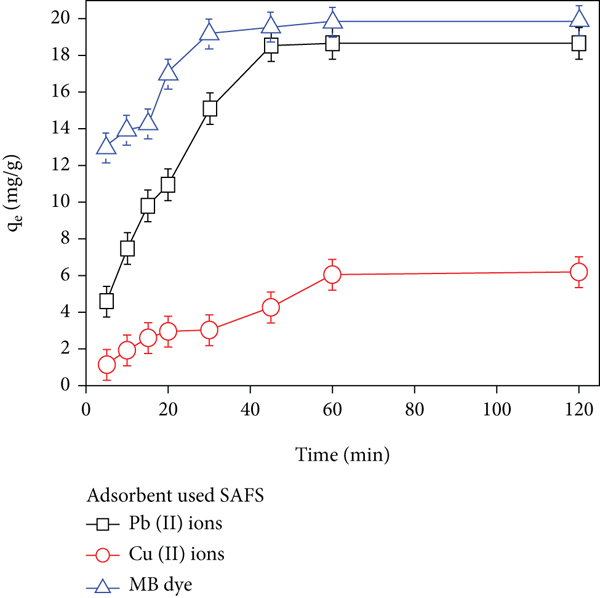
The efficiency of PFS, SAFS, and NAFS was estimated at different time intervals, to evaluate the uptake rate of each adsorbent towards Pb(II), Cu(II), and MB within 5-120 min (Figures 6(a)–6(c)). It was observed that processes in Figures 6(a)–6(c) followed a similar trend. Adsorption capacities of the adsorbents increased when contact time was increased [71]. Also, the removal rate of MB dye onto all adsorbents was rapid more than that of Pb(II) and Cu(II) cations. In Figure 6(a), it was observed that MB attained equilibrium faster and stabilized within 40 min, while the cations had a slow rate, both reaching equilibrium in 60 min. In Figure 6(b), the rate was higher and MB attained equilibrium in the initial 30 min while Pb(II) and Cu(II) ions reached equilibrium in 40 and 60 min, respectively. Thereafter, no significant increase was recorded. In Figure 6(c), it was observed that both MB and Pb(II) stabilized within the initial 40 min while Cu(II) in 30 min. It was observed that at the beginning of all the adsorption processes removal rate was rapid and this could be explained by the fact that abundant active sites, pores, and surface were available [72, 73]. However, as the time elapsed, the active sites were used and this resulted in little to no adsorption recorded [74].

Time effect studies on the adsorption of Pb(II), Cu(II), and MB onto pure (a) PFS and treated (b) SAFS and (c) NAFS fennel seed adsorbents (system parameters:

The data obtained from the effect of time was used to estimate the kinetic mechanisms involved in the adsorption of Pb(II), Cu(II), and MB on the biomaterials. In this work, three adsorption kinetics models were determined: PFO, PSO, and IPD in Table 4. To quantify the better fitted model either PFO or PSO the value of
Kinetic models for the adsorption of Pb(II), Cu(II), and MB onto pure (PFS) and treated (NAFS and SAFS) fennel seed adsorbents.
4.3.3. Diffusion Processes
The adsorption mechanism(s) of Pb(II), Cu(II), and MB onto PFS, NAFS, and SAFS was further investigated by different diffusion processes such as intraparticle, film, and pore in (Table 5). It was observed that the values for intraparticle particle diffusion rate (Ki) were higher for PFS than for the treated adsorbents (NAFS and SAFS), while the surface adsorption parameter (
Diffusion parameter for the removal of Pb(II), Cu(II), and MB onto PFS, NAFS and SAFS.
4.3.4. Temperature Effect and Thermodynamic Studies
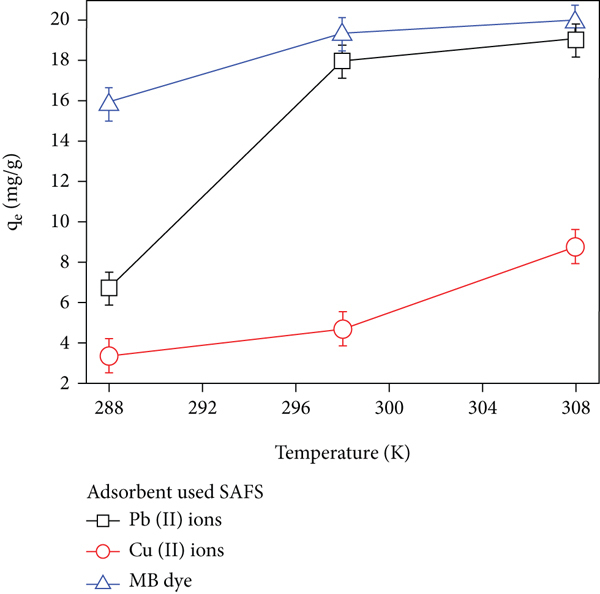
The effect of temperature on the sorption of Pb(II), Cu(II) ions, and MB dye was evaluated at 288, 298, and 308 K as shown in Figures 7(a)–7(c). It was observed that all processes (Figures 7(a)–7(c)) followed the same trends. The uptake of all pollutants increased when the temperature of the system was increased. The plots recorded a sharp increase in adsorption when the temperature of the system was increased from 288 to 308 K. This revealed that the uptake processes were endothermic in nature [20, 80]. The results indicated that temperature increase had a positive effect on the uptake reactions. Increasing the temperature of the system supplied the pollutants with enough kinetic energy to overcome the hindering forces such as mass transfer resistance [81]. Therefore, this enhanced the adsorption processes.

Temperature effect studies on the adsorption of Pb(II), Cu(II), and MB onto pure (a) PFS and treated (b) SAFS and (c) NAFS fennel seed adsorbents (system parameters:

Thermodynamic parameters Gibbs energy (
Thermodynamics for the adsorption of Pb(II), Cu(II), and MB onto pure (PFS) and treated (NAFS and SAFS) fennel seed adsorbents.
4.3.5. pH Effect
The pH of the solution is among the most essential parameters in adsorption studies. It influences the oxidation state of the pollutants in the solution and the surface properties of the biomaterials [84]. Depending on the solution pH, Cu(II) ions exist as different species such as Cu(II), Cu(OH)+, Cu(OH)2, Cu(OH)3 −, and Cu(OH)4 2− ([22]), while Pb(II) ions can exist as Pb(II), Pb(OH)+, Pb4(OH)2 4+, Pb3(OH)4 2+, and Pb(OH)2 [7]. Typically, MB solution is constituted of positively charged unprotonated cations [85]. Therefore, in this work, pH effect was evaluated at pH 1, 3, 5, 7, and 8 for the adsorption of Pb(II), Cu(II) cations, and MB dye on working standard 100 mg/L at 298 K as shown in Figures 8(a)–8(c). The adsorption trend of PFS is shown in Figure 8(a). It was observed from the plot that at strong acidic conditions around pH 1–3 the uptake of the pollutants was low. This was because at pH 1–3 effective competition was high for active sites between protons (H+) and pollutants [86]. The adsorption of (H+) protonated the surface of the biomaterial and resulted in enhancing the repulsion forces between pollutants and adsorbent surface resulting in low adsorption. However, when the pH of the solution was increased to pH 5, the uptake slightly increased. This could be explained by the fact that at pH 5 effective competition was less and as such improved the uptake [62]. Further increase in uptake was observed when the pH of the solution was increased to pH 7 and 8. This was because the surface of adsorbents was deprotonated, and this resulted in increased electrostatic interaction between the pollutants and functional groups such as −OH−, −CO−, and -COC groups [87]. The adsorption processes of SAFS and NAFS are shown in Figures 8(b) and 8(c), respectively. It was observed that the plots for SAFS and NAFS followed the same pattern. At acidic conditions pH 1, 3, and 5, the uptake of the pollutants was reduced. However, the uptake significantly improved when the pH of the solution was increased to 7 and 8. The adsorption of Pb(II), Cu(II) ions, and MB dye onto PFS, SAFS, and NAFS was pH dependent.
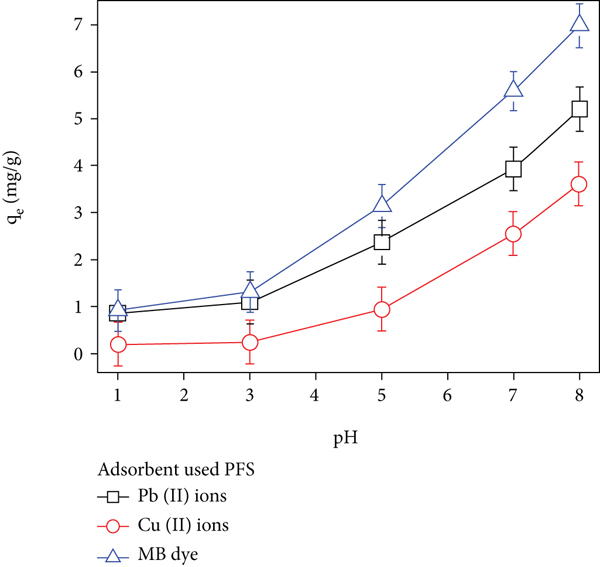
pH effect on the removal of Pb(II), Cu(II), and MB onto pure (a) PFS and treated (b) SAFS and (c) NAFS fennel seed adsorbents (system parameters:


4.3.6. Adsorption Mechanism
Establishing the adsorption mechanism(s) is of great importance. This is dependent on several factors such as the morphology and functional groups present on the surface of the adsorbent, as well as size and charge of the pollutant. The major structural constituents of fennel seeds are mostly lignocellulosic materials (hemicellulose, cellulose, and lignin). The lignocellulosic materials are natural polymers, containing repeating units of monomers. The structure of lignocellulosic materials consists abundantly of oxygen-rich functional groups such as (−OH), (−CO), and (−COOH) which could be a good candidate for adsorption processes [35, 43]. Therefore, it was anticipated that these functional groups were involved in the uptake processes. It was observed in Scheme 1 that the uptake of MB and the cations (Cu(II) and Pb(II)) was controlled by different adsorption mechanism(s). The removal of MB involved several processes such as (i) π-π interaction between the aromatic rings [39, 41, 88, 89], (ii) electrostatic attraction occurred positively charged (N+) from MB and (OH) from lignocellulosic materials [90], and (iii) hydrogen bonds formed by (N) molecules from MB and interacting with (O) molecules from lignocellulosic materials ([91]), while the uptake of both Cu(II) and Pb(II) was controlled mainly by electrostatic attraction.

Proposed adsorption mechanism of Pb(II), Cu(II), and MB onto fennel seeds.
4.3.7. Effect of Competing Ions/Molecules on the Adsorption of Pb(II), Cu(II), and MB
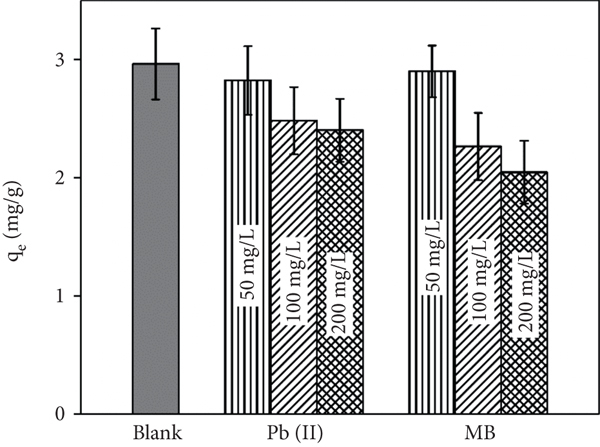
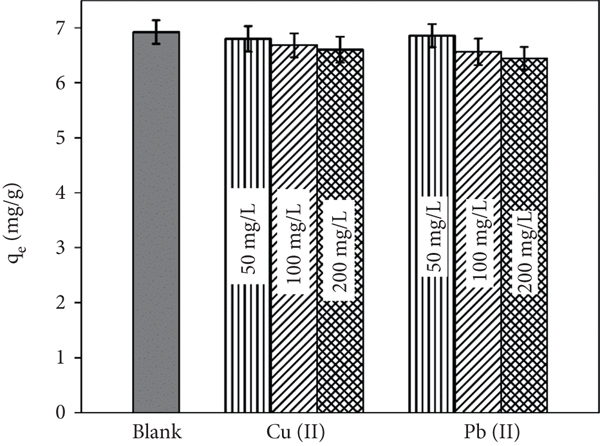
The effect of competing ions/molecules was studied in order to investigate the influence it had on the adsorption processes. Figure 9(a) shows the adsorption of Pb(II) in the presence of competing ions/molecules (Cu(II) and MB) at different concentrations. It was observed that the adsorption potential of the adsorbent decreased when the concertation of competing ions/molecules was increased from 50 to 200 mg/L in the solution. Moreover, considerably decline in
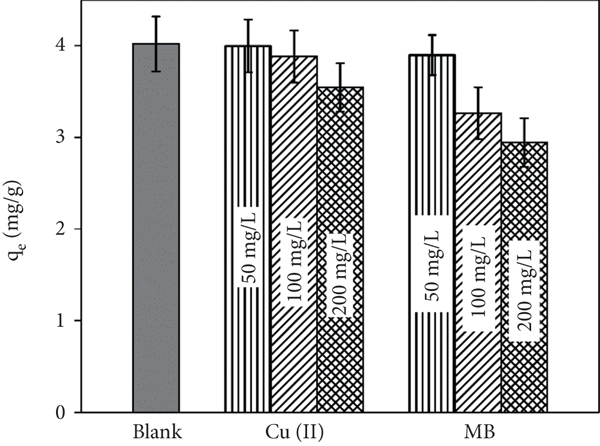
Effect of competing ions/molecules on the adsorption of (a) Pb(II), (b) Cu(II), and (c) MB onto pure fennel seeds (PFS) (system parameters:
4.4. Postadsorption Studies
4.4.1. FTIR Analysis
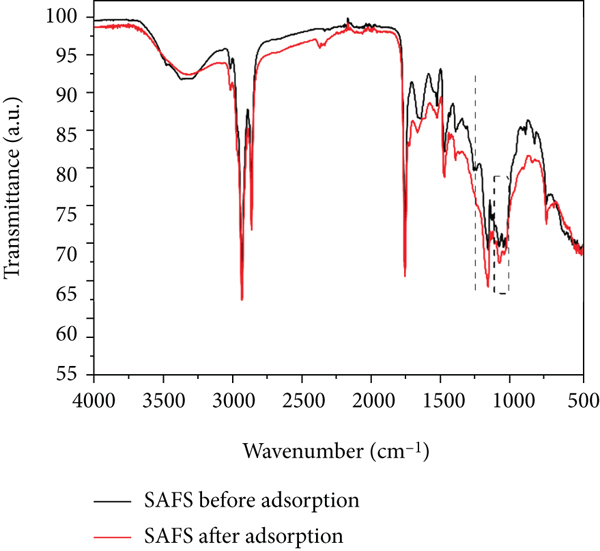
FTIR spectra of PFS, NAFS, and SAFS were compared before and after adsorption. This was performed in order to identify the functional groups accountable for adsorption of the pollutants [94]. It was observed in Figure 10(a) that PFS exhibited the peak for (–OH) at 3291 cm-1; however, after adsorption, the peak decreased in intensity. The peak assigned to (–COOH) at 1587 cm-1 slightly shifted after adsorption to 1609 cm-1. A new peak was developed after adsorption at 1455 cm-1. The peak for (–COC) at 1016 cm-1 considerably decreased in intensity after adsorption. The changes suggest that the functional groups were involved in uptake processes, while other groups such as (–CH=CH), (–CH), and (–C=O) remained unchanged before and after adsorption implying that the groups did not take part in the uptake. For NAFS in Figure 10(b), the peak at 1141 shifted after adsorption to 1150 cm-1. The peak for (–COC) at 1016 cm-1 also shifted to 1011 cm-1. Other functional groups remained unchanged. For SAFS (Figure 10(b)), the peak for (–OH) was at 3295 cm-1. However, after adsorption, this peak significantly decreased in intensity. The peaks for (–CO) and (–COC) respective at 1243 and 1016 cm-1 also decreased in intensity after adsorption. Other functional groups remained unchanged.
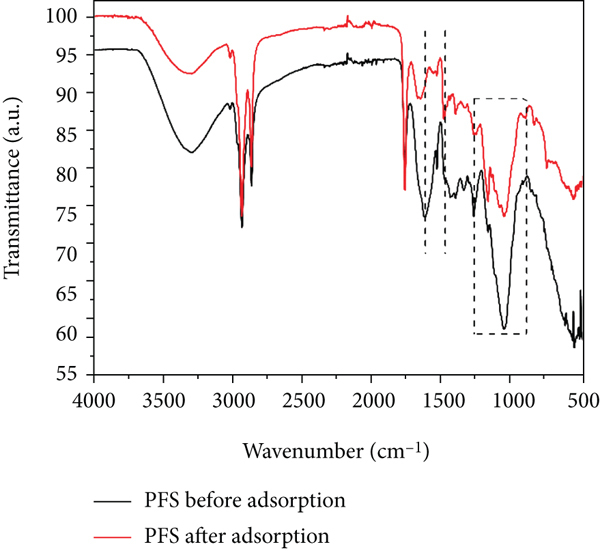
FTIR spectra (a) PFS, (b) NAFS, and (c) SAFS before and after adsorption.

4.4.2. SEM Analysis
The SEM images of the adsorbents after adsorption were used to evaluate the stability of the adsorbents as shown in Figures 11(a)–11(f). It was observed that the effect of pollutants binding to the surface somehow caused changes to the morphology of the adsorbents. Particularly for PFS (Figures 11(a) and 11(b)) and SAFS (Figures 11(e) and 11(f)), the pores on the surface were larger after adsorption compared to before (i.e., PFS (Figures 1(a) and 1(b)) and SAFS (Figures 1(e) and 1(f)). Similar observations were made in a number of studies prior [95–97].

SEM images of pure ((a, b) PFS) and treated ((c, d) NAFS and (e, f) SAFS) fennel seed adsorbents after adsorption.


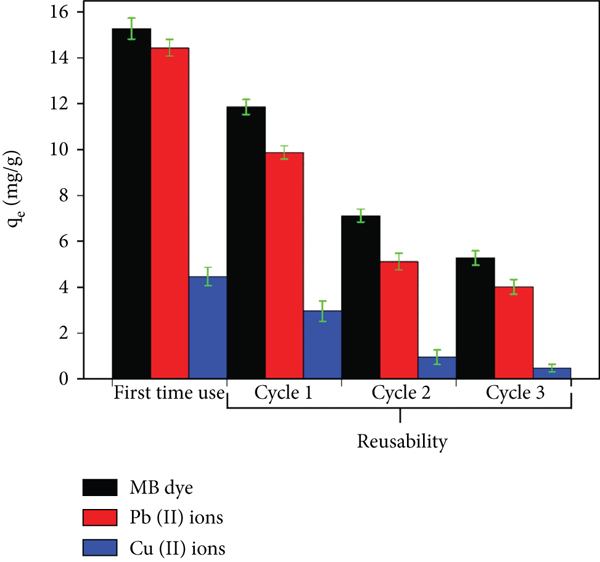
4.5. Reusability Test
The biosorbent reusability test was evaluated over three reuse cycles. The reusability results are shown in Figures 12(a)–12(c). After each cycle, the biosorbents were regenerated before reuse. It was observed in Figures 12(a)–12(c) that the biosorbents lost some of the adsorptive strength in consecutive cycles. This may be attributed to the inability of the biosorbents to desorb some of the pollutants from the pores and surface during the regeneration process; therefore, this resulted in low uptake in the following cycles.

Reusability test of pure (a) PFS and treated (b) NAFS and (c) SAFS fennel seed adsorbents towards the adsorption of Pb(II), Cu(II) ions, and MB dye.

4.6. Comparison Studies
The removal uptake of fennel seeds was compared with similar biosorbents listed in Table 7. The data shows that modified fennel seeds had good uptake than other biosorbents towards Pb(II), Cu(II) ions, and MB dye. The adsorbents used in this study are promising and have a good uptake.
Comparison studies of fennel seeds for the adsorption of MB, Cu(II), and Pb(II) with other agriculture biomaterials.
5. Conclusions
This work reports on biosorbent material of fennel seed treatment with HNO3 and H2SO4 solutions for the removal of MB dye, Pb(II), and Cu(II). SEM images established that the surface morphology of the adsorbents was porous. EDX analysis revealed that elements C and O were the dominant constituents while trace amounts of P and Cl were recorded. FTIR spectra confirmed the presence of (−OH), (−COC), (−C=O), and (−COOH) groups on the surface of the adsorbents. The results for the concentration effect revealed that the uptake of the pollutants increased when the initial concentration of the solution was increased. At the initial concentration of 20 mg/L, it was found that the mass transfer was low, due to high hindering forces. However, at an initial concentration of 100 mg/L, the chances of collision between Pb(II), Cu(II), and MB with the adsorbent surface were greater therefore; this resulted in higher mass transfer. The maximum adsorption capacities on 100 mg/L solutions onto PFS were 6.834, 4.179, and 2.902 mg/g for MB, Pb(II), and Cu(II), respectively. However, onto NAFS, the maximum adsorption capacities for MB, Pb(II), and Cu(II) were enhanced to 15.28, 14.44, and 4.475 mg/g, while for SAFS the maximum adsorption capacities further improved for all pollutants to 19.81, 18.79, and 6.707 mg/g, respectively. Thus, the uptake of pollutants onto PFS, SAFS, and NAFS was concentration dependent. Isotherm data established that the uptake processes of MB dye onto all adsorbents fitted Freundlich while both cations were described by the Langmuir model. It was found that adsorption increased when the temperature of the system was increased. The thermodynamic parameter
Footnotes
Data Availability
The data supporting the findings of this study may be made available from the corresponding author on request.
Conflicts of Interest
The authors declare no conflicts of interest.
Acknowledgments
The authors also acknowledge support of the Department of Chemistry, Vaal University of Technology, Vanderbijlpark, South Africa, for granting facilities. Support for this research was provided by the National Research Fund (NRF) of South Africa (Grant: TTK190403426819) and the Vaal University of Technology, Vanderbijlpark, South Africa.