
Abstract
Solution combustion was employed to create a series of ZrO2:Dy3+ (1-11 mol percent) nanoparticles (NPs) using oxalyl dihydrazide (ODH) as the fuel. ZrO2:Dy3+ NPs were subjected to calcination at about 700°C. ZrO2:Dy3+ NPs comprised of 1 to 11 mol% of Dy3+ were characterized by employing the X-ray diffraction (XRD), transmission electron microscopic (TEM), UV-visible, and X-ray photoelectron spectroscopic (XPS) techniques. The crystallite diameters of 1 to 11 mol% ZrO2:Dy3+ NPs were observed to range from 8.1 nm to 16.3 nm, exhibiting spherical shape. According to BET tests, the pore volume of ZrO2:Dy3+ NPs was determined to be 100.129 cm3/g. The mean pore diameter of ZrO2:Dy3+ NPs was determined to be 4.803 nm from the Barrett-Joyner-Halenda (BJH) plot. The photoluminescence and photocatalytic dye degradation properties of ZrO2:Dy3+ NPs were investigated. The acid red 88 (AR88) dye was applied to appraise the photocatalytic activities of the NPs under UV irradiation. ZrO2:Dy3+ NPs with 3 mol% Dy3+ exhibited improvised photocatalytic activity due to the operative departure of charge carriers. The electrochemical examination of ZrO2:Dy3+ NP modified carbon paste electrode in 0.1 N HCl demonstrated considerable redox potential output, as evidenced by cyclic voltammetric and amperometric measurements. The electrochemical sensor studies on ZrO2:Dy3+ NPs exhibited potentiality towards sensing of highly toxic metals like mercury and lead.
1. Introduction
Because of its outstanding optical and electrical properties, such as strong thermal stability, huge dielectric constant, broad band gap (5–7 eV), and high melting point, zirconium oxide (ZrO2) was subjected to investigation extensively over the last two decades [1, 2]. Due to its outstanding optical properties, including a high band gap value, a large refractive index, a low optical cost, and improved transparency in the near-infrared and visible ranges, it is a common material in many optical applications [3, 4]. It exhibits a broad band gap and emits photoluminescent (PL) light at short wavelengths [5]. Materials made of rare-earth-doped oxides have unique optical properties like luminescence efficiency and photochemical stability [6, 7].
Tetragonal, monoclinic, and cubic crystal forms are all found in zirconia. The temperature at which each structure is formed is determined by the synthesis method used and the presence of a dopant of any kind; zirconia produced using the sol–gel process, for example, has an amorphous structure, but it can be transformed into tetragonal zirconia after heat treatment at 500°C. The monoclinic structure begins to appear at 800°C, and at 1300°C, the cubic structure emerges. Zirconia can be utilized in biocomposites, combustible cells, catalytic supports, oxygen detectors, and oxygen sensors [8]. Many researchers have looked into the optical characteristics of Dy-doped ZrO2. For low concentrations of Dy dopant, zirconia has been reported to have improved photoluminescence (3 mol percent). Gu et al. [9] investigated the consequence of calcinations and doping of Dy3+ on ZrO2 nanoparticle luminescence. They discovered that a concentration of 2% Dy in ZrO2 produces the extreme comparative luminescence intensity having wavelength of 480 nm. The effective photoluminescence in nanocrystalline zirconia was reported at low Dy concentrations [10].
For the production of ZrO2:Dy3+ in this study, the combustion solution method was used (1-11 mol). The crystalline nature and morphological characteristics of the material were studied using a variety of characterization techniques.
The significant and amazing method of removing contaminants from water and wastewater has been photocatalysis. Under UV light illumination, the produced nanomaterial’s catalytic activity for the destruction of acid red 88 (AR88) was evaluated. The photocatalytic activities were explained in relation to the photoluminescence studies and crystallite size, and their applicability in display applications was examined in depth. In 0.1 N HCl solution, cyclic voltammetric and amperometric investigations were also carried out employing electrodes modified with ZrO2 and ZrO2:Dy3+ (3 mol). Under the detection limit of
2. Experimental
Zr and Dy were obtained from the basic precursors, zirconium (IV) oxynitrate hydrate (ZrO(NO3)2·H2O: 99.9 percent, S D Fine) and dysprosium (III) oxide (Dy2O3: 99.9 percent, Merck). The fuel was made in our lab and is called oxalyl dihydrazide (ODH: C2H6N4O2). For synthesis, oxalic acid, glycine, urea, citric acid, and other fuels were used. ODH with a low ignition temperature produces low molecular weight, innocuous gases as compared to other fuels. Oxide materials produced using ODH as a fuel can be used for a variety of purposes [11, 12]. Initially, Dy2O3 is converted to dysprosium nitrate by the dissolution of required quantity of Dy2O3 in HNO3 (1 : 1) for the synthesis of ZrO2:Dy3+ (1–11 mol percent). After the reaction on a sand bath at 80°C was finished, the excess nitric acid was evaporated to produce a transparent terbium nitrate solution. The required amounts of ODH and zirconium (IV) oxynitrate hydrate solution were added to the dysprosium nitrate solution while being continuously stirred to achieve smooth mixing. This heterogeneous mixture (redox) was placed on a Petri plate and introduced into a muffle furnace set to 400°C. The decomposition of the mixture eventually unfolds, culminating in the release of large volumes of gases such as CO2, H2O, and N2. The entire procedure consumes about 5 minutes and leads to the production of ZrO2:Dy3+ nanophosphor.
3. Results and Discussion
3.1. Powder X-Ray Diffraction Analysis
XRD experiments were conducted in order to understand the crystalline nature and true crystallite size of Dy-doped ZrO2 NPs. PXRD patterns of as-synthesised ZrO2:Dy3+ NPs have been found to be very similar to the pattern as per standard JCPDS card no. 81-1551. The cubic phase of ZrO2 was used to index all of the diffraction patterns (Figure 1). Cubic, monoclinic, and tetragonal polymorphs of ZrO2 exist in three different crystalline forms. The cubic/tetragonal phase [13] is the most suitable for technological uses among these. Only the peak associated to ZrO2 was found after doping ZrO2 with Dy3+. There were no other peaks corresponding to Dy (NO3)3 or other contaminants, showing that Zr4+ ions in the ZrO2 matrix were replaced by Dy3+ ions. A slight peak shift has been observed for ZrO2 upon Dy doping, which is possibly due to lattice modification and corresponding strain.

X-ray diffraction pattern of Dy3+-doped (1-11 mol%) ZrO2 NPs.
Using full width at half maximum (FWHM) data,
Crystallite sizes of ZrO2:Dy3+ (1-11mol%) NPs.
Additionally, Dy doping induces a gradual loss of crystallinity of ZrO2, due to lattice instability and induced strain on the lattice. Previously, the FWHM was assumed to represent a linear combination of crystallite size and lattice strain components [14]. Equation (1) can be used to express the influence of crystallite size and strain on the FWHM.
where
A straight line between 4 sin (

W–H plots of as-formed ZrO2:Dy3+ (1–11 mol%) NPs.
The line’s intercept (
where
The presence of the estimated microstrain in the majority of the planes in the current study suggested the presence of tensile stress on the particle’s surface. The residual stress was tensile, with a positive microstrain, causing the PXRD patterns to move to the lower angle side.
3.2. Morphological Studies
Figure 3 depicts the SEM images of ZrO2:Dy3+ (1-11 mol percent) NPs. Because of the large number of gasses generated during combustion, the surface morphology of ZrO2:Dy3+ NPs reveals the presence particle agglomeration which rises with increasing Dy concentration.

SEM images of ZrO2:Dy3+ (1–11 mol%) NPs.
Figure 4(a) depicts the TEM micrograph of ZrO2:Dy3+ (3 mol percent) NM with considerable aggregation of nearly spherical nanocrystals. The recorded crystallite size matched the PXRD data perfectly. A HRTEM image captured from a specific location in Figure 4(b) showed the (111) plane crystal facet of cubic zirconia. The interplanar spacing values of 0.294 nm displayed the (111) plane of cubic zirconia. SAED pattern of ZrO2:Dy3+ (Figure 4(c)) (3 mol%) NM represents cubic ZrO2 diffraction rings generated from planes (111), (200), (220), and (311) due to cubic zirconia polycrystalline diffraction (Figure 4(b)). The single and pure crystalline cubic ZrO2 serves as evidence of the value of the current synthesis procedure in producing cubic ZrO2 NM with good compact size, high purity, and high crystallinity.

(a) TEM image, (b) HRTEM image, and (c) SAED pattern of ZrO2:Dy3+ (3 mol%) NPs.


Figure 5 shows the nitrogen adsorption-desorption isotherms of BET and BJH plots (inset), respectively. The IUPAC classifications’ type IV adsorption isotherms are conformed to by the BET plot for the substance [14]. Type IV adsorption isotherms are frequently produced by mesoporous materials, showing the presence of layer-by-layer adsorption on smooth surfaces [15, 16]. The materials’ specific surface area, commonly performed within the linear plots, approximately ranging from

Adsorption-desorption measurements showing BJH plot (inset: pore size distribution).
The XPS technique was used to evaluate the elemental composition, chemical states, and elemental bonding for the produced ZrO2:Dy3+ (3 mol percent), as shown in Figure 6. The recorded wide spectrum of the NM displayed the existence of binding energies ~1072, ~537.6, ~292.2, and~186.3 eV which corroborates to Dy 3d, O 1s, C 1s, and Zr 3d peaks, respectively.

XPS spectra of Dy-doped (3 mol%) ZrO+ NPs.
3.3. Photoluminescence (PL) Studies
Exploration of the energy levels inside the band gap positions yielded crucial knowledge from PL research. PL emission can be used to analyse the effectiveness of migration, charge carrier entrapment, and the destiny of photogenerated electron-hole pairs in semiconductors [18–20]. Because PL emission caused excited electron-hole pairs to recombine, effective separation of charge carrier resulted in a decrease in PL intensity [21, 22].
A PL excitation (PLE) spectrum of 3 mol% Dy3+-doped ZrO2 nanophosphor measured at a fixed emission wavelength of 580 nm corresponds to the electronic transition (

PL emission spectrum of ZrO2:Dy3+ (1–11 mol%) NMs excited at 353 nm.
When activated with 352 nm, all of the peaks were observed to be Dy3+’s emission peaks, exhibiting energy efficient transfers from the host to Dy3+. The luminescence centers stimulated by Dy3+ ions were thought to be responsible for the PL spectrum [23]. With the exception of the PL emission intensity, there were essentially insignificant changes in the emission spectra as the Dy3+ doping concentration was raised. The peaks observed at 483 nm (blue), 580 nm (yellow), and 672 nm (red) consist of Dy3+ transitions corresponding to
3.4. Photocatalytic Activity of Acid Red 88 (AR88) Dye under UVA/Sunlight
To investigate the photodegradation activity of Dy3+-doped ZrO2 (1-11 mol percent) NPs, the decolorization of hazardous azo acid red 88 dye was conducted under UV light irradiation for 90 minutes. Acid red 88 degradation was found to be minimal in the absence of ZrO2:Dy3+ and under dark condition. As a consequence, the photocatalytic activity of the excited semiconductors is primarily responsible for the decolorization of the dye. Under UV light, the percentage of acid red 88 decolorization catalyzed by ZrO2:Dy3+ photocatalysts is shown in Table 2. Acid red 88 decolorization rises with increasing dopant concentration up to 11 mol% under UV light, implying that 11 mol% Dy-doped NPs were efficient in separating photo-emitted electron-hole pairs to enhance the photocatalytic degradation efficiency. Acid red 88 was decolorized under solar light with ZrO2:Dy3+ catalysts in the following order:
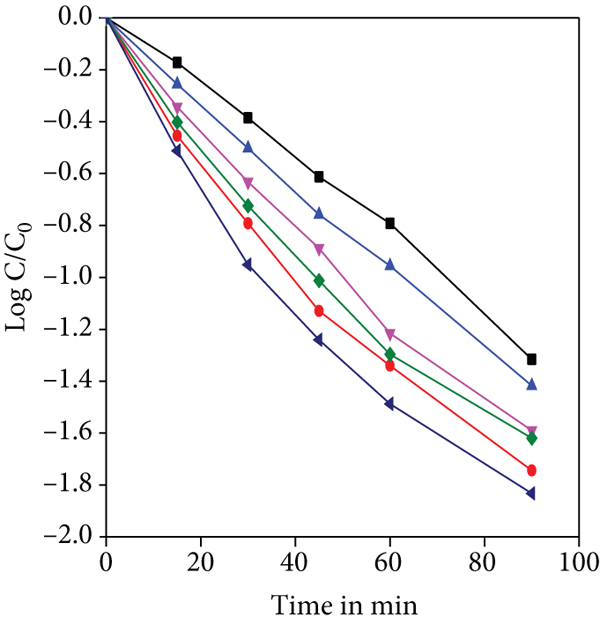
Kinetic studies under UV light for ZrO2:Dy3+ (1–11mol%) photocatalysts.

(a) Percentage degradation and (b) C/CO for the decolorization of acid red 88 dye under UV light illumination. (c) Effect of pH on photocatalytic degradation of ZrO2:Dy (11 mol%) catalyst.
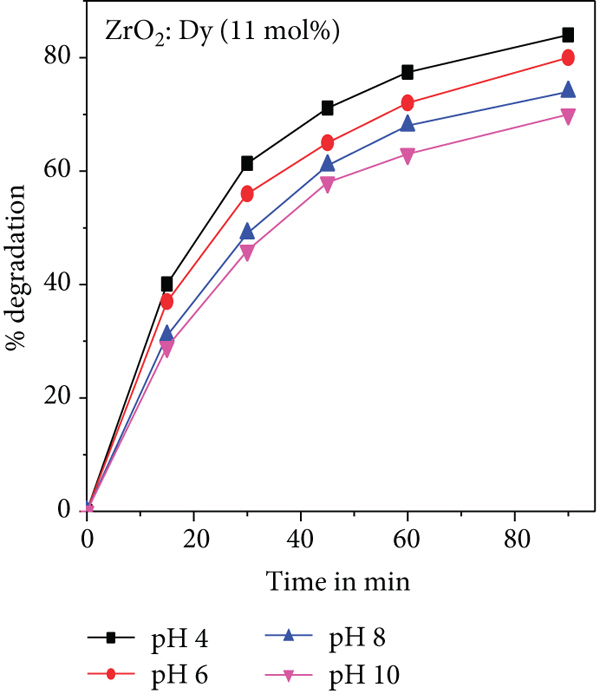
These findings imply that in the ZrO2 lattice, an optimal dopant concentration of Dy3+ exists, resulting in effective charge carrier separation. To check the performance of photocatalyst under the effect of pH, 11 mol% ZrO2:Dy3+ NPs were assessed on the removal of acid red 88 at different values of pH. As the pH decreases, degradation of AR88 increases as shown in Figure 8(c). In acidic medium, photocatalytic activity increases due to the anionic nature of AR88 dye. An electrostatic force is generated between protonated surface of the catalyst ZrO2:Dy in acidic medium and anionic dye AR88. Hence, dye adsorption on the catalyst surface is enhanced and photodegradation increases. In alkaline medium, there is repulsion between the negatively charged ZrO2:Dy and anionic dye AR88 molecule; hence, percentage of degradation is less in alkaline medium compared to acidic medium.
Increasing the amount of Dy3+ in the catalyst structure resulted in a greater surface barrier and a narrower space charge area, allowing the generated electron-hole pairs to be separated efficiently. Increases in Dy3+ concentration up to a certain point cause the space charge layer to be breached, allowing light to penetrate deeper into ZrO2:Dy3+ nanoparticles are a type of Dy3+ nanoparticle [25]. The half-life of the degradation was calculated for each dopant, and it was found to be 25 min, 11.7 min, 18.3 min, 13.5 min, 12.43 min, and 10.55 min for 1, 3, 5, 7, 9, and 11 mol%, respectively. The respective results are shown in Figure 9. In comparison to the other dopants as mentioned in Table 3, the half-life required for degradation by 3 mol% and 11 mol% was substantially shorter. Hence, it can be concluded that the best suitable dopant for the degradation was 11 mol%.
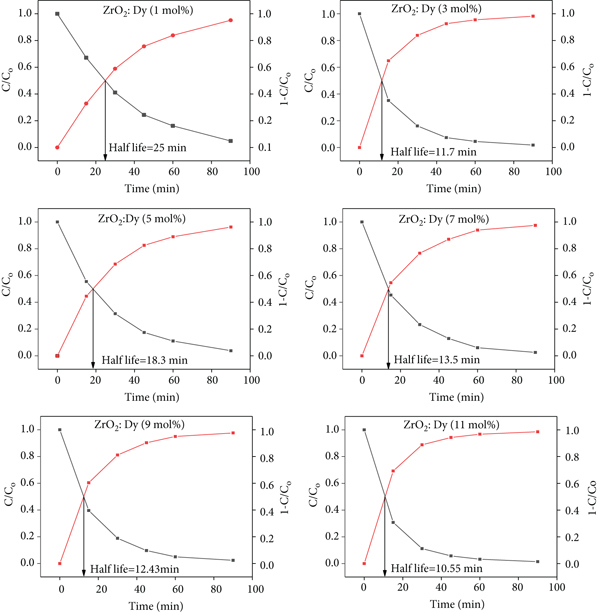
Half-life plot for the AR88 dye under UV irradiation in the presence of ZrO2:Dy3+ (1-11 mol%) photocatalyst.
Summary of the photocatalytic degradation of various photocatalysts and dyes.
According to the proposed mechanism, when light energy strikes the catalyst’s surface, the electron in the valence band (VB) is stimulated to the empty conduction band (CB) (Figure 10), resulting in the production of electron-hole, which further react with the pollutant causing the formation of hydroxyl radicals or singlet oxygen radicals or holes which are responsible for the pollutant degradation [26–28].
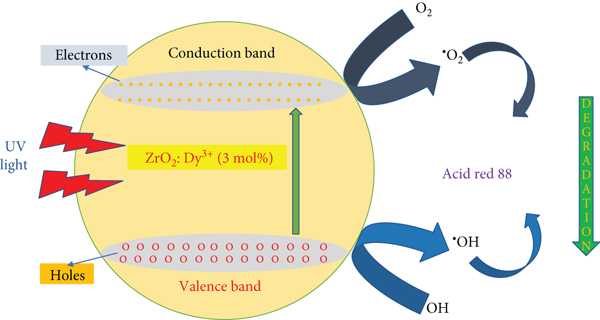
Proposed mechanism for the photocatalytic decolorization of AR88 dye over the ZrO2:Dy3+ photocatalyst.
When the migration occurs, these electron-hole pairs will be involved in the redox reaction. When holes combine with the hydroxide ion, it results in the formation of hydroxyl radicals, whereas the superoxide and hydrogen peroxide were produced due to the interaction of electrons with oxygen in the system. The produced superoxide and hydrogen peroxide react together by producing the hydroxyl radicals. In the final step, the produced radicals will react with the pollutant on the metal surface by forming the intermediate compounds in a short time. Finally, these radicals will help in the breakdown of the pollutant to form CO2 and H2O.
The 11mol% ZrO2:Dy3+ NP reusability test was carried out with an AR88 concentration of 10 ppm, a photocatalyst dosage of 60 mg, and a reaction period of 90 min. To calculate the degrading efficiency loss after each run, six consecutive runs were made. The percentage of degradation for six cycles is 84%, 84%, 83.1%, 82.9%, 82.8%, and 82%, respectively. Even after the sixth run, the degrading efficiency barely decreased may be due to the loss of catalyst during filtration of the catalyst for the next cycle. It was shown that 11 mol% ZrO2:Dy3+ NPs can be an effective photocatalyst with high reusability potential for the degradation of AR88 [37–44].
3.5. Electrochemical Sensor Study
3.5.1. Carbon Paste Electrode
To make a carbon paste electrode, a mixture of the prepared sample Dy3+-doped ZrO2, graphite powder, and silicon oil (mass ratio of 15 : 70 : 15) was crushed in a mortar for 20 minutes. This powder was then gently pressed into a Teflon hollow tube (0.3 mm surface area) for further research [45].
3.5.2. Electrochemical Studies
Cyclic voltammetric measurements were performed using the three-electrode assembly in a 50 mL beaker chamber at room temperature. The energetic electrode material ZrO2 undergoes a few strong Faradaic reactions that lead to a few strong redox peaks [46]. The CV activity of a (3 mol percent) sample in 1 N HCl at different moles using -0.4 to 0.6 V potentials and scan rates of 10 to 50 mV (Figure 11(a)) has been investigated. The observed capacitance was far from that of a typical double-layer electrical conductor, which typically displays a rectangular CV curve.

Cyclic voltammogram of Dy-doped (3 mol%) ZrO2 sample at different scan rates v/s silver-silver chloride electrode. (b) A plot of cathodic peak current (ip) and the square root of scan rate (

The linear connection between cathodic peak current (ip) and scan rate (
The greatest potential difference between the anodic (
Oxidation potential (
Figure 12 shows the electrochemical impedance spectra of Dy3+-doped ZrO2 (1–11 mol percent) electrodes with a frequency range varying from 1 Hz to 1 MHz and a 5 mV amplitude. The spectra show a high-frequency load transfer resistance and a low-frequency slope associated with the Warburg resistance. The resistance of the ZrO2 electrode with Dy3+-doped (3 mol%) additive is substantially lower than that of other Dy3+-doped ZrO2 electrodes, suggesting that the 3 mol% additional electrode’s electrochemical reaction is stronger than that of other electrodes [48]. A high-frequency zone marked by a semicircle depicts charge transport at the electrode/electrolyte interface, as well as a low-frequency zone denoted by a straight line that represents electrode capacitance. The diameter of the semicircle arc on the real axis can be used to calculate the charge transfer resistance

Nyquist plots of Dy3+-doped ZrO2 (1–11 mol%) electrodes.
Additionally, this circumstance is associated to the ideals of
Table 5 includes values that were obtained by fitting simulation data with an equivalency circuit and relate to the catalytic properties of active materials, such as solution resistance (
EIS data of Dy3+-doped ZrO2 (1–11 mol%) electrodes.
The cyclic voltammograms of Dy3+-doped ZrO2 (3 mol%) utilized for mercury and lead sensing are shown in Figure 13. As a consequence, peak position variation due to oxidation and reduction was justified. The development of an anodic oxidation peak at 0.1 V and a cathodic reduction peak at -0.05 V during sensing, as well as the disappearance of the oxidation peak at 0.2 V, shows that the manufactured carbon paste electrode is successful in sensing approach for amounts 1-5 mM.
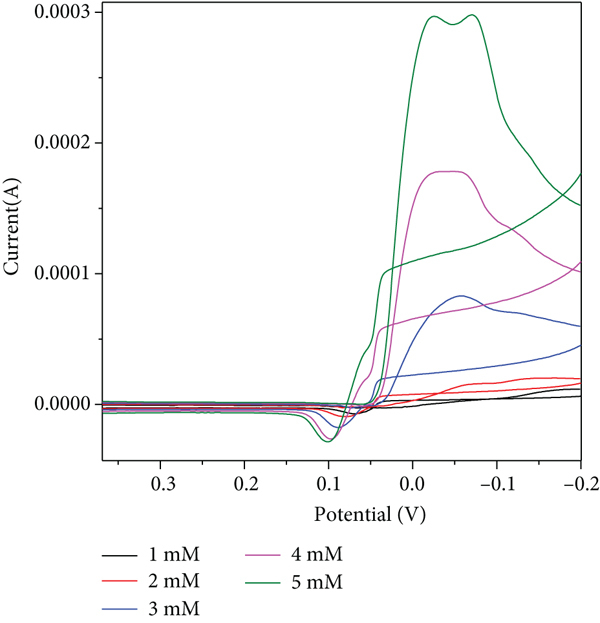
Cyclic voltammogram of ZrO2:Dy3+ (3 mol%) NP detection of (a) mercury and (b) lead of concentration range 1-5 mM.
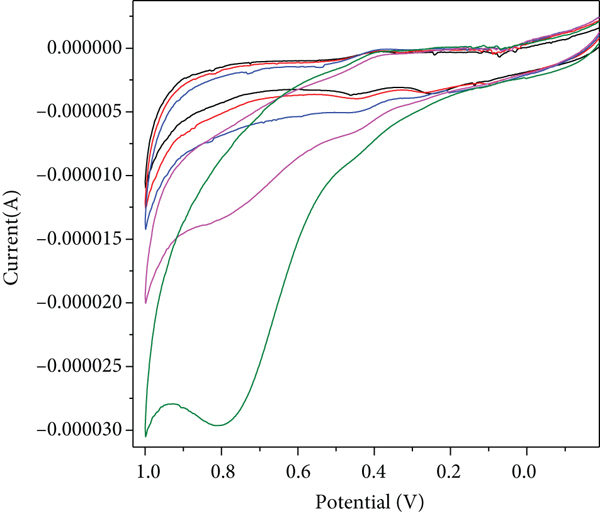
Nevertheless, the cyclic voltammogram of a lead sensor reveals that the entire voltammogram form changes, including the elimination of the oxidation and reduction peaks, but the introduction of an oxidation peak at 0.8 V. For 0 mM mercury and lead, the constructed electrode showed an initial current response of 60 s. Furthermore, the current response increases with continuous introduction of 1 mM mercury and lead (Figure 14), and within the brief time frame of 4 seconds, it approaches a steady current.
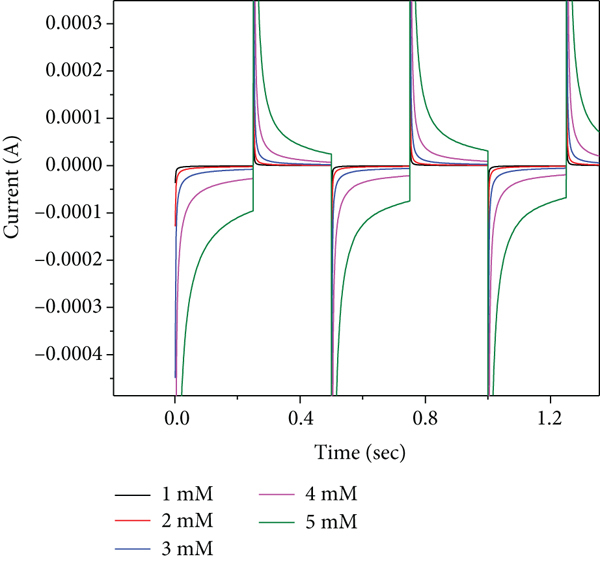
Amperometric
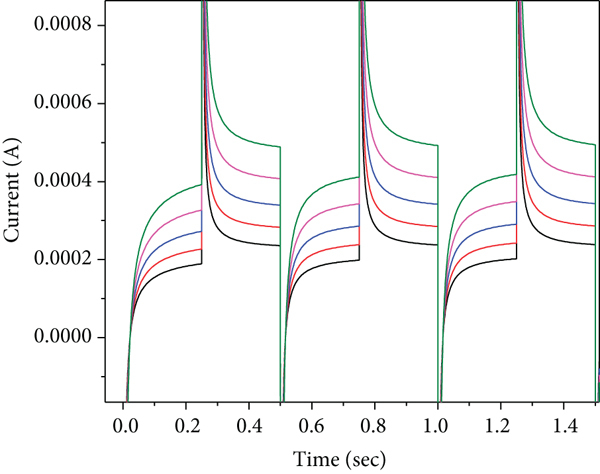
This result indicates that the sensor reacts quickly to mercury (0.0003 A) and lead (0.0008 A) oxidation. Finally, the positions of the reduction and oxidation peaks were determined to be considerably different, indicating that the electrodes produced are suitable for sensor applications without impacting other compounds in the sample.
4. Conclusion
A variety of nanoparticles ZrO2:Dy3+ (1-11 mol percent) were prepared in this study using a simple and cheap propellant combustion process. The cubic phase of Dy3+-doped ZrO2 NPs was confirmed by PXRD and HRTEM. The average crystallite size, as determined by Debye Scherrer’s and W–H techniques, was found to be between 8.1 and 16.3 nm. The results were very similar to those of the TEM. Under UV light, the photocatalytic activity of ZrO2:Dy3+ increased as the concentration of Dy3+ rose. All of the photocatalysts displayed increased activity for the breakdown of acid red 88 dye when exposed to UV light. The successful separation of charge carriers was related to the increased activity for the decolorization of acid red 88 under UV radiation. The reversibility of the carbon paste electrode made with Dy3+-doped ZrO2 NPs was excellent (lower value of
Footnotes
Data Availability
The data used to support the findings of this study are included within the article.
Conflicts of Interest
The authors declare no conflict of interest.
Acknowledgments
We would like to express our deepest regards for the Centre for Advanced Materials & Technology, M.S. Ramaiah Institute of Technology, Bangalore, India, for their support and help toward characterization analysis.