
Abstract
Polyaniline-assisted deposition of PbS is carried out on antimony tin oxide (ATO) glass for ATO/PANI/PbS composite formation. The deposition of PbS was carried out inside and outside the polymer chains using the ionic adsorption deposition process. Various analyses were conducted to confirm the chemical structure and morphological, optical, and electrical properties of the resulting composite. TEM and SEM analyses demonstrated the spherical shape of PbS particles inside and outside the PANI network with more dark or white color, respectively. Moreover, the ImageJ program confirmed the composite formation. The XRD characterization showed the shifts in the PANI peaks after the composite formation with the appearance of a new additional peak related to PbS nanoparticles. The optical analyses were massively enhanced after the composite formation with more broadening in the Vis region at 630 nm, in which there was more enhancement in the bandgap that reached 1.5 eV. The electrode application in the H2 generation process was carried out from wastewater (sewage water, third treatment) without any additional sacrificing agent. The electrode responded well to light, where the current density (
1. Introduction
The increasing energy demand prompted research in different laboratories to work on renewable energy sources such as windmills and solar energy [1–4]. These sources can prevent the problem of nonrenewable energy sources in which the combustion of fossil fuels has a fetal effect on plants, animals, humans, and the environment. The combustion of fossil fuels produces harmful gases, such as COX, NOX, and SOX [5–7].
The water-splitting reaction producing hydrogen is a type of solar energy source that depends directly on sunlight. This reaction can be carried out as photochemical or photoelectrochemical. The water-splitting reaction generates hydrogen and oxygen gases at the working and counter electrodes, respectively. This reaction can also help valorize the wastewater streams produced by the industrial, domestic, and agricultural activities worldwide, noting that enhancing the water quality belongs to one of the UN sustainable development goals (SDG #6) to be achieved by 2030. The splitting reaction requires semiconductor materials such as oxides, nitrides, and sulfides [8, 9]. Nevertheless, semiconductor polymers are the new category of photocatalytic materials used for this purpose having many advantages such as low cost, high quantum yield, large surface area, and easy preparation [10–16]. Polymer production is the replaceable category for all metal sources, especially in electronic devices. The researchers’ primary aim in optimizing polymer preparation is to enhance the optical properties and reach the general optimum bandgap of 1.2 to 1.5 eV. This optimization is generally carried out by controlling the nanoscale and composite formation with additive materials possessing high optical efficiency [17].
Polyaniline and its derivatives represent one of the main polymers described. This category of polymers has additional benefits such as high compatibility, stability, porosity, safety, low cost, redox state, and low bandgap [18, 19].
Furthermore, PbS has a unique property in which the bandgap is in the range of 0.92 to 1.6 eV, depending on the size, with its black color that can trap the photons. PbS has additional electrical properties that qualify it for various applications in the renewable energy field, such as solar cells, optoelectronics, and water splitting [20, 21].
Recently, few studies included the application of polyaniline (PANI) and its derivatives in water-splitting reactions. Corte et al. [22] fabricated Ni/PANI composite and used it for water splitting from 0.5 M H2SO4 under artificial light. Belabed et al. [23] prepared PANI/TiO2 for water splitting using artificial light (200 W tungsten lamp). In addition, Zhang et al. [24] synthesized PANI/MoS2 for H2 generation from an H2SO4 solution. All of the mentioned studies still suffer from the low H2 quantity produced and low cell efficiency; sometimes, the efficiency is not even reaching 2%. Moreover, the previous studies usually use sacrificing agents to get the hydrogen gases, which cause electrode corrosion. Also, the previous studies used freshwater as a source of H2 gas, with the stinginess of this freshwater for drinking, especially in water-poor countries [25–27]. In addition, most of the previous studies used high complexed devices for the deposition of metal oxides or sulfides. These devices require more time for deposition using chemical or physical vapor deposition, laser, wet spinning, and RF sputtering techniques [28, 29].
This study provides a renewable energy source (hydrogen gas fuel) by solving many previously described drawbacks and represents an opportunity to valorize wastewater. We used the PANI-assisted deposition for PbS nanocomposite through the polymer-assisted ionic adsorption method. The large surface area and porosity of PANI helped in the PbS deposition. The deposition process of polymer composite was carried out on ATO glass, in which the ATO/PANI/PbS composite was formed. The low-cost ATO/PANI/PbS nanocomposite was implemented as a working photocathode in a three-electrode cell for H2 generation from wastewater (three-stage treatment sewage water) without any sacrificing agent under a solar simulator device (xenon lamp). The effect of light wavelength, light intensity, on/off chopped light, and the temperature was examined. The stability and mechanism of the electrode were mentioned and discussed.
2. Materials and Methods
2.1. Materials
Aniline and (NH4)2S2O8 were purchased from Rankem (India) and Winlab, respectively. Dimethyl sulfoxide (DMSO) was purchased from Sigma-Aldrich, USA. Acetic acid (CH3COOH), Pb(NO3)2, iodine (I2), and KI were purchased from El-Naser company, Egypt. Sewage water with the third treatment stage was obtained from the drinking water and sanitation company, Beni Suef City, Egypt.
2.2. Preparation of PANI/PbS Nanocomposites
PANI was prepared through the in situ oxidation polymerization method on antimony tin oxide (ATO) glass. Aniline (0.1 M) was dissolved in 0.5 M CH3COOH under ultrasonic effect; in the same manner, 0.15 M (NH4)2S2O8 (oxidant) was dissolved. Then, the oxidant was added suddenly over the aniline solution in the presence of ATO glass. After 1 h, a complete precipitate was formed from PANI over ATO glass. The resulting ATO/PANI was dried at 60°C for 6 h.
The preparation of PbS was carried out by the chemical bath deposition process. 0.05 M Pb(NO3)2 was dissolved well at 60°C. Also, 0.01 M thiourea was dissolved well at the same temperature. Then, the latter solution was added suddenly over the Pb(NO3)2 under a slow stirring process leading to the deposition of PbS as a black precipitate. The latter was collected, washed, and dried at 60°C for 6 h. The schematic process of deposition of PbS on PANI is shown in Figure 1(a).

(a) The schematic deposition of PbS on ATO/PANI and (b) the three-electrode cell for electrochemical H2 generation from wastewater.

PANI/PbS nanocomposite was synthesized through the ionic surface adsorption process. The ATO/PANI was immersed in 0.05 M Pb(NO3)2 for 2 h at 298 K leading to the adsorption of Pb2+ over the PANI surface. The resulting ATO/PANI/Pb2+ composite film was dried and then immersed in (0.01 M) thiourea solution at 60°C for 15 min. The S2- and Pb2+ ions reaction occurred, leading to ATO/PANI/PbS nanocomposite formation.
2.3. Characterization of the Prepared Nanomaterials
The crystal structure of PANI, PbS, and PANI/PbS was confirmed using X-ray diffraction (XRD), PANalytical Pro, Almelo, Netherlands, and Fourier transform infrared (FTIR)-Shimadzu 340 Jasco spectrophotometer, Easton, USA. The morphology of the samples was determined using scanning electron microscopy (SEM) ZEISS, Gemini, Oberkochen, Germany. The inside scanning was carried out using a transmission electron microscope (TEM) (JEOL JEM-2100, Waltham, USA). A simulation study for the SEM was carried out using the ImageJ program. The optical analyses were conducted using Shimadzu UV/Vis spectrophotometer (Perkin Elmer, Waltham, MA, USA).
2.4. The Electrochemical Test
The electrochemical study was carried out through a three-electrode cell using a power station (CHI660E), as shown in Figure 1(b). The prepared ATO/PANI/PbS nanocomposite represented the working electrode, while the graphite and calomel were used as counter and reference electrodes, respectively. The measurements were carried out under a solar simulator device (xenon lamp), using sewage water as an electrolyte without any additional sacrificing agent.
3. Results and Discussion
3.1. Characterization of the Prepared Nanomaterials
The surface morphologies of PbS, PANI, and PANI/PbS were investigated by SEM analyses, as mentioned in Figures 2(a)–2(c). Figure 2(a) shows that the PbS has a random nonporous nature due to the aggregation of the nanoparticles.
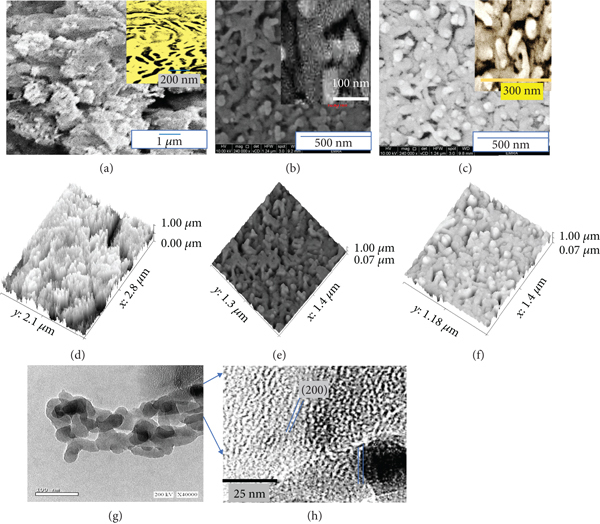
The SEM and modeling images of (a and d) PbS, (b and e) PANI, and (c and f) PANI/PbS nanomaterials. TEM images (g and h) for PANI/PbS nanocomposite at bare scales.
The morphology of the prepared PANI thin film is shown in Figure 2(b), in which the prepared PANI has a porous network with an elongated particle shape. This porosity is further demonstrated in the magnified figure. Moreover, this porosity is the key to facilitating the PbS nanoparticles’ penetration into the PANI network and deposition inside and outside the surface. This fact is confirmed in Figure 2(c), where the spherical PbS particles appear inside and outside the PANI network in the PANI/PbS material, having an average particle size of 43 nm.
The surface roughness and cross-section of PbS, PANI, and PANI/PbS thin films were studied using ImageJ software (Figures 2(d)–2(f). This morphological simulation strongly depends on the SEM real images. ImageJ confirms the nanoporous morphology of the PbS and PANI. Moreover, the composite PANI/PbS emerges with different nature, in which PbS white spheres coat the PANI network.
Furthermore, the TEM image of the PANI/PbS composite is shown in Figure 2(g) and 2(h) under different bare scales. The light and dark colors refer to the PANI and PbS nanoparticles inside the composite. The PbS nanoparticles are embedded with PANI nanoparticles with an interatomic distance of about 0.5 nm.
The abovementioned PANI/PbS composite morphology was expected to have a high-efficiency optical absorption behavior.
The FTIR spectra of PbS, PANI, and PANI/PbS nanomaterials are shown in Figure 3(a), and the corresponding summarized data is mentioned in Table 1. The vibration of the heteropolar PbS diatomic molecules appears at 1400 and 1601 cm-1. The N-H, C-H, and C–N aromatic stretching vibrations for PANI occur at 3401, 2918, and 1105 cm-1, respectively. The stretching vibrations of C=C quinoid and benzenoid rings appear at 1467 and 1301 cm-1, respectively. The paradisubstituted aromatic rings appear at 587 cm-1. After the PANI/PbS composite formation, there are redshifts for N-H, C=C quinoid, and C–N function groups stretching vibrations to 3424, 1470, and 1105 cm-1, respectively. However, there is a blue shift for the C=C benzenoid ring to 1291 cm-1.

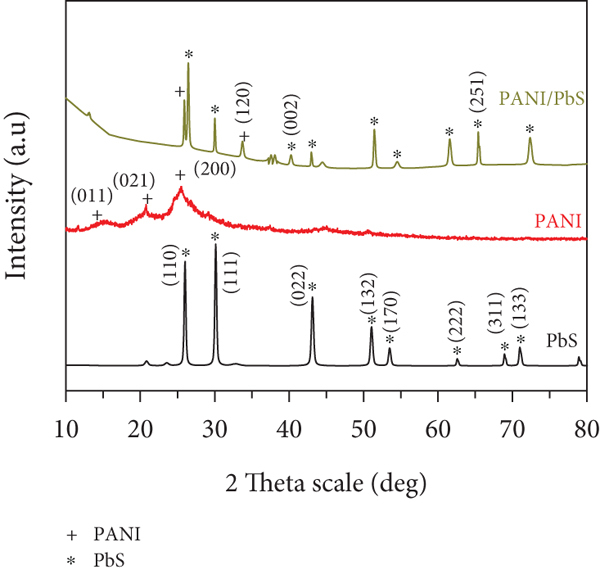
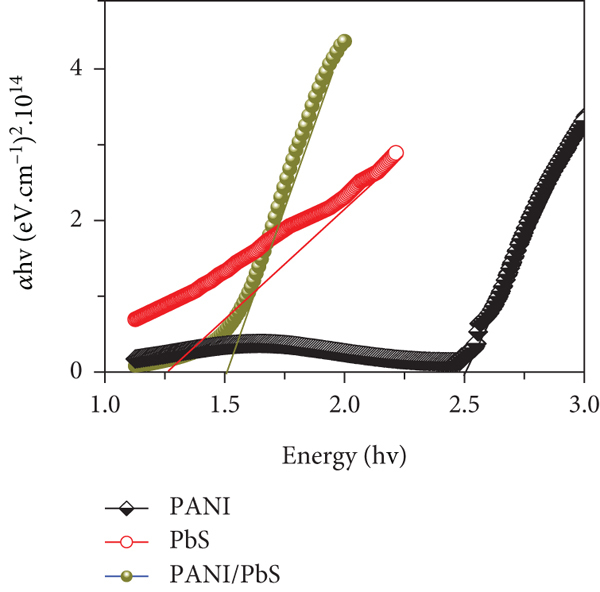
(a) FTIR, (b) XRD, (c) optical absorption, and (d) bandgap of PbS, PANI, and PANI/PbS nanomaterials.

The FTIR data of PbS, PANI, and PANI/PbS nanomaterials.
The XRD diffractometers of PANI, PbS, and PANI/PbS nanomaterials are shown in Figure 3(b). For PANI (red line), there are three crystalline peaks at
For the PbS nanoparticles (black line), there are eight peaks, in which the three sharpest peaks appear at
After forming the PANI/PbS composite, there are shifts in the two PANI-related peaks to
The average crystal size of the nanocomposite equals 34 nm, calculated according to Scherrer’s formula (Equation (1)) [35]. This equation depends on XRD wavelength (
The application of the prepared ATO/PANI/PbS as photoelectrode for H2 generation is based on its efficiency for light absorption. Therefore, an optical absorption study was conducted. The spectra of PANI, PbS, and PANI/PbS nanomaterials are given in Figure 3(c), while the bandgaps for these nanomaterials are shown in Figure 3(d). Regarding the PANI nanomaterial, there are three peaks at 275, 430, and 840 nm in the UV, Vis, and near IR, respectively. The sharpest two peaks in the UV and Vis regions correspond to the
The bandgap (
3.2. Photoelectrochemical Water Splitting
The photocatalytic wastewater-splitting reaction was achieved using a three-electrode cell, in which ATO/PANI/PbS, graphite sheet, and calomel are used as working, counter, and reference electrodes, respectively. The wastewater (third stage treatment), possessing a chemical composition mentioned in Table 2, was used as an electrolyte. At 25°C and a sweep rate of 100 mV.s-1, the measurements were carried out using a workstation (CHI660E) under an artificial xenon lamp.
The wastewater chemical composition.
Under the light effect, there are significant changes in the produced current density (

The effect of (a) dark and light, (b) on/off chopped light, and (c) reproducibility on the ATO/PANI/PbS photoelectrode.


The reproducibility of the PANI/PbS electrode is shown in Figure 4(c). The electrode has almost the same values under repeating runs. This confirms the stability of the prepared electrode for a water-splitting reaction. This stability is related to the PANI nature that does not dissolve in almost all chemical solvents.
The number of produced hydrogen moles was calculated by applying the Faradays law of electrolysis (Equation (4)) [36]. 0.1 mmol/cm2 h of H2 gas is delivered from the solution as bubbles. The Faradays law depends on many factors such as the
The
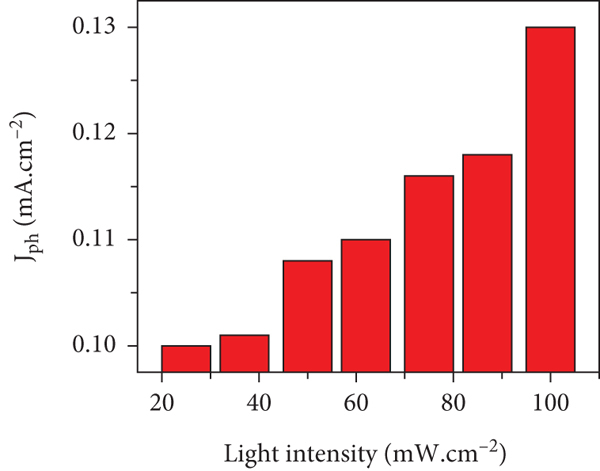
The relation between the light intensity (25 to 100 mW.cm-2) and

(a and b) The effect of light intensities on the ATO/PANI/PbS electrode for the current density values at 25°C.
The effect of light wavelengths (390 to 636 nm) on the ATO/PANI/PbS photoelectrode is mentioned in Figure 6, in which the produced

(a) The response of the ATO/PANI/PbS photoelectrode under different light wavelengths (390 to 636 nm) and (b) the
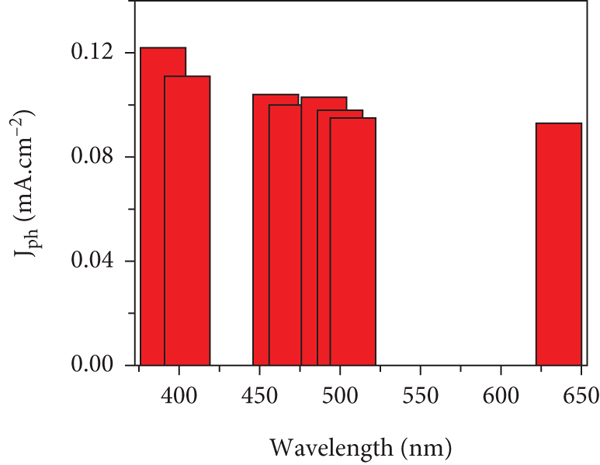
Based on these encouraging results, the prepared electrode responds to the different wavelengths in a broad light region.
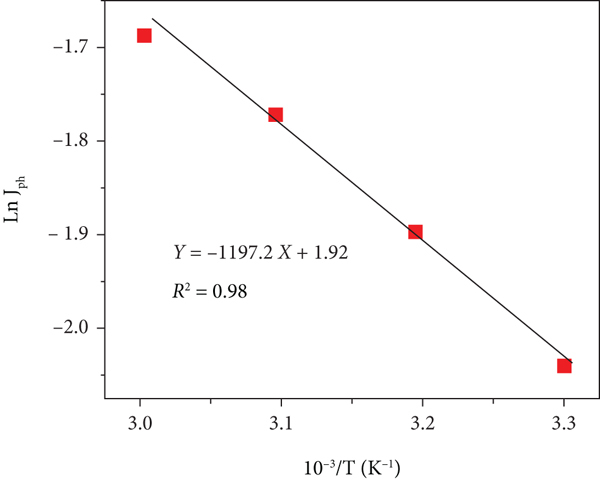
From 298 to 333 K, the effect of temperature on the ATO/PANI/PbS photoelectrode was studied, and the results are shown in Figures 7(a) and 7(b). This effect is reflected in the

(a and b) The temperature effect on ATO/PANI/PbS. The relations between (c) temperature reciprocal and LnJph and (d) temperature reciprocal and LnJph/T.


A comparison of the used electrolytes and produced
Comparison of the electrolytes and
Moreover, the H2 moles are calculated from the Faraday equation (Equation (6)) [36], under time change (dt), using the Faraday constant (
3.3. Mechanism and Theoretical Study of H2 Electrogeneration
The conversion of sewage water into H2 gas is carried out through sequence electron transfer between the PANI and PbS nanomaterials. Under the light incidence, the PANI/PbS captures these photons, which are split into both levels of PANI and PbS. Consequently, the electrons are transferred from the valency band HOMO in PANI to the conducting band LUMO. Nevertheless, there is the additional electron transfer from LUMO in PANI to the PbS conduction band having a lower energy level. Finally, the accumulated electrons on the PbS surface are directly transferred to the neighbor wastewater used as an initiator for the splitting process. Due to the difference in the energy levels of PANI and PbS, the Schottky barrier is formed, disrupting the electron transfer. This appears in the behavior of the current-voltage curve Figure 4(a) or 4(c). The role of PbS is crucial in minimizing the bandgap for the whole composite to reach 1.5 eV, which is close to the ideal bandgap of 1.2 to 1.3 eV. In addition, PbS has a dark color that captures and absorbs the light well, in which the photons reach the PANI surface. The role of PANI in the composite is also crucial, and it is the main material that has high compact to the supporting material ATO with high corrosion resistance and high lifetime. The main disadvantage of PANI is its large bandgap of about 2.5 eV, noting that this bandgap is enhanced using the PbS nanomaterial.
Figure 8(a) shows the nudged elastic band (NEB) [47] calculation of the energies along with the reaction path towards the production of hydrogen from water and PANI/PbS. We employed the NEB in the atomic simulation environment (ASE) [48]. The structure energy and minimization were performed via the xtb tight-binding module [49] and the BFGC method [50], respectively. We used the default module settings for the convergence thresholds and other calculation parameters.
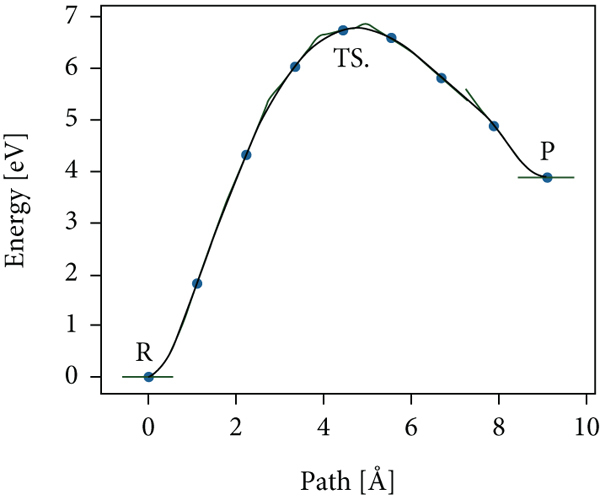
(a) The nudged elastic band (NEB) calculation of the energies along the reaction path towards hydrogen production.


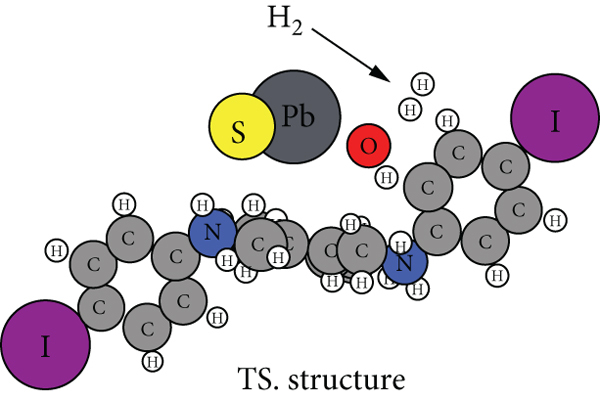
The calculated reaction barrier is
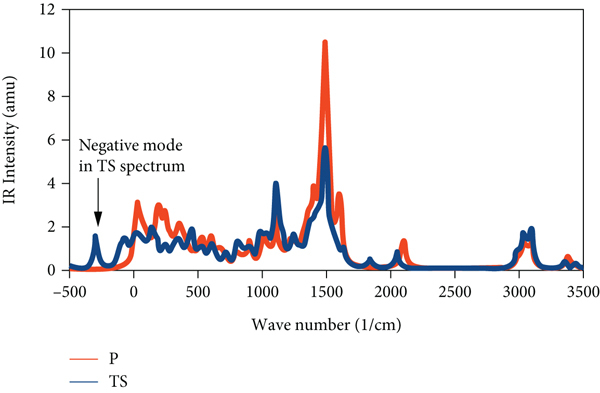
The calculated infrared (IR) spectrum for the
Besides the IR spectra in Figure 9, thermochemistry calculations gave rise to the
It is worth stressing that the calculation of Figure 8 gives a qualitative result about the reaction path. Quantitative reaction path analysis for comparison with experiments is possible by implementing the more computationally expensive quantum density functional methods. However, our present qualitative result clearly shows the formation of the reaction barrier in the path toward splitting the hydrogen from the water catalyzed by the PbS-polyaniline.
Finally, the nomenclature and its definition are mentioned in Table 4, while the input and output parameters are mentioned in Table 5.
The nomenclature and its definition of the items used in the present theoretical and experimental study.
The input and output parameters used in the present theoretical and experimental study.
4. Conclusions
Sewage water was valorized, and ATO/PANI/PbS nanocomposite was prepared and used as a photocathode for H2 production. The preparation process was carried out using the polymer to assist the PbS deposition in two steps: Pb2+ adsorption and then PbS deposition using thiourea and heating. The prepared nanocomposite was characterized using multiple techniques such as SEM, TEM, XRD, FTIR, and UV/Vis absorption. The FTIR and XRD analyses confirmed the chemical structure of PANI, PbS, and PANI/PbS composite. The latest’s average crystal size was 34 nm, determined by XRD.
The TEM, SEM, and ImageJ software confirmed the morphology of the PANI, PbS, and PANI/PbS, where PANI had a porous network nature making it an excellent candidate for the deposition of PbS in its pores and on its surface with high contact. Moreover, the bandgap of the composite, 1.5 eV, was more preferred than the solo PANI or PbS bandgaps of 2.5 and 1.24 eV, respectively. The conversion of the sewage water into H2 gas fuel was carried out through the prepared electrode with high efficiency. The electrode responded well to light, where the current density changed from 10-8 to 0.13 mA.cm-2 under dark and light, respectively. The thermodynamic parameters
Our team is working on synthesizing a prototype that can valorize and directly convert the wastewater into hydrogen fuel. The cost of producing 200 ml of hydrogen is about 2$. Our perspective is to decrease this cost to 1$ for one liter of hydrogen gas.
Footnotes
Data Availability
All the data used to support the findings of this study are included within the article.
Conflicts of Interest
The authors declare no conflict of interest.
Acknowledgments
The authors extend their appreciation to the Deanship of Scientific Research at Al Jouf University for funding this work through a research grant (no. DSR-2021-03-0314).