
Abstract
The inaccurate calculation of the gas lost is the principal cause of inaccurate determinations of the coalbed methane content via air reverse circulation sampling (ARCS). The positive pressure environment has a significant impact on gas desorption during the sampling process. To obtain the gas desorption mechanism of coal particles under positive pressure, positive pressure desorption experiments were conducted on coal samples with different particle sizes under different adsorption equilibrium pressures using a self-designed positive pressure desorption experimental device. And a positive diffusion model for coal particles was established, in which the diffusion coefficient was calculated based on the results of the positive desorption experiments. The diffusion model was then used to simulate the diffusion capacity of coal particles and compared with the test data. The results show that the responses of the positive pressure desorption and atmospheric pressure desorption to the adsorption equilibrium pressure are similar. The gas desorption velocity increases as the adsorption equilibrium pressure increases. Positive pressure can effectively inhibit gas desorption. The initial gas desorption velocity decreases as the positive pressure and coal particle size increase. Concurrently, the entire sample desorption process during ARCS can be divided into three stages: a slow desorption stage, an accelerated desorption stage, and an atmospheric desorption stage. The relationship between the diffusion coefficient and the positive pressure exhibits an exponential distribution, and the positive pressure diffusion model can describe the gas diffusion from coal particles well. The results of this study could help to establish a gas loss compensation model for the ARCS process.
1. Introduction
Obtaining accurate coalbed methane content is of great significance for coalbed methane resource evaluation and gas disaster control [1–4]. However, in recent years, the exploration and development of coalbed methane and coal mining practices have shown that the methane content measured in surface wells is lower than the actual gas content [5, 6]. The current surface well coal seam sampling technology takes a long time to collect a sample, resulting in a large amount of gas loss during the sampling period. In the past 50 years, the Barrer type has been widely used to calculate gas loss based on its solid theoretical foundation [7]. However, due to the limitations of the theoretical assumptions and human errors in practice, this method still has disadvantages. Scholars have proposed additional methods of calculating the gas loss, such as Bolt type [8], Winter type [9], and Wang type [10], which have improved the convenience and accuracy of the loss gas calculation [11, 12]. However, these methods pay more attention to the desorption data processing stage and ignore the impacts of the environmental factors on the gas loss during the transportation of the coal samples. Thus, scholars have proposed air reverse circulation sampling (ARCS) technology for surface wells. The ARCS drilling technology adopts a center sampling down the hole (DTH) hammer, a special reverse circulation drill bit, and a double wall drill pipe drilling tool system, and the drill cuttings are carried by high-pressure and high-speed air and discharged from the bottom of the hole. This method can not only be used for hard rock drilling and taking while drilling but also has the advantages of fast sampling, high precision, cleanness, and no pollution [13]. However, in the sampling process, the coal sample is in a positive pressure environment, and during the transportation of the coal samples, the coal samples collide, resulting in a reduction in the particle size [14].
The gas desorption from the coal particles is a gas transfer process in porous media, which is affected by the particle size, gas pressure, temperature, coal rank, and other factors [15, 16]. Regarding the influence of environmental pressure on the gas desorption from granular coal, more attention should be paid to the influence of a negative pressure environment on gas desorption. A negative pressure environment can cause an increase in the gas desorption kinetic parameters such as the gas diffusion rate and gas diffusion coefficient, and it can accelerate the gas desorption, so a negative pressure environment can promote gas desorption [17, 18]. In the ARCS process, the coal sample is in a positive pressure environment in an air medium, and the desorption law under a negative pressure environment is not suitable for calculating the gas lost from the coal sample during this process. Yang et al. [19] studied the sampling process from geological exploration boreholes and the gas desorption law under a positive pressure environment in a mud medium and found that the positive pressure environment of mud can effectively inhibit gas desorption from coal samples. However, little research has been conducted on gas desorption under a positive pressure environment in an air medium. The ARCS process is accompanied by a reduction in the coal particle size. Scholars have found that there is a particle size limit for granular coal, and the initial velocity of the gas emission decreases with increasing particle size. After the coal sample reaches the particle size limit, the initial velocity of the gas emission remains unchanged. The larger the particle size of the coal sample is, the smaller the kinetic diffusion parameter is, and the smaller the methane desorption rate is [20]. However, these studies on gas desorption from different particle sizes were all carried out under atmospheric pressure. The desorption of gas from coal with different particle sizes under a positive pressure environment has rarely been studied.
In this study, the gas desorption from coal particles under different positive pressures was investigated through positive pressure desorption experiments on coal samples with different adsorption equilibrium pressures and different particle sizes. The relationship between the diffusion coefficient of the coal particles and the positive was determined. A numerical model was established to predict the gas desorption from coal particles under different positive pressure environments. The results of this study could provide a basis for the establishment of a more accurate gas loss compensation model for ARCS.
2. Materials and Methodology
2.1. Sample Preparation
The blocks of anthracite used in this study were obtained from the Sihe coal mine, Jincheng, Shanxi Province, China, and the Canghai coal mine, Bijie, Guizhou Province, China (Figure 1). The physical parameters of the coal were evaluated using Chinese national standards (Table 1). The porosity of the coal is evaluated using the Chinese national standards (MT/T 918-2002 and GB/T 217-2008). The Chinese national standard (GB/T 212-2008) is used to measure the ash content (

Geographic locations of the coal sampling sites.
Physical parameters of the two coal samples.
Note:
2.2. Positive Pressure Desorption Test Procedure
A self-developed desorption experimental device was used to conduct the positive pressure desorption experiments (Figure 2). The device included a vacuum degassing system, constant temperature system, sorption equilibrium system, positive pressure regulation system, and desorption measurement system. The positive pressure regulation system controlled the allowable positive pressure value by adjusting the tightness of the back pressure value nut, and the adjustment range of the positive pressure value was 0 The prepared coal sample was weighed and placed in the sample canister. The void space volume in the sample canister was calibrated, and the tightness of the entire testing system was double-checked The sample cell was vacuumed. The device pipeline and coal sample canister were vacuumed until the reading of the vacuum gauge was less than 10 Pa The canister was inflated until sorption equilibrium was reached. The sample cell gas was changed via the reference cell. The pressure change of the sample cell was monitored to determine if sorption equilibrium had been reached. Only when the pressure remained unchanged at the preset pressure for 12 h could this phase end. Once the equilibrium point was reached, this phase ended and the sorption content and pressure were obtained. The preset sorption equilibrium pressures were 1 MPa, 2 MPa, 3 MPa, and 4 MPa Positive pressure desorption: back pressure values with corresponding positive pressure values (0.2 MPa, 0.5 MPa, 1 MPa, 1.5 MPa, and 2.0 MPa; a total of five different positive pressure conditions were set for the back pressure values) were installed. The back pressure value was connected to the desorption measurement system. The drainage gas gathering drum was filled with sufficient saturated salt water. The faucet at the bottom of the drainage and gas gathering drum was opened, and the reading of the electronic scale was set to zero after the water flow stopped. The positive pressure desorption was started, and the gas in the coal sample canister entered the drainage and gas gathering channel through the back pressure valve. The water discharge was measured using the electronic scale, and the amount of gas desorption was calculated using

Desorption experiment device.
2.3. Method of Correcting the Free Gas Content
In the positive pressure desorption experiment, after the sample reached adsorption equilibrium, desorption began under the positive pressure environment. At this time, part of the free gas in the void space of the coal sample canister entered the drainage gas collection drum through the back pressure value, and the other parts remain in the void space. The amount of free gas in the drainage gas gathering drum was calculated by calibrating the void space and pipeline volume, and the method of collecting the free gas before desorption cannot accurately remove the free gas contained in the amount of gas desorption in the positive pressure desorption experiment.
After the experimental coal sample was loaded into the coal sample canister, the free gas content of each group of experiments was corrected. According to the extremely small adsorption of helium onto the coal, the correction method was applied according to the positive pressure desorption experiment steps. The free gas content contained in the total gas desorption content can be obtained using helium as the inflation medium.
Thus, the positive pressure gas desorption content is the difference between the gas desorption content and the discharged helium content under the standard state.
2.4. Desorption Data Processing Method
The gas desorption velocity was calculated using the following equation:
The Winter equation (Equation (4)) was used to fit and analyze the gas desorption velocity, and the relationship between the gas desorption speed and desorption time and the initial gas desorption velocity was obtained.
The Uskinov equation (Equation (5)) can be used to describe the gas desorption curve, which shows the initial gas desorption velocity of the sample.
3. Results
3.1. Desorption Velocity under Different Adsorption Equilibrium Pressures
Figure 3 shows the relationship between the desorption velocity and time for the Sihe sample a particle size of 1

Relationship between desorption velocity and time: (a) under atmospheric pressure and (b) under a positive pressure of 0.2 MPa.

Parameters of the gas desorption velocity.
Figure 3 shows that the variations in the gas desorption velocity of the Sihe coal sample with desorption time obey a power function distribution. After the desorption begins, the gas desorption velocity of the coal sample decreases to varying degrees. At the beginning of the desorption, the gas desorption velocity decreases greatly with increasing desorption time. As the desorption time increases, the reduction range of the gas desorption velocity decreases and gradually approaches zero. Table 2 shows that the initial gas desorption velocity of the coal sample exhibits the same change trend as the adsorption equilibrium pressure under the atmospheric and positive pressure environments, and the initial gas desorption velocity
3.2. Desorption Velocity under Different Positive Pressures
Figure 4 shows the relationship between the desorption content and time based on the Uskinov equation (Equation (5)). Table 3 presents the parameters of the gas desorption content obtained using Equation (5).
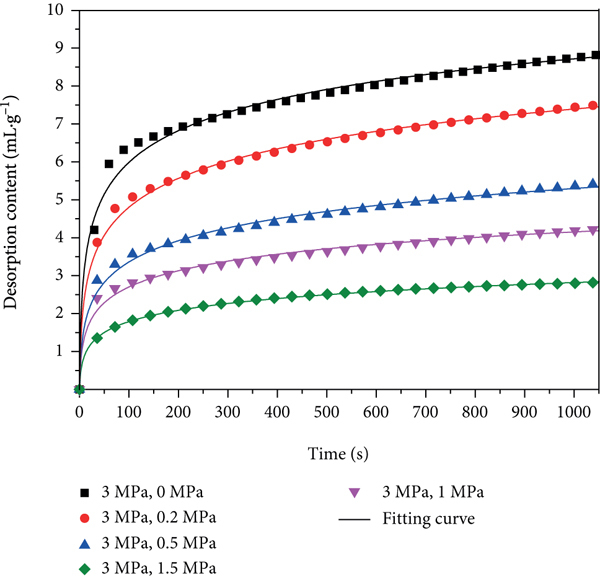
Relationship between the desorption content and time under different positive pressures: (a) Sihe sample and (b) Canghai sample.
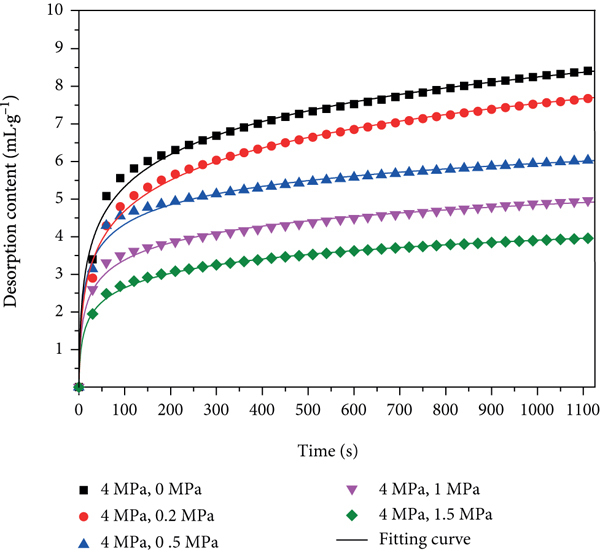
Parameters of gas desorption content.
Table 3 shows that under an ambient temperature of 30°C, the initial gas desorption velocity of the coal sample decreased gradually with increasing positive pressure. Compared with atmospheric pressure desorption, the initial gas desorption speeds under 0.2 MPa, 0.5 MPa, 1 MPa, and 1.5 MPa were 28.29%, 52.13%, 59.58%, and 74.49% lower, respectively. Under an ambient temperature of 20°C, compared with atmospheric pressure desorption, the initial gas desorption velocities under 0.2 MPa, 0.5 MPa, 1 MPa, and 1.5 MPa were 18.48%, 20.82%, 25.88%, and 45.71% lower, respectively. These data demonstrate that the positive pressure effectively inhibited the initial gas desorption velocity. During the actual ARCS process, when the sampling bit breaks the coal, the bottom hole is in a high positive pressure environment, which has a strong inhibitory effect on the desorption from the coal samples. The coal sample returns with the high-speed gas flow, the environmental pressure of the coal sample decreases, the maximum amount of gas desorption and the initial gas desorption speed of the coal sample increase rapidly, and the inhibitory effect of the environmental pressure on the gas desorption decreases.
3.3. Variations in Desorption Velocity with Particle Size
Figure 5 shows the relationship between the desorption content and time for the Sihe coal samples with different particle sizes under positive pressures of 0.5 MPa and 1 MPa obtained using the Uskinov equation (Equation (5)). Table 4 shows the parameters of the gas desorption content obtained using Equation (5).

Relationship between the desorption content and time for different particle sizes: (a) positive pressure of 0.5 MPa and (b) positive pressure of 1 MPa.

Parameters of gas desorption content.
Table 4 shows that the initial gas desorption velocity decreased as the coal particle size increases under a given positive desorption pressure. The initial gas desorption rate of the coal sample decreased obviously when the coal particle size increased from the millimeter to centimeter scale. The initial gas desorption rate of the centimeter-size coal sample decreased slightly with increasing particle size. During the actual reverse circulation sampling process, when the sampling bit breaks the coal, the particle size of the sample is large and the initial gas desorption speed is small. The coal sample returns with the high-speed gas flow, the particle size of the coal sample decreases through collisions, and the initial desorption velocity of the coal sample increases.
3.4. Discussion of Sample Desorption Curve during ARCS
Based on the variation characteristics of the initial gas desorption velocity of the coal samples with different particle sizes under different positive pressures, the entire sample desorption process can be divided into three stages (Figure 6): a slow desorption stage, an accelerated desorption stage, and an atmospheric desorption stage. The coal sample is near the bottom of the hole in the slow desorption stage. In this stage, the desorption of the coal sample is slow because the desorption of the large particle size coal sample is inhibited under the positive pressure environment of the bottom of the hole. The accelerated desorption stage refers to the accelerated upward return process of the coal sample in the well. Due to the decrease in the environmental pressure and the decrease in the particle size of the coal sample via collisions during the upward return process, the desorption velocity of the coal sample increases rapidly. The atmospheric desorption stage refers to the atmospheric desorption of the coal sample after reaching the ground surface.

Sample desorption curve during ARCS.
4. Numerical Model
4.1. Diffusion Coefficient
The gas diffusion coefficient is a basic parameter used to characterize the gas desorption and diffusion in coal. The gas diffusion coefficient must be determined to establish a gas diffusion model. The gas diffusion coefficient can be calculated using the following equations [22]:
In the rectangular coordinate system,

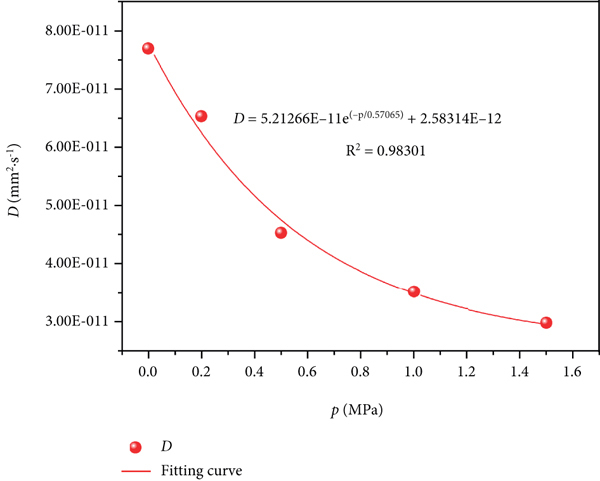
Relationship between

Calculation results for

The fitting of the positive pressure and diffusion coefficient data: (a) Sihe sample and (b) Canghai sample.
4.2. Model Establishment
Gas desorption from coal particles is a complex process. From the point of view of molecular motion, the adsorption and desorption of the gas molecules onto and from the pore walls are completed instantaneously. However, in fact, the flow of gas through granular coal takes a certain amount of time because the resistance needs to be overcome when the gas gushes from the granular coal through pores and fractures of different sizes. The emission process of the gas from the granular coal is regarded as the diffusion of gas in a porous media, and its emission law conforms to Fick’s law of diffusion:
This equation is the first law of diffusion. In Equation (11), the negative sign indicates that diffusion occurs in the opposite direction of the concentration increase. When Fick’s law of diffusion is applied to a three-dimensional unsteady flow field, the second law of diffusion can be derived according to the law of mass conservation and the principle of continuity:
The model is a classical homogeneous coal particle diffusion model, and its assumptions are as follows: (1) the coal chips are composed of spherical particles. (2) The coal cuttings are homogeneous and isotropic. (3) The gas flow follows the law of mass conservation and the principle of continuity. (4) The diffusion coefficient is independent of the concentration, time, and coordinates. (5) The gas desorption from the coal dust is an isobaric desorption process under isothermal conditions.
The mathematical method is used to discuss the theoretical solution of the equation for gas diffusion from coal dust. Set
Thus, the coal gas diffusion equation is changed into a one-dimensional linear flow equation. For coal particles, the concentration reaches a certain value
By solving Equation (14), the relationship between the gas concentration in the coal particles and time can be obtained:
4.3. Numerical Solution of the Theoretical Model
The diffusion coefficients of the Sihe coal particles under a pressure of 3 MPa, a temperature of 30°C, and positive pressures of 0.3 MPa, 0.8 MPa, 1.2 MPa, and 2 MPa and that of the Canghai coal particles under a pressure of 4 MPa, a temperature of 20°C, and positive pressures 0.3 MPa, 0.8 MPa, 1.2 MPa, and 2 MPa were predicted using Equation (10). The numerical solutions of
Numerical solution parameters.

Results of numerical solution.

Sihe sample, positive pressure of 0.5 MPa, desorption time of 1000 s

Sihe sample, positive pressure of 1.5 MPa, desorption time of 1000 s

Canghai sample, positive pressure of 0 MPa, desorption time of 1000 s

Canghai sample, positive pressure of 0.5 MPa, desorption time of 1000 s

Canghai sample, positive pressure of 1.5 MPa, desorption time of 1000 s

Predictions of gas desorption content of Sihe sample

Predictions of gas desorption content of Canghai sample
Figures 9(a)
Figures 9(g) and 9(h) show the prediction curves of the gas desorption contents of the Sihe and Canghai coal samples under positive pressures of 0.3 MPa, 0.8 MPa, 1.2 MPa, and 2 MPa. In addition, the prediction curve of the gas desorption capacity at 1.5 MPa for the Sihe coal sample and the experimental data curve are presented in Figure 9(g). The desorption trends of the two are basically consistent. The predicted desorption capacity at 1000 s is 3.1654 mL/g, and the experimentally measured desorption capacity at 1000 s is 2.8104 mL/g, with an error of 12.6%. The predicted gas desorption capacities at 1000 s for the Sihe coal sample under positive pressures of 0.3 MPa, 0.8 MPa, 1.2 MPa, 1.5 MPa, and 2 MPa are 6.919 mL/g, 4.7762 mL/g, 3.7137 mL/g, 3.1654 mL/g, and 2.0436 mL/g, respectively. The gas contents of the Canghai coal sample under positive pressures of 0.3 MPa, 0.8 MPa, 1.2 MPa, and 2 MPa are 7.2286 mL/g, 5.2339 mL/g, 4.4475 mL/g, and 3.1046 mL g, respectively.
5. Conclusions
The response characteristics of positive pressure desorption and atmospheric pressure desorption to the adsorption equilibrium pressure are similar. For a given desorption positive pressure, the gas desorption velocity increases as the adsorption equilibrium pressure increases Positive pressure can effectively inhibit gas desorption. For a given desorption positive pressure, the initial gas desorption velocity decreases as the positive pressure increases; and the initial gas desorption velocity decreases as the coal particle size increases. Moreover, the entire sample desorption during the ARCS process can be divided into three stages The diffusion coefficients of the Sihe and Canghai coal samples under different positive pressures were calculated, and the relationship between the diffusion coefficient and positive pressure was found to obey an exponential distribution The positive pressure diffusion model can describe the gas diffusion from coal particles well using the diffusion coefficients calculated based on the results of the experiments. The gas diffusion contents under positive pressures of 0.3 MPa, 0.8 MPa, 1.2 MPa, and 2 MPa were simulated
Footnotes
Data Availability
When other researchers need data, the author can provide it.
Conflicts of Interest
The author declares no competing financial interest.
Acknowledgments
The author acknowledges the relevant coal mine for providing the desired coal samples for this study. This work was supported by the National Key Research and Development Program of China (2018YFC0808001).