
Abstract
p-sulphonated calix[4]arene (p-SOCX) functionalized cellulose acetate/graphene oxide (CA/GO) nanofibers were successfully prepared via the electrospinning technique. The presence of p-SOCX within the fiber matrix was ascertained using Fourier Transform Infrared spectroscopy and Carbon-Hydrogen-Nitrogen-Sulphur elemental analyses. Apparent changes in morphology of the samples were observed under scanning electron microscope where fiber diameters increased with increasing p-SOCX content. Preliminary dye removal test at different pH, dosage, and temperature of functionalized CA/GO nanofiber demonstrates enhanced adsorption capacity of methylene blue in presence of p-SOCX compared to pristine CA nanofiber and CA/GO nanofiber at an optimum pH 8. The highest removal efficiency obtained was 88.84% with initial methylene blue dye concentration of 10 mg/L, adsorbent dosage of 20 mg/10 mL, contact time of 30 min at room temperature ca. 293 K.
1. Introduction
There is a major global concern on water quality. The increasing demand for organic dyes in industrial activities, namely, textile, cosmetic, tanning, and others has resulted in large quantities of dye released to the environment [1]. Methylene blue (MB) dye, which is cationic, is mainly used for dyeing cotton, wool, and silk and is also used in medical applications as a chromophore due to its polar characteristic and strong resistance towards biodegradation [2, 3]. Nevertheless, continuous exposure to MB may lead to health issues such as mental confusion, vomiting, eye burn, shock, and increased heartbeat rate [4]. Due to its relevance and wide range of applications, MB, a member of the thiazine dye class, is chosen as the targeted dye for this investigation [5]. To date, various technologies such as membrane filtration, flocculation, chemical oxidation, ozonation, ion exchange, irradiation, and adsorption has been explored [6]. However, most of these methods have disadvantages such as lack of reusability which may hinder their widespread usage for large scale operations [7]. Meanwhile, adsorption technique offers advantages such as low development cost, easy to handle, and simple design [8].
Utilizing source abundant materials for dye removal such as cellulose acetate, CA as an adsorbent is preferred, however, its application in wastewater treatment is hampered due to the limited adsorption capacity of pristine CA. Several studies reported that, by grafting the fibers with functional groups of carboxyl (-COOH), amine (-NH₂), and sulfonate (-SO₃H) and also by addition of graphene oxide (GO), the dye adsorption capability can be enhanced [7]. The latter, i.e., GO, is endowed with oxygen-rich functional groups, which is readily modifiable via organic chemistry, and also possess other traits such as better stability, antifouling, and hydrophilic, which are ideal for the development of an excellent adsorbent [9].
Calixarene’s are dubbed as third-generation macromolecules after crown ethers and cyclodextrins [10]. They have received considerable attention due to their unique structure of three-dimensional (3D) cavity-type which are made up of phenolic units linked by methylene bridges with upper and lower rims that can be chemically tailored. Such structures are preferable to be used as molecular platforms having selective interaction with cations, anions, or neutral molecules [11, 12]. Furthermore, presence of benzene rings renders calixarenes effective for benzene-based pollutants extraction such as MB and others [13]. Calixarene’s unique conformation and complexation properties lend well in studies of synthetic, natural hosts, and the water treatment industry [10]. Nevertheless, novel composites materials from calixarenes are also being developed so as to extend its widespread applications resulting in various uses such as luminescent probes, solid phase extractants, adsorbents, catalyst, and sensor [7]. Noteworthy mentioning, majority of calixarenes are soluble only in nonpolar organic solvents such as toluene and chloroform, thus are nonenvironmentally friendly. On the other hand, water soluble calixarenes are more environmentally friendly and feasible for functionalization, thus we have selected p-sulfonated calixarene to use in this study (Figure 1).

Chemical structure of calix[4]arene bearing sulphonate groups on the upper-rim.
Lafi et al., reported that by incorporating calix[8]arene into PAN nanofibers (C/PAN) [8] for the removal of Congo red and neutral red, it exhibited good stability and convenient recovery [14]. Moreover, PAN nanofibers containing calixarenes bearing N-methylglucamine functional groups (Calix-NMG/PAN) were reported as efficient adsorbents to remove chromate anions and uranium cations. The said composite provides higher ion binding ability due to high surface area, porosity, flexibility, and microporosity of PAN nanofibers with calixarene molecules containing N-methylglucamine as a chelating group [15]. There are also adsorption studies reported involving porous covalent calix[4]arene-based polymer towards cationic dyes namely, MB and rhodamine B, which exhibits maximal adsorption capacities of 625 mg/g and 484 mg/g, respectively [7]. This proves that calixarene has potential towards cationic ion removal [15].
The primary goal of this study is to utilize calixarene and graphene oxide to develop a novel composite cellulose-based nanofiber and to assess the adsorption behavior and critical analytical variables affecting the adsorption effectiveness of newly synthesized nanofibrous mat of CA/GO with p-SOCX toward the carcinogenic MB dye from aqueous environment. Nanofibers possess characteristics such as high surface area and high volume to mass ratio thus have been favored in water or wastewater treatment [16, 17]. An effective method for preparing nanofibers from a wide range of polymers in different shapes is known as electrospinning. Since nanofibers are affordable from a range of polymers, polymer blends, sol-gels, suspensions, emulsions, and composite structures, this technology offers a remarkable advantage over conventional manufacturing procedures [18]. The prepared composite material was thoroughly characterized using FT-IR, SEM, TGA, XRD, CHNS, and the operating parameters for dye removal from aqueous solution was studied.
2. Experimental
2.1. Material
CA (M.W.: 264.23 g/mol, 29-45%) and acetone (M.W.:58.08 g/mol, 99.5%) were supplied by R&M Chemicals, Malaysia. N, N-dimethylformamide (M.W.:73.09 g/mol, 99.9%) was purchased from Chemiz, Malaysia while GO and p-SOCX (M.W.: 744.74 g/mol, 4-10% edge-oxidized) were obtained from Sigma-Aldrich. MB (M.W.: 319.00 g/mol, 96%) was purchased from BDH Laboratory supplies. Sodium hydroxide (NaOH, M.W.: 40.00 g/mol, 99%) and hydrochloric acid (HCl, 37%) was purchased from Merck. Distilled water was used throughout the experiments.
2.2. Preparation of Cellulose Acetate/Graphene Oxide/p-Sulphonated Calix[4]Arene (CA/GO/SOCX) Nanofiber
1 g of CA was first dissolved in an acetone and DMF mixture solvent system until a clear solution was obtained. Next, 0.05 g of GO and 1%, 3%, and 5% of p-SOCX were added into the solution and mixture was left until complete dissolution. A 10 mL syringe was then used to feed the mixture solution shown in Figure 2 for the fiber-making step via electrospinning. A collector plate covered with aluminium foil was used as a substrate to collect the electrospun nanofibers shown in Figure 2. The operating voltage was set to 19 kV with flow rate of 2.0 mL/h. The distance between the nanofiber collector and the tip of the needle was fixed at 10 cm.

Schematic diagram of the nanofiber preparation using electrospinning setup.
2.3. Physicochemical Characterization of Adsorbents
FTIR measurements were carried out using an Alpha II, Bruker spectrometer equipped with a platinum diamond ATR module, ZnSe beam splitter, and a RT-DLaTGS detector. The transmission spectra were recorded between 550 and 4000 cm−1 with a spectral resolution of 4 cm-1 accumulating 32 scans. Elemental analysis of the nanofibers obtained was performed using carbon-hydrogen-nitrogen-sulphur (CHNS) analyzer TruSpec® micro, Leco, U.S. Morphological study of the nanofibers was carried out using JEOL, JSM-IT100 InTouchScope™ scanning electron microscope with 10 kV accelerating voltage and working distance of 12 mm. MB absorbance was determined using UV-Vis spectrometer Perkin Elmer SPS 1063 while pH was monitored using a pH meter (CyberScan 500, Eutech Instruments). The crystal phases and structure of all samples were identified by X-ray diffraction (XRD, Shimadzu Model XRD-6000) at 2θ range from 20° to 50° with scanning rate of 2°/min [19]. Meanwhile, the weight loss of nanofibers was measured using thermal gravimetric analysis (TGA), using Mettler Toledo Thermogravimetric Model (TGA/SDTA-851e/STARe). The samples were cut into small pieces and heated to temperatures between 50°C to 700°C in nitrogen atmosphere, and weight loss was recorded.
2.4. Dye Removal Study
MB stock solution was prepared by first dissolving 1 g of MB into 1 L of deionized water followed by dilution to different concentrations ranging from 10 ppm to 100 ppm. A calibration curve was then established at the absorbance of 664 nm. Adsorption study was conducted in batch mode at different conditions, i.e., pH, dosage, and temperature. The pH effect towards MB adsorption was investigated between pH 7 to pH 10 by adjusting the pH of the dye solution using 0.1 M HCl or 0.1 M NaOH and adsorbent dosage was varied from 6 mg to 30 mg while the temperature studies was carried out between 293 K to 353 K. All experiments were repeated 3 times each.
Prior to the MB removal test, pH value at the point of zero charge (pHPZC) of the nanofiber samples was investigated using the salt addition method which involves 0.025 g of adsorbent in 10 mL of 0.01 M sodium nitrate (NaNO3) at pH values of 5, 7, 8, 9, and 10 and were left overnight. The
2.5. Effect of Temperature
To study the effect of temperature, MB adsorption was carried out at 273 K, 338 K, and 358 K at 10 ppm MB concentration for 30 minutes. By using Equations (3)–(5), the thermodynamic parameters, namely, equilibrium constant:
3. Results and Discussion
3.1. FTIR Spectroscopy Analysis
Representative IR peaks of starting materials were observed in the nanofiber composite which attest to the successful process of integrating the materials. In general, FTIR spectra for CA closely resembles the composite nanofiber (CA/GO/SOCX 1%) albeit with slight shifting and differences in peak intensity as shown in Figures 3(a) and 3(b). Broad absorption peaks at around 3400 cm-1 due to O–H stretching vibrations are discernible in all samples. Sharp absorption peak at 1740 cm-1 followed by a small shoulder at 1724 cm-1 attributed to C=O and C=C aromatic stretching vibrations are observed in all CA containing samples [21]. Therefore, mentioned C=C absorption peaks were also observed in the FTIR spectra of GO, p-SOCX, and the composite [22]. Likewise, other main absorption bands of CA which are also present in GO and p-SOCX namely, C–O and CH2 vibration was observed at 1040 cm-1 and 1428 cm-1, respectively. Absorption peaks attributed to S=O stretching vibrations at 1200 cm-1 and 1050 cm-1 were also observed for SOCX and the composite nanofiber [23]. Thus, it can be concluded that GO and p-SOCX has been successfully integrated inside the nanofiber.

(a) FTIR spectra of starting material CA, GO, SOCX, and combined CA functionalized GO with 1% p-SOCX, (b) FTIR spectra of nanofibers of CA, GO functionalized CA, and GO functionalized CA with different amount of p-SOCX (1%, 3% and 5%).

3.2. SEM Analysis
SEM images of the CA/GO nanofibers with different concentration of p-SOCX (1%, 3%, and 5%) are as shown in Figure 4. Smooth and uniform CA nanofibers was obtained with average fiber diameter of

SEM micrograph of (a) CA nanofiber and (b) CA functionalized GO nanofiber, CA functionalized GO with (c) 1% p-SOCX, (d) 3% p-SOCX, and (e) 5% p-SOCX. 10000X magnification.

CA/GO
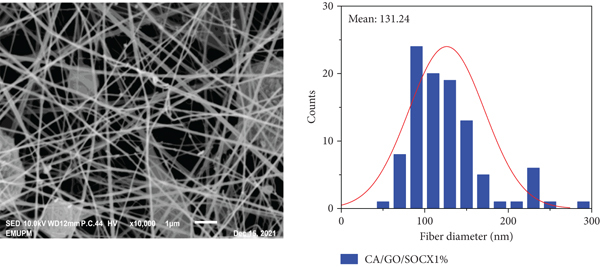
CA/GO/SOCX1%

CA/GO/SOCX3%

CA/GO/SOCX5%
3.3. XRD Analysis
XRD patterns in Figure 5 of CA exhibits typical cellulose acetate peaks at 14.16° and 21.06°, indicating a semicrystalline and amorphous phase of the CA nanofiber, respectively [26, 27]. On the other hand, CA/GO sample shows the major diffraction peak at 21.06° in which the CA peak intensity decreased indicating the successful incorporation of GO in CA nanofiber [24, 28]. In addition, the lower intensity reflections could be assigned to the other constituents as the weak broad peaks at the 2θ of 10°, 14°, and 21° were attributed to the amorphous structure, which relates to p-SOCX, CA, and GO components, respectively [27]. Hence, the XRD pattern provided a binary structure for prepared nanocomposite based on crystallinity and amorphous properties [29]. The XRD patterns of the CA/GO/SOCX materials exhibit a prominent peak around

XRD diffractograms for nanofibers of CA, CA/GO, and CA/GO functionalized with 1%, 3%, and 5% p-SOCX.
3.4. TGA Analysis
Thermogravimetric analysis was carried out to study the compositions thermal stability; the results are displayed in Figure 6. Three stages of nanofiber degradation occurred in succession, from 50 to 300°C, 300 to 400°C, and 400 to 700°C. [31]. The initial step considered weight loss, moisture loss from the material, and solvent residue from the electrospinning process. The weight loss of pure CA nanofibers from 242 to 327°C was attributed to the degradation of bulk CA while CA/GO nanofiber weight loss start from 263 to 328°C due to the removal of different oxygen containing functional group on GO surface and thermal pyrolysis of the cellulose skeleton within this temperature range [32–34]. The moisture content in the CA is 8% while 5% for CA/GO based on the initial weight loss as the lingering solvents from the CA electrospinning solution may be responsible for the small weight loss variation between the electrospun nanofibers [16, 35]. Noteworthy mentioning, CA/GO exhibits slightly better thermal stability compared to CA based on the weight loss behavior observed at 300°C to 350°C, thus suggesting that GO imparts thermal stability to the nanofiber. Both compositions experienced an exponential increase in the rate of weight loss, which peaked at 92% for CA and 95% for CA/GO nanofibers. [17]. de Almeida et al., reported that the third stage occurs above 400°C, where the entire degradation of the nanofiber occurs, leaving a little amount of residues for materials containing CA [21].
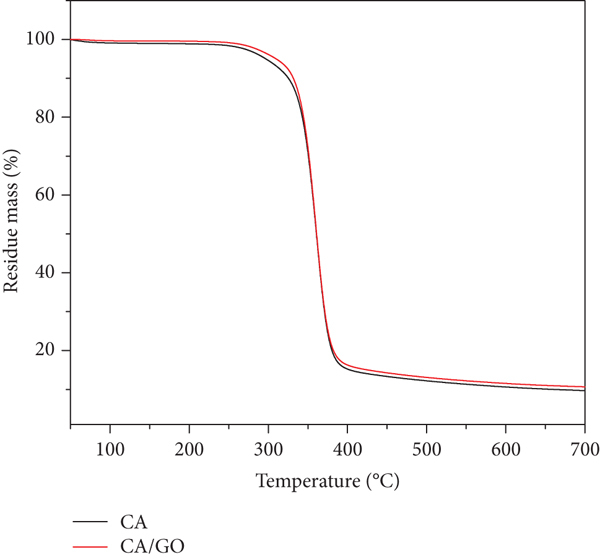
TGA Curves of CA nanofiber and CA with GO nanofiber at temperature between 50°C to 700°C.
3.5. Elemental Analysis
The elemental analysis results of CA, CA/GO, and CA/GO/SOCX (1%, 3%, and 5%) are as shown in Table 1. Results show that the experimentally determined percentage of carbon, hydrogen, and sulphur are close to the calculated values. An increase in sulphur content was observed with increase in p-SOCX loading (Table 1). Nevertheless, differences in values may occur due to presence of impurities originating from the solvents that are used to dissolve the polymer solution prior to the fiber making process. In conclusion, it can be confirmed that both GO and p-SOCX are successfully integrated into the nanofiber.
CHNS elemental analysis of CA, GO functionalized CA nanofiber, and GO and p-SOCX functionalized CA nanofiber at different amount of p-SOCX (1%,3%, and 5%).
3.6. Effect of pH, and Adsorbent Dosage
Since pH may give rise to ionization of the adsorbate,

pH of point of zero charge (pHPZC) for CA, GO functionalized CA nanofiber, and GO functionalized CA with different p-SOCX loading (1%, 3%, and 5%). Conditions for

Study on effect of pH towards MB removal (a) and adsorption capacity (b) for all nanofibers (CA, GO functionalized CA nanofiber, and GO functionalized CA with SOCX 1%,3%, and 5%). Static adsorption condition for pH study, dosage 6 mg/L, concentration 10 ppm, and contact time 30 minutes. Effect of adsorbent dosage towards MB removal (c) and adsorption capacity (d) for GO functionalized CA with 1% of SOCX. Static adsorption condition for dosage study, pH 8 concentration 10 ppm, and contact time 30 minutes.


MB removal at pH below than 7 was insignificant, possibly due to at lower pH values i.e., acidic, the electrostatic repulsion between protonated adsorption sites on the adsorbents and the protonated dimethylamine group in MB limits the interaction and results in low adsorption capacity [36]. However, upon increasing pH, deprotonation of sulfonate group takes place, generating negative surface charge on p-SOCX leading to arising electrostatic interactions between MB and p-SOCX molecules, thus, favoring the adsorption process [37, 38]. Herein, a maximum adsorption of 61% and the adsorption capacity ca. 6 mg/g at pH 8 for CA/GO/SOCX 1% sample was obtained (Figure 8(a)). Meanwhile, at high pH i.e.,
Based on the best adsorption performance exhibited by CA/GO/SOCX 1% nanofiber, it was selected for the study on effect of dosage. Herein the amount of CA/GO/SOCX 1% was varied between 6 to 30 mg (Figures 8(c) and 8(d)). Figure 6(c) shows that below 20 mg adsorbent, the removal percentage exhibits a steady increase along with an increase in the amount of adsorbent, indicating an increase in available adsorptive surface sites. However, at 20 mg and above, a plateau is observed which indicates equilibrium i.e., saturation of adsorptive sites. Meanwhile, adsorption capacity decreased with an increase in adsorbent dosage amount due to an increase in interaction between active sites of nanofibrous adsorbents with a fixed amount of MB molecules available [41].
Other similar adsorbents which incorporate calixarene for MB removal have also been reported elsewhere. For instance, Kamboh et al., reported that 94% of MB removal was recorded for p-sulphonatocalix[8]arene-based silica resin at pH 9.5 at adsorbent dosage of 40 mg/L [13]. Meanwhile, in another study, calix[8]arene modified sulphur exhibited >90% MB removal at pH 6 with adsorbent dosage of 45 mg/L and 180 minutes contact time [42]. Silica gel supported dinitro calix[4]arene cage, was reported to achieve 93% MB removal at pH 12 with 0.05 mg/L of adsorbent dosage and 120 minutes contact time. [23]. On the other hand, the adsorbent developed in this study i.e., CA/GO/SOCX 1% has the ability to remove up to 88.84% of MB at 20 mg/L adsorbent dosage in 30 minutes. Noteworthy mentioning that, only small amount of adsorbent is needed to remove the MB and with shorter time by using CA/GO/SOCX 1% compared to other adsorbents mentioned above.
3.7. Effect of Temperature
Results shown in Figure 9 indicates that adsorption is promoted with increase in temperature, where an 85% removal at 293 K increased to 92% at 338 K followed by 95% at 353 K. This increase in adsorption efficiency with temperature suggests an endothermic nature of the adsorption process, i.e., chemisorption [43]. The change in free energy (

MB removal at different temperatures (293 K, 338 K, and 353 K) with static adsorption condition:

Van’t Hoff plot for evaluating the thermodynamic parameters of MB adsorption by GO functionalized CA with 1% p-SOCX. Static adsorption condition: pH 8, dosage 20 mg/L, concentration 10 ppm, and contact time 30 minutes.
Thermodynamic parameters for MB adsorption onto GO functionalized CA with 1% p-SOCX.
4. Conclusion
CA/GO/SOCX nanofiber was successfully prepared using the electrospinning technique featuring superior MB dye removal efficiency compared to CA and CA/GO alone. SEM, FTIR, XRD, TGA, and CHNS analyses confirmed the presence of CA, GO, and p-SOCX in the nanofiber sample obtained. SEM images also showed that the fibers diameter web increased within increase in p-SOCX loading. The optimum dye removal conditions, i.e., pH and dosage were established at pH 8 and 20 mg/L, respectively. Best adsorption capacity was shown by CA/GO/SOCX 1% nanofiber sample with 4 mg/g adsorption capacity and 88.84% MB removal.
Footnotes
Data Availability
The authors confirm that all data generated or analyzed during this study are available from the corresponding author. These materials can be requested directly from the corresponding author if needed.
Conflicts of Interest
The authors declared no conflict of interest with respect to the research, authorship, and publication of this article.
Acknowledgments
Authors would like to thank the Ministry of Education Malaysia for funding this study, through grant no: FRGS/1/2018/STG01/UPM/02/11.