
Abstract
Clay minerals are considered as a promising material in the context of geological barrier for the confinement of radioactive and industrial waste. Understanding the usefulness of the smectite mineral, in this approach, remains insufficient. The deep investigation about structural response/changes, hydrate stability, cation exchange process, permeability, and heavy metal/radionuclide adsorption/removal efficiency under external constraints is needed. To explore the structural alteration, the hydration stability, and the evolution of montmorillonite porosity under a first order of external applied constraints coupling, a reference Na-rich montmorillonite specimen is used as a starting material, and three exchangeable heavy metal cations (Ba2+, Cu2+, and Co2+) have been selected. The applied constraint coupling is realized at laboratory scale and assured by simultaneously varying of the soil solution pH and the thermal gradient. The evaluation of the mineral fraction response is established by correlation of quantitative XRD analysis results, thermal analysis, and porosity measurements. The quantitative XRD analysis allows rebuilding of the theoretical model describing the interlamellar space (IS) configurations/damages, structural heterogeneity degrees, and hydrous stability. Obtained results show a dominant interstratified hydration character, for all studied complexes, attributed to a new IS organization versus the applied constraint strength. Furthermore, all samples exhibit a heterogeneous hydration behavior traduced by the coexistence of different layers of type population within the crystallite. Additionally, the theoretical XRD profile decomposition allowed us to prove link between the domination of the segregated stacking layers mode against the constraint strength. Thermal analysis allowed us to develop theoretical models describing the decrease of the water molecule amounts as a function of the increase in temperature and soil solution pH. Moreover, a specific hydration footprint response and an interstratification mapping are assigned for each corresponding stress degrees. The evolution of montmorillonite porosity is determined by adsorption measurement, based on Brunauer, Emmett, and Teller (BET) and Barrett-Joyner-Halenda (BJH) pore size distribution analyses which confirms for all samples, the exfoliation process, and the mesopore diameter rise by increasing the constraint intensity.
1. Introduction
Montmorillonite is a 2 : 1 phyllosilicate type belonging to the smectite family. The montmorillonite structure consists of a stack of an octahedral (O) sheet (MO4 (OH)2) where (M) can be (Al) or (Mg) ions sandwiched between two tetrahedral (T) sheets (SiO4). This structure is labeled by T-O-T, and the associated layer thickness along the
Montmorillonite is widely exploited (in adsorption science) for neutralizing the soil heavy metal dispersion/diffusion [50–52]. The adsorption factor usually depends on the solid/liquid ratio parameters in such kind of application. Usman et al. (2004) [53] demonstrate that low doses of clay (about 4% to 8%) eliminate up to 70% of heavy metals. In addition, the increase in the dose of the clay fraction is accompanied by the increase in the rate of adsorption [54, 55]. Also, the required dose and the remediation force may be affected by the variation in the mineral structural composition [56]. In the other hand, clay plays an essential role in the basic design of deep storage sites for radioactive and industrial waste confinement process [57–60]. The architecture of the sites is achieved by the association of several types of barriers (multibarrier concept). It consists of filler which is the waste in metal packages, incubated by a thick of concrete layer, covered by a clay films buried in well-determined host rock, at a depth of about 500 m below sea level. Several reasons, like the high radioactive element’s adsorption capacity and the low permeability which slows down the radionuclides migration in the host rock, detailed in the work of [61–66] are in favor of the use of clay as a geological coating.
The clay adsorption capacity and the clay permeability properties are very sensitive to the variation of the soil solution pH [67–72], the surrounding temperature gradient [56, 67, 68, 72, 73], the kinetic effect during the cation exchange process [74], the surrounding atmospheric pressure variation [75, 76], the surrounding relative humidity (RH) constraint [77–81], the solid-liquid ratio effect during heavy metal removal [41], and the type and nature of the compensating cations [82–85]. Several works [67–72] show that there is a linearly proportional relationship between the pH level fluctuation and the performance of the heavy metal absorber (clay fraction). Es-Sahbany et al. (2019) [72] show that at room temperature, an optimal value of heavy metal adsorption rate was obtained; although at slightly lower or higher temperatures, this result may still be more ideal. Chantawon et al. (2003) [86] and Usman et al. (2004) [53] demonstrate good adsorption results at relatively high temperatures of around 36°C unlike some researchers [87] that observed a decrease in the adsorption rate at temperatures above 30°C. Other authors [88, 89] have proven that chemical adsorption reactions are essentially faster for temperatures that gradually increase with continuous increases in temperature.
On the other hand, the experimental approach in the study of the interaction (adsorption, cationic exchange and intercalation) of montmorillonite with heavy metals (and even organic molecules) by XRD analysis has been confirmed by theoretical calculations. Zhang et al. (2018) [90] studied the uranyl ion complexation on montmorillonite edges using a combined first-principle molecular dynamics and surface complexation modeling approach. Obtained results in the case of four selected representative complexing sites show that uranyl ions form hydrolyzed bidentate complexes on these sites. Liu et al. (2021) [91] used the molecular dynamic simulations to explain the sorption behaviors of heavy metal ions (zinc, cadmium, and lead) in the interlayer and nanopore of Wyoming montmorillonite. The calculated diffusion coefficients of the selected three cations in interlayer and nanopore indicated that their diffusion abilities were significantly impaired, implying that montmorillonite adsorbents have a strong ability to fix and retard heavy metal ions. Zhang et al. (2022) [92] investigates by the molecular dynamic simulations of the exchange behavior of radionuclides into montmorillonite. Authors demonstrate that multivalent cations prefer to stay in the mid-plane of interlayer region, and Cs+ and Rb+ cations are located closer to the basal plane via inner-sphere complexation. Furthermore, the orientations of interlayer uranyl ions are nearly perpendicular to basal surface. Density functional theory (DFT) is used to validate XRD data in the case of hydrated Na-hectorite exchanged with Cs-, Ca-, and Sr-cations [93]. Also, the first-principle DFT provides a prediction of the structure, stability, and dynamic properties of organoclays based on montmorillonite (Mt) intercalated with two types of organic cations—tetrabutylammonium (TBA) and tetrabutylphosphonium (TBP) [94]. The Cs adsorption on montmorillonite clay is investigated by 133Cs chemical shift calculations, 133Cs magic-angle-spinning nuclear magnetic resonance (MAS NMR) spectroscopy, X-ray diffraction under controlled relative humidity, and DFT calculations [95]. Obtained results shows that all Cs atoms were positioned around the center of hexagonal cavities in the upper or lower tetrahedral sheets. The calculated 133Cs chemical shifts were highly sensitive to the tetrahedral Al (AlT)-Cs distance and d-spacing, rather than to the Cs coordination number.
Work on the linkage of constraints has not been adequately addressed in the literature. Indeed, Meftah et al. (2010) [84] showed that for a well-determined pH value and at a precise temperature clay can permanently change its structure. Thus, Marty et al. (2020) [85] explained that the coupling between the chemistry and hydration of clays shows a specific behavior for most water molecules considering RH and interlamellar space composition. The constraint coupling affecting, respectively, the clay hydration behavior, the absorber performance, and the ion exchanger efficiency is timidly approached during the main works carried out in the last decade focusing the use of clay in the context of multibarrier [41, 79, 96]. Several works [41, 79, 96] have concentrated on the effect of individual parameter and neglecting the coupling and the interaction between existing/surrounding parameters which generally affect the functionality of the material. Very few works are based on this very realist approach [12, 71]. To take full advantage of the huge possibilities of use of these minerals, it is necessary to simulate, at the laboratory scale, what happens during the real use. This approach is realized by respecting a scientific methodology based on five steps. The first is to decipher the nature and intensity of the constraints affecting the mineral (in question), and secondly, to determine the order of the possible couplings constraints and their nature (e.g., first coupling order: coupling of two constraints (e.g.,
Essentially, this work focuses the structural alteration, hydration stability, and evolution of montmorillonite porosity by (T-pH) in the case of Na-rich montmorillonite exchanged with heavy metals M2+. This necessarily requires the realization/validation at the laboratory scale of an experimental first-order coupling which consists of the variations of geochemical and thermal stresses strength simultaneously. The structural evaluation is realized by a specific quantitative XRD analysis based on the modeling of the 001 reflections. Thermal analysis is used to develop the model describing interlamellar water molecule amount evolution versus constraint strength. The adsorption specificities and the porosity growth are investigated by BET and BJH pore size distribution analyses.
2. Materials and Methods
2.1. Baseline Material
A standard dioctahedral smectite SWy-2 extracted from the cretaceous formations of Wyoming (USA) and provided by the clay mineral repository is selected for the present study [1]. The structural formula per half-cell is given by [43]:
This bentonite exhibits a low octahedral charge and extremely limited tetrahedral Substitutions. The clay cation exchange capacity (CEC) is 101 meq/100 g [43].
2.2. Pretreatment
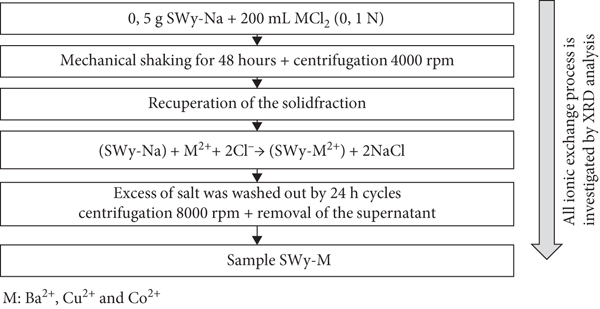
A pretreatment of the starting material consists of preparing Na-rich montmorillonite suspension (SWy-Na) is realized following a classic protocol detailed by [41] as shown in Figure 1.

Experimental protocol for the purification of the starting material. Excess of salt was washed out by 24 h cycles:
2.3. Exchangeable Cations
Three heavy metal cations (Ba2+, Cu2+, and Co2+) were the subject of the cation exchange process. The cation preference is explained by the wonderful abundance of the latter in industrial and radioactive waste and the specific characteristics of each one [97].
2.4. First-Order Coupling Constraints
First-order stress coupling is based on the association of geochemical (soil solution pH) and the thermal gradients (obtained by varying

Experimental assembly of the 1st order coupling.
Soil solution pH and temperatures of the coupling of the 1st order of the stresses.
2.5. Cation Exchange Process
A cation exchange process is carried out for each bivalent metal cations Ba2+, Cu2+, and Co2+ brought into contact with the starting sample. The experimental protocol established for each sample consists of applying a mechanical shake throughout 48 h, followed by centrifugation at 4000 rpm. This step is repeated five times to ensure process achievement. After recovery of the solid fraction, a series of washes with distilled water will take place to remove excess of salt from chloride ions. The obtained sample is labeled SWy-M with
Experimental cation exchange protocol.
To be able to analyze the complexes obtained using XRD, oriented sample was prepared by placing the obtained suspensions on a glass slide at air dry for 24 h.
2.6. X-Ray Diffraction (XRD)
Structural characterization is carried out using XRD analysis by a Bruker D8 ADVANCE (Bruker AXS GmbH, Karlsruhe, Germany) with CuKα monochromatic radiation (
2.6.1. Semiquantitative XRD Analysis
The semiquantitative XRD investigation is carried out by determining, respectively, the observed homogeneity structure based on the 001 reflections shape, the experimental
2.6.2. XRD Profile Modeling: Theoretical Diffracted Intensity and Modeing Strategy
The modeling XRD approach is based on a matrix mathematical formalism developed by [42]. The expression of the intensity of the diffracted waves along the
The modeling approach allowed us to identify the abundance of different layer types abundances (
The modeling strategy consists of the theoretical reproduce of the experimental XRD profile initially from a homogeneous structure subsequently improved by adding other supplementary contributions. The existence of two mixed-layer structures (MLS) does not reflect the presence of two populations of particles physically present in the sample [48, 79, 101]. Therefore, layers with the same hydration state present in different MLS contributing to the diffracted intensity are assumed to have identical properties (chemical composition, layer thickness, and
The
2.6.3. Modeling Strategy
The search for optimal structural parameters passes necessary through the determination of the shape function called “modulation function.” It is related to the positions of the characteristic XRD reflections, by making the variations of the following parameters: (i) the
The agreement between theoretical and experimental profile is improved (decrease of

The main input structural parameter for the XRD modeling approach.
2.7. Thermal Analysis: Thermogravimetry/Differential Thermal Analysis (TG/DTA)
The hydration properties are very sensitive to the amount of water molecule which is identified by TG-DTA thermal analyses coupled with the “Labsys TG” model. All TG-DTA records are realized at variable temperatures from 0 to 500°C at a speed of 5°C/min. The used gas stream is argon. Approximately 10 mg of sample was used in platinum pans in each analysis. The determination of nH2O necessarily depends on the results drawn from the TG-DTA curves followed by a theoretical calculation via modeling. After having optimized the theoretical XRD models, a structural formula per half unit cell can be determined by taking into account the weighting of each MLS and then of each layer population and its specific weighting as well as the average number of layers per crystallite (Table 3). Subsequently, the molar mass of the obtained results is calculated. The number of nH2O (abundance) is estimated according to the following parameters: the initial mass
Examples of half-cell structural formulas for raw montmorillonite SWy-2 and exchanged (SWy-2) with sodium and heavy metals at full saturation.
2.8. Adsorption Analysis and Porosity Investigation
This study uses BET analysis in order to gain insight in particular surface area (SA) estimation in the case of porous materials, yielding knowledge in the effects of porosity fate and particle size evolution versus constraint strength [41, 105, 106]. This goal is achieved by multilayer nitrogen adsorption isotherm variation (performed at 77 K) versus relative pressure (
3. Results and Discussion
3.1. Semiquantitative XRD Investigation of the Baseline Samples
The experimental XRD profile of the starting SWy-Na complex (Figure 5) shows three characteristic reflections (

Best agreement between theoretical and experimental XRD profiles obtained in the case of SWy-Na.
Notes: 2θ°: Bragg’s angle;
Notes:
3.2. Modeling of XRD Profiles in the Case of SWy-Na Sample
The mixed layer structure (MLS) used to achieve the best agreement between the experimental and calculated XRD model (Figure 5) shows an heterogeneous hydration character that results in the coexistence of two types of layers (0 W and 1 W) with a strong dominance for the 1 W phase at about 80%. This opposes the obtained qualitative description.
Indeed, the distribution of IS water molecules has respected the previous work [5, 6, 48, 88, 101] with a water sheet located in the middle of the IS for 1 W phase and the absence of water in the IS for the dehydrated state 0 W. Regardless of the type of hydration state, the exchangeable cations Na (per half-cell unit) are positioned in the center of the IS along the
3.3. Semiquantitative Description of XRD Analysis after Applying First-Order Coupling Stress
3.3.1. Case of the SWy-Co Sample
The experimental XRD results for the SWy-Co samples obtained are shown in Figure 6. For the first three constraint coupling levels (

Best agreement between theoretical and experimental XRD profiles obtained in the case of SWy-Co.
Qualitative XRD investigation in the case of the samples SWy-Co SWy-Cu and SWy-Ba.
Notes:
In Table 6, for the rest of the samples, a different hydration behavior was observed. The diffracted intensity ratio
3.3.2. Case of the SWy-Cu Sample
The experimental XRD models, in the case of SWy-Cu, obtained by varying the external constraint strength are summarized in Figure 7. For the first two constraints of the coupling value (

Best agreement between theoretical and experimental XRD profiles obtained in the case of SWy-Cu.
3.3.3. Case of the SWy-Ba Sample
The experimental XRD profiles of SWy-Ba sample are reported in Figure 8. An intense 001 reflection situated at 7.2° (2θ) (
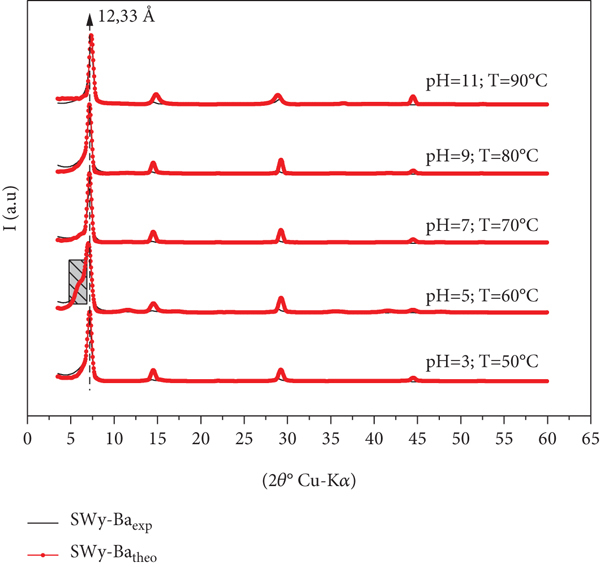
Best agreement between theoretical and experimental XRD profiles obtained in the case of SWy-Ba.
For
3.4. XRD Modeling Profiles after Applying First-Order Coupling Stress
3.4.1. Case of the SWy-Co Samples
The qualitative XRD analysis suggested heterogeneous hydration behavior for SWy-Co samples, regardless of the strength of the stresses applied. This interstratification has been approved by the 001 reflection modeling approach which assumes the coexistence of two different hydration states (e.g., 1 W and 2 W). To improve the agreement between the calculated and experimental models (Figure 6) and for each constraint strength from
Structural parameters of SWy-Co, SWy-Cu, and SWy-Ba.
Notes: xW-echa.cat: layer type and associated exchangeable cation;
The theoretical decomposition of the SWy-Co sample, (
The 1st consists in considering that it is still a T-O-T type structure despite the absence of the main 001 reflection which must be positioned around 6.1° (2θ) (
The 2nd considers that the basic clay structure has been strictly modified following the coupled increase in temperature
3.4.2. Case of the SWy-Cu Samples
The best agreement between theoretical and experimental XRD patterns (Figure 7) of the SWy-Cu samples is obtained using an interstratified structure of two MLS comprising various relative layers proportions with different hydration states (Table 7). This variability confirms the heterogeneous hydration character and the intermediate 1 W-2 W hydration phase observed regardless of the intensity of the applied constraints. In detail, a minor contribution of the 2 W phase increases from 5% to 30% by increasing the intensity of the external applied stress (
The agreements obtained between the experimental and theoretical profiles (
The logical increase of the
3.4.3. Case of the SWy-Ba Samples
For SWy-Ba samples, the best agreements between theoretical and experimental models are shown in Figure 8. The main structural parameters used to achieve a good fit are summarized in Table 7. For each model, several types of layers with variable stacking mode are used to improve the agreement obtained between the experimental and calculated models. This MLS is composed by several layers of type populations depending on the hydration state (0 W, 1 W, and 2 W) whose basal distance
3.5. Evolution of the Water Molecule Abundances versus Coupling Constraint Strength
3.5.1. Evolution of the nH2O Amounts versus Constraint Strength
The delicate theoretical determination of nH2O amounts for each studied sample is deduced from the results of thermogravimetry/differential thermal analysis (TG/DTA) (Figure S1) and summarized in Table 8.
Results from TG/DTA analyses in the case of samples SWy-Co, SWy-Cu, and SWy-Ba.
Notes:
Regardless of the sample type, the hydration state is governed by the cationic nature, the layer charge value, and the layer charge location [5–7, 107, 108, 120–122]. All samples studied belongs to the Wyoming montmorillonite specimen characterized by the same layer charge and the charge location value. The nature of the exchangeable cations and the external stresses applied to the cation exchange process (first-order coupling constraint) is at the origin of these specific water molecule amounts fluctuations. The water affinity of the exchangeable cation is related to the ionic potential which is defined by the ratio of the valence of the cation to its ionic radius [110] (Table 9). As this potential increases, the cation’s affinity for water also increases. Indeed, bivalent cations such as cobalt (Co2+), copper (Cu2+), and barium (Ba2+) have a high affinity of water translated by a 2 W hydration state [6, 7]. Unlike monovalent cations like sodium (Na+), having a low affinity for water mainly generates monohydrated states 1 W.
Radius and ionic potential of some cations [110].
Based on the quantitative XRD analysis, a discretization of the content of the IS is carried out. Indeed, the evolution of nH2O molecules per half-cell, relative to the constraint strength, is described by Table 10 and represented in Figure 9. For all series, a decrease in the water molecules amounts as a function of the increase in temperature and soil solution pH.
Evolution of the nH2O amounts versus constraint strength for samples SWy-Co, SWy-Cu, and SWy-Ba.
Notes: phases: modeling phase of each sample; Ø: absence of phases;

nH2O abundance fluctuation as a function of stress strength for SWy-Co, SWy-Cu, and SWy-Ba samples (black scatter). Red scatter: the used linear and Lorentz fit function, respectively.
In the case of SWy-Co sample (Figure 9), there is an overall linear decrease in the number of water molecules as a function of the increase applied stresses intensity (
In the case of SWy-Cu and SWy-Ba samples (Figure 9), there is a nonlinear water molecule amount decrease unlike SWy-Co as a function of the increase in external stresses applied. So, a regression approach based on the Lorentz equation was adopted to fit this evolution. This variation is described by function below:
This decrease trends on the water molecule amount (nH2O) versus constraint strength are predictable when increasing temperature which automatically affects the IS closing and subsequently, it affects the cation exchange capacity of the mineral.
3.5.2. Individual Evolution of the 0 W, 1 W, and 2 W Abundances versus Constraint Strength
The “water footprint” schematized on Figure S2 shows the coexistence within the particle of several phases with different weights. The variation of the cation exchange process makes it possible to better understand the structural response of the starting material (such as fluctuations in basal distance
For SWy-Co samples, a decrease in the 1 W monohydrate state, accompanied by an increase in fluctuation for the 2 W hydration state, represents the main hydration behavior. This can be interpreted by an easy intercalation of the compensating cations (Co2+) in IS more and more, replacing the sodium cations (Na+) that will leave the structure partially according to the applied stress variation. This hypothesis is confirmed by the global incomplete exchange process despite the exchange equilibrium time provided and remains to be noted that abundances in the aqueous phase are normalized to 100%. For SWy-Cu samples, the same behavior of the previous sample (SWy-Co) is observed. A slight fluctuation for the 1 W hydration state followed by a slow increase of 2 W is noted. For the latest SWy-Ba samples, the water behavior is almost different. There is a slow decrease in the 1 W state. This fluctuation is accompanied by a slight increase of 2 W phases. This is not valid for the complex
3.6. Evolution of the Average Number of Layers versus Constraint Strength
The average number of layers (

Average number of layers
The SWy-Ba sample is the exception and exhibits growth of
The evolution of
All functions parameters are summarized in Figure 10.
3.7. Evolution of the Layer Stacking Modes
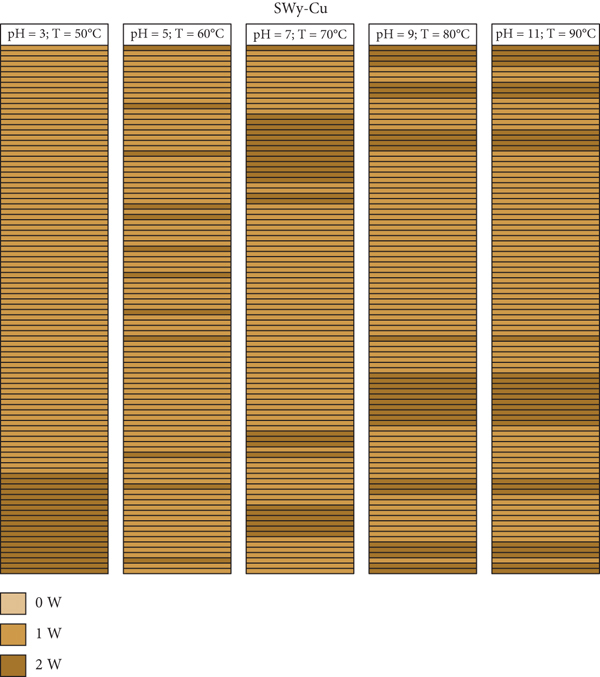
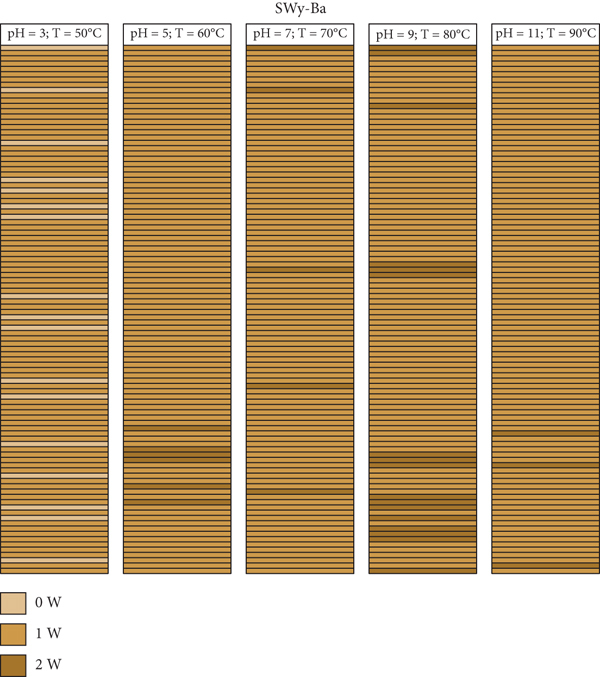
A mapping representation of the hydration state in the case of SWy-Co, SWy-Cu, and SWy-Ba samples via XRD modeling profile approach is summarized in Figure 11. The light brown, caramel, and dark brown colors represent the 0 W, 1 W, and 2 W layer type, respectively. Each line thus represents a layer with its intrinsic hydration state. The configuration considered here is an optimal configuration (best agreement obtained) extracted from the best agreements obtained between theoretical and experimental XRD profile. For SWy-Co complexes, the correlation between partial and total segregation stacking is observed. Thus, for SWy-Cu samples, we notice that the total segregation aspect is present regardless of the applied constraint applied. On the other hand, the SWy-Ba series shows the existence of two modes of stacking, segregation accompanied by partial order, with blatant dominance for segregated stacking.
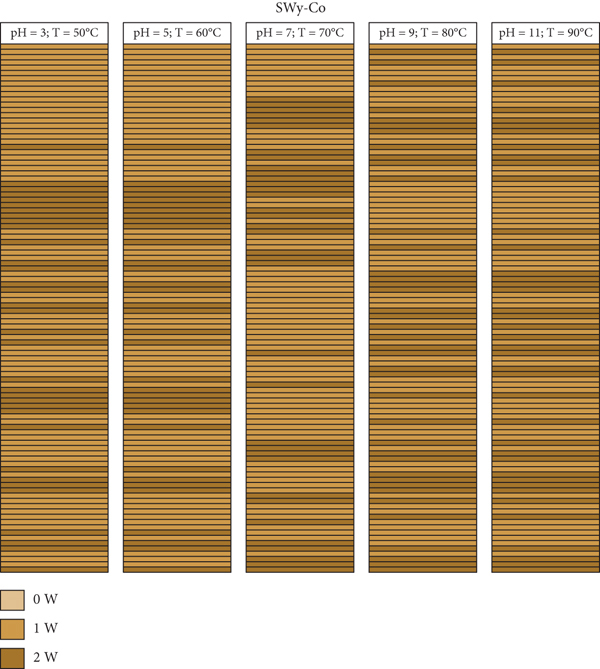
Mapping representation of the hydration state in the case of SWy-Co (a), SWy-Cu (b), and SWy-Ba (c) samples via XRD modeling approach.
3.8. BET and BJH Pore Size Distribution Analysis
The exploitation of the results obtained from the structural analysis by XRD modeling approach demonstrates a variability, in term of population, within the same crystallite. This directly influences the internal and external layers surfaces, which subsequently affects the adsorption properties and the sample porosity. Our objective is to evaluate the effect of the applied coupling disturbance (pH and

SABET single and multipoint BET evolution versus constraint strength for (a) SWy-Co, (b) SWy-Cu, and (c) SWy-Ba samples.


BJH method average pore diameter evolution versus constraint strength.
The average pore diameter evolution versus constraint strength (Figure 13) can provide a preliminary explanation for the observed SA fluctuations.
For all samples, the limit of mesoporosity domain is respected (where pores whose maximum diameter is between 2 and 50 nm). Indeed, the SWy-Ba sample practically keeps the same average pore diameters values up to
Obtained nitrogen adsorption (ADS)-desorption (DES) isotherms curves shape (Figure 14) shows a very closer type II isotherm classification [127–131]. This allocation confirms the supremacy of the mesoporous texture despite the fluctuations observed and the nature of the exchangeable cation. The relative large pore size obtained in the case of stressed SWy-Ba sample is explained by the coupling of three essential parameters, respectively, the acidic or basic nature of the soil solution, the intrinsic hydration property, and the nature of the exchangeable cation. The Ba2+ ions exchange promotes the exfoliation process and thereafter increases the porosity degree.
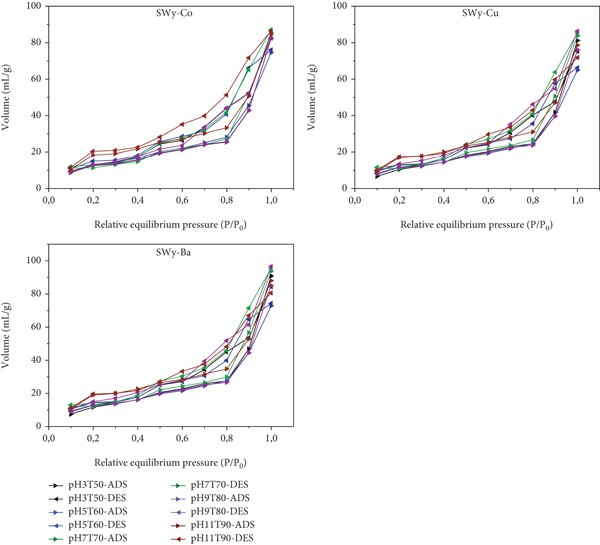
Nitrogen adsorption (ads)-desorption (des)-isotherms in the case of SWy-Co, SWy-Cu, and SWy-Ba.
To overcome the limits of SA analysis (i.e., nitrogen can only cover external surfaces and does not interact with internal surfaces), since it cannot access the information in the volume of the sample and subsequently, it does not provide information on the IS configurations/changes, a pore size distribution (PSD) analysis imposes itself. The application of PSD analysis requires technical approaches such as (i) the volumes of micropores, mesopores, and macropores including nanopores in one gram solid labeled, respectively,
The PSD plots provide information on the variation of the cumulative pore volume versus pore radius (

The pore size distribution (PSD) curve for the different studied samples (
The derivative pore size distribution curve (Figure 16) confirms the prevailing mesoporosity with a pore diameter concentration varying between 2.20 and 9.89 nm. A concentration of large pore populations related to the saturated Co2+ sample (at

The derivative pore size distribution curve.
4. Conclusion
This work studied the Wyoming montmorillonite response to a first-order coupling constraint obtained at the laboratory scale by combining soil solution pH variation with temperature gradient. The eventual mineral response to such disturbance was approached from a structural, hydrological (IS perturbation), cation exchange (CEC), and porosity point of view.
The quantitative investigation of the 001 reflections obtained from the XRD patterns via the modeling approach makes it possible to develop a deep theoretical calculation which allows us to build a global idea about the mechanisms accompanying these changes. Indeed, IS configuration and evolution are decrypted according to the applied constraint. Several parameters like nature, abundance, relative probability, size, position, arrangement of atoms/ions in the IS, the quantity of nH2O, the average number of sheets, and the stacking modes in crystallites are precisely identified.
These goals are achieved by combining results from XRD profile modeling approach, TG/DTA analysis, and the adsorption measurement outcomes.
The starting SWy-Na complexes studied at room condition exhibit a heterogeneous hydration state characterized by a mixture between 0 W and 1 W phases contrary to the qualitative analysis which shows a homogeneous character. A correlation between XRD profile modeling approach consolidated by TG/DTA analysis and the adsorption measurement outcomes shows the following:
The case of the Co2+ cation is as follows:
Heterogeneous hydration behavior induced by the coexistence of two type of layer populations (i.e., 1 W and 2 W phases within the crystallite), whatever the stress force The theoretical decomposition of the experimental XRD profiles allowed us to identify all the different populations of existing layers and their stacking mode A dominance of the segregated layer stacking mode The CEC increases simultaneously with the applied stress intensity increases A linear regression approach describes the water molecule amount decrease, determined from TG/DTA analysis, as the temperature increases The total structure change may appear ( The BJH method shows an increase on the porosity rate traduced by an evolution divergence appearing with a “gap” in favor of high pH and
The case of the Cu2+ cation is as follows:
An interstratification explains the coexistence of two hydration states (1 W and 2 W) regardless of the stress strength The coexistence within the crystallite of different types of layer populations stacked according to a specific set of junction probabilities “Total segregation” stacking mode dominated the entire series CEC growth by increasing the applied stress A nonlinear water molecules amount decrease unlike SWy-Co sample as a function of the increase in external applied stresses (from TG/DTA analysis) is fitted with a regression approach based on the Lorentz model Adsorption outcomes demonstrate that the sample seems undamaged by the applied stress intensity fluctuations
The case of the Ba2+ cation is as follows:
A heterogeneous hydration state proven by the presence of several layers 0 W, 1 W, and 2 W, regardless of the applied stress The coexistence of several types of compensating cation (Ba2+ and Na+) indicating the formation of a real physical mixture between populations of different layer types Partial CEC saturation and domination of segregated layer stacking aspect Results from TG/DTA analysis show a nonlinear evolution governed by a Lorentz function which lies between the observed evolution in the case of Co2+ and Cu2+ cations The intrinsic sample porosity is affected by the acid-base transformation with a 0.015 mL/g “gap.” The maximum cumulative pore volume is 0.062 mL/g attained at
In addition, the XRD modeling approach allowed us to assign a structural response of the water footprint of the samples and to map the interstratification of the different layer type populations.
The presence of each cation induces specific structural characteristics and a variable exchanged sample response to external excitation. The observed structural transition, for the Co2+ cation from a
The evolution of the average number of layers (
Footnotes
Data Availability
No data were used to support this study.
Disclosure
The results presented are a part of the Ph.D. thesis of Chadha MEJRI (CM) realized at LR19ES20: Resources, Materials, and Ecosystems (RME), Faculty of Sciences of Bizerte, University of Carthage, 7021 Zarzouna, Tunisia, and supervised by Dr. Walid Oueslati (WO).
Conflicts of Interest
The authors declare no conflict of interest.
Authors’ Contributions
Ph.D. Chadha MEJRI (CM) realized the experimental part, XRD profile modeling approach, and the draft paper writing. Dr. Walid Oueslati (WO) supervised the study, contributed to the experimental result acquisition and XRD profile modeling approach, realized the adsorption measurement, directed the (BJH) pore size distribution analyses, and contributed on the writing of the paper draft and the proof reading/revision of the manuscript.
Acknowledgments
CM acknowledges WO for the original idea of the work, the fruitful discussions about the XRD modeling approach, and the montmorillonite hydration behavior.