
Abstract
In order to deal with the increasingly serious pollution of graphene oxide (GO) to the environment. In this paper, the use of red sandstone to treat GO-contaminated aqueous solution is proposed for the first time, and the adsorption capacity and adsorption mechanism of red sandstone to GO are discussed. The controlled variable method was used to explore the optimal pH, concentration, and quality of red sandstone for GO aqueous solution. The adsorption isotherm, thermodynamics, and adsorption kinetics were fitted. Adsorption characterization tests were performed using XRD, AFM, XPS, FT-IR, SAP, TEM, SAP, laser particle size analyzer, and SEM. The results show that when
1. Introduction
Due to the large specific surface area (2630 m2·g-1), more oxygen-containing functional groups (hydroxyl, carboxyl, epoxy groups, etc.), and excellent water dispersibility and solubility (the GO solubility in water is 0.712 g·L-2), graphene oxide (GO) is often used to adsorb organic pollutants and inorganic pollutants such as metal ions [1, 2] or load other excellent adsorption materials such as SBA-15, MCM-41, and MCM-48, for the treatment of pollutants or the extraction of substances in aqueous solutions [3–6]. Alternatively, graphene oxide layer photocatalysts were used for visible light degradation of chloramphenicol (CMP) [7]. Some scholars have also loaded GO on CuO as a fuel additive to improve the physical and chemical properties of diesel [8], although GO has many nice features. However, some scholars have found that GO has certain harm to the ecological environment [9–12], and its main ecological harm is mainly reflected in the following two aspects: (1) mechanical damage: due to the layered structure of GO, its edge is relatively sharp, which may damage the cell membrane and cell wall after entering cell [13]; (2) oxidative stress: after GO enters cells, due to its strong oxidative ability, oxidative stress will occur in cells, resulting in cellular lipid peroxidation and DNA damage [14]. In view of the certain ecological hazards of GO, how to deal with GO has become a hot research issue once it is leaked during transportation. Adsorption using adsorbents is an efficient, environmentally friendly, and relatively inexpensive method. Many scholars are trying to find low-cost, high-efficiency, and environmentally friendly materials. Shi et al. studied the migration behavior of GO in aqueous solution and compared the adsorption capacity of GO by different cations and different kinds of clay minerals. The results showed that the adsorption of GO by different ions was related to water and radius of ions, and the hydroxyl and metal-oxygen bonds of clay minerals can interact with GO. Different types of clay minerals have different cohesive capacities for GO due to their different electrical properties in aqueous solutions, and their adsorption capacities are as follows:
Red sandstone is a widespread rock that has been used as a building material since ancient times due to its bright colors [21]. Red sandstone is composed of feldspar, quartz, and clasts with a porous structure [22]. Many scholars have studied the properties of red sandstone [23–26] mostly on its mechanical and physical properties, but there are few studies on its adsorption properties. The natural porous structure of red sandstone has good adsorption properties. Chen et al. studied the kinetic characteristics of arsenic (V) adsorption on red soil after sandstone weathering. The results showed that chemical adsorption was the main adsorption process, and the adsorption effect was the best when
In summary, although some scholars have studied the adsorption of heavy metal ions on red sandstone, few people have paid attention to the adsorption of GO on red sandstone. As a relatively cheap and easily available adsorbent, red sandstone has many characteristics of a good adsorbent, such as high adsorption capacity, large specific surface area, and large volume [29]. It has broad application prospects in adsorption. Therefore, red sandstone was designed as adsorbent to remove GO in aqueous solution, and the adsorption effect of different pH, temperature, GO concentration, adsorbent mass, and different time was studied. At the same time, laser particle size analyzer (Mastersizer3000) X-ray diffractometer (XRD), Fourier Transform Infrared Spectroscopy (FTIR), scanning electron microscopy (SEM), Atomic Force Microscopy (AFM), high-resolution transmission electron microscopy (TEM), and X-ray photoelectron spectroscopy (XPS) were used to analyze the microstructure and characterization of the adsorbed samples and reveal its adsorption mechanism.
2. Test Materials and Methods
2.1. Materials
The red sandstone used in the experiment was collected from Yueyang City, Hunan Province, China. It is brownish red with fine-grained structure and uniform texture. The main components are quartz, clasts, and feldspar. The cementation composition is mainly iron, which is a hard brittle sedimentary rock. Figure 1(a) shows the crushed red sandstone. The proportion of grain size of red sandstone is shown in Figures 1(b) and 1(c). It can be seen from the particle size distribution diagram that the proportion of powdery red sandstone with particle size less than 90 μm is 84.8%, and the particle size of powdery red sandstone is mainly concentrated between 1 μm and 100 μm, and the average particle size is 56.8 μm.

(a) Crushed red sandstone. (b) The proportion of different particle sizes of red sandstone. (c) The proportion of red sandstone smaller than a certain particle size.


The GO aqueous solution is produced by Suzhou Tanfeng Technology Co., Ltd., with a concentration of 2 mg/mL and a specific surface area of 2630m2/g. Its chemical element composition is shown in Table 1.
GO elemental composition of graphene oxide (%).
2.2. Test Section
2.2.1. Test Scheme
Red sandstone powder was taken as adsorbent, and the adsorption rate of GO by red sandstone was investigated by different pH, temperature, GO concentration, and adsorbent mass. The test steps are as follows:
Crush the obtained samples and put them in an oven to continue drying for 24 hours, taking into account the effect of particle size on the adsorption capacity. This paper chose to use a standard sieve with a 0.074 mm aperture to screen fine particles (Figure 1). It is used to reduce the effect of particle size on adsorption [30].
When using, first sonicate the GO aqueous solution with an ultrasonic device for 30 minutes, so that it can be uniformly dispersed in the aqueous solution. Then, different volumes of GO solution and deionized water were taken with a pipette and placed in a volumetric flask, so that the total volume of GO and deionized water was 50 mL. Sodium hydroxide solution and nitric acid solution with negligible volumes were added to adjust to different pH, and then, red sandstone powder with different mass was added.
Oscillation mixing. The above-prepared solution was poured into a volumetric flask and then put into a shaker at different temperatures. After shaking for 3 h at 240 rpm, the volumetric flask was taken out and put into a constant temperature curing box to stand for 24 h at different temperatures.
Absorbance test. 1 mL of the middle-layer clear liquid after adsorption was put into a test tube, and then 24 mL of deionized water was added to make a 25 mL solution. After standing for 10 min, the absorbance was measured by an ultraviolet spectrometer (incident wavelength
where
2.2.2. Microscopic Characterization
Constant temperature shaker (THZ-100B), UV/Vis spectrophotometer (UV75N), pH meter (FE28), electronic analytical balance (FA324C), X-ray diffractometer (XRD, Empyrean), Fourier transform infrared spectrometer (FTIR, NEXUS), scanning electron microscope (SEM, JSM-6360LV), atomic force microscope (AFM, SPA400), high-resolution transmission electron microscope (TEM, JEM-2100F), X-ray photoelectron spectroscopy (XPS, Thermo ESCALAB 250XI), a specific surface area analyzer (Tristar 3020II), and a laser particle sizer (Mastersizer 3000) were used to analyze the microscopic and characterization of the adsorbed precipitate samples.
3. Results and Analysis
3.1. Morphology Analysis
3.1.1. XRD
XRD can analyze the crystal structure and material composition of red sandstone and GO as well as the adsorbed products [33]. Cu target Kα was used as the radiation power source to characterize GO, red sandstone, and GO/red sandstone derivatives by XRD, as shown in Figure 2. PDF cards refer to the ICSD standard. The characteristic peaks before and after adsorption are compared. There is an obvious (001) characteristic peak at 10.08° in the GO spectrum. In the XRD pattern of red sandstone, 20.84° and 26.26° can be marked as SiO2 (046), 27.88° can be marked as (Na,Ca)Al(Si,Al)3O8 (041), and 29.44° can be marked as CaCO3 (005) [34]. In the diffraction pattern of GO/red sandstone, the peak intensity of CaCO3 (005) decreases from 18090.5 cm-1 to 8169.5 cm-1, and that of (Na,Ca)Al(Si,Al)3O8(041) also decreases from 18801.1 cm-1 to 11042.4 cm-1, compared with that of red sandstone. The diffraction peak of GO disappears, indicating that CaCO3 and (Na,Ca)Al(Si,Al)3O8 (041) in red sandstone may be involved in the adsorption of GO, rather than the simple stacking of GO on the surface of red sandstone.

XRD image of GO, red sandstone, and GO/red sandstone.
3.1.2. Brunauer-Emmett-Teller (BET) Surface Area Analysis
The specific surface area and pore size are the main factors affecting the adsorption [35], so we measured the specific surface area and pore size of the red sandstone. At the same time, in order to reduce the influence of the adsorbent moisture on the experimental results of the comparative surface area. All samples should be dried at 300°C for 3 hours and vacuumed. In the experiment, high-purity (99.99%) N2 was used as the adsorbate, and the amount of N2 adsorption at different relative pressures was measured in a low-temperature environment. The final measurement results are shown in Table 2: we found that the specific surface area of red sandstone is 10.0729m2/g, which is larger. The average pore volume is 0.019024 cm3/g, and the average pore size is 5.69122 nm. This shows that red sandstone is a natural large specific surface area and an excellent adsorbent.
Red sandstone-specific surface area, pore size, and volume.
3.1.3. SEM and TEM
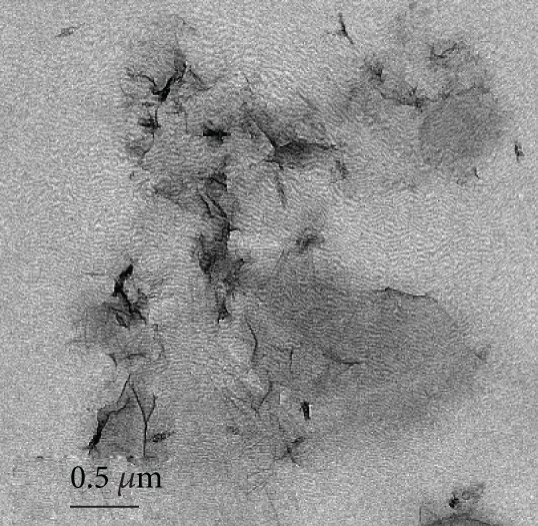
The samples before and after adsorption were observed by scanning electron microscopy (SEM) and high-resolution transmission electron microscopy (TEM), and the obtained microscopic morphologies are shown in Figure 3 [36, 37]. Figures 2(a) and 2(b) are the SEM and TEM pictures of red sandstone, through which the sharp edges and irregular shapes of red sandstone can be clearly seen. Figures 2(c) and 2(d) are the SEM and TEM images of GO, through which we can find the multilayered two-dimensional flake-like structure of GO, with some folds on the edges and smooth in the center [38]. Figures 2(e) and 2(f) are the SEM and TEM morphology of GO/red sandstone after adsorption, and the film-like GO attached to the surface of red sandstone particles can be clearly seen.

(a) SEM and (b) TEM of red sandstone; (c) SEM and (d) TEM of GO; (e) SEM and (f) TEM of GO/red sandstone.


3.1.4. FT-IR
In order to further analyze which chemical bonds in GO are involved in the adsorption, FT-IR was used to analyze the changes of functional groups and the migration and disappearance of chemical bonds of GO, red sandstone, and GO/red sandstone derivatives after adsorption [39], as shown in Figure 4. GO exhibits stretching vibration of the -OH group at 3403 cm-1, stretching vibration of C=O at 1734 cm-1 [40], stretching vibration of C=C on the benzene ring skeleton structure at 1628 cm-1 [41], stretching vibration of C-OH at 1219 cm-1, and vibration peak of C-O at 1049 cm-1 [42]. Red sandstone presents characteristic peaks of CO3-out-of-plane deformation vibration in CaCO3 at 875 cm-1 and 712 cm-1 [43], and symmetrical stretching vibration peak of Si-O bond in SiO2 at 468 cm-1 [44]. The peak of GO/red sandstone weakens at 1628 cm-1, disappears at 1734 cm-1, 1219 cm-1, 1049 cm-1, 875 cm-1, 712 cm-1, and 590 cm-1, and strengthens at 468 cm-1. The disappearance of the peak at 1734 cm-1 may be caused by the combination of Ca2+ in red sandstone and O-C=O bond in GO, resulting in the coagulation of GO [45], which is consistent with the change rule of the peak value of CaCO3 in XRD pattern, indicating that GO has undergone ionic reaction or coordination reaction on the surface of red sandstone [46].
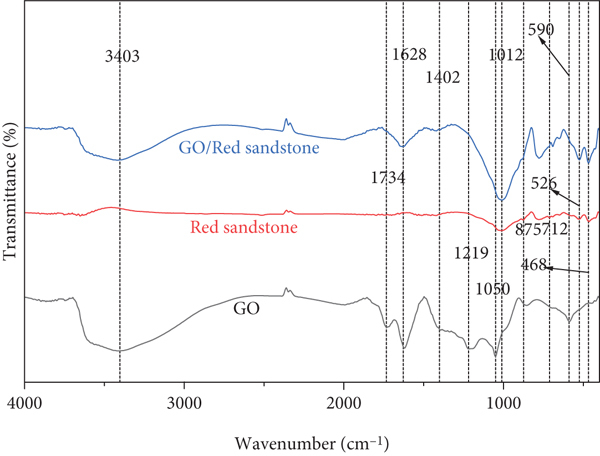
FT-IR analysis of GO, red sandstone, and GO/red sandstone.
3.1.5. XPS and AFM
XPS is an effective characterization method that can qualitatively and quantitatively detect elements. Through the XPS spectra, the position of the characteristic spectral line is used to qualitatively analyze the elemental composition of material; the elemental content is quantitatively analyzed by the intensity of the photoelectron spectral line; the chemical state of each element can be further determined by peak fitting [47]. The characterization results are shown in Figure 5(a). Through the spectra, various strong peaks can be clearly seen, such as O1s, C1s of GO, O1s, C1s, Ca2p, Si2p, and Al2p of red sandstone and GO/red sandstone, which conforms to the results of XRD analysis. The peak of C1s in the spectra of red sandstone is lower (7898.35), and that in the spectra of GO/red sandstone is higher (17768.9), but it is still much lower than that in the spectra of GO (30106.2). Therefore, by performing peak fitting of C1s of GO and GO/red sandstone, the C1s spectra can be deconvolved and integrated into three components at 284.8 eV, 286.2 eV, and 289.0 eV [48]. The fitting results are shown in Figures 5(b) and 5(c). It can be found through fitting that the three convolutions of C1s of GO/red sandstone had obvious changes compared with that of GO. The most obvious changes are the bonds of C-O and O-C=O, which change from 286.2 eV and 289.0 eV to 286.69 eV and 287.02 eV, respectively. The proportion of the peak area of C-O decreases from 43% to 16%, and that of O-C=O increases from 15% to 39%. From the position changes of the three convolutional components of C1s and the proportion change of the peak area before and after adsorption, it can be seen that GO has solidified on the surface of red sandstone [49], which is consistent with the results of FT-IR analysis.

(a) XPS spectra of GO, red sandstone, and GO/red sandstone; (b) C1s XPS spectra of GO; (c) C1s XPS spectra of GO/red sandstone.


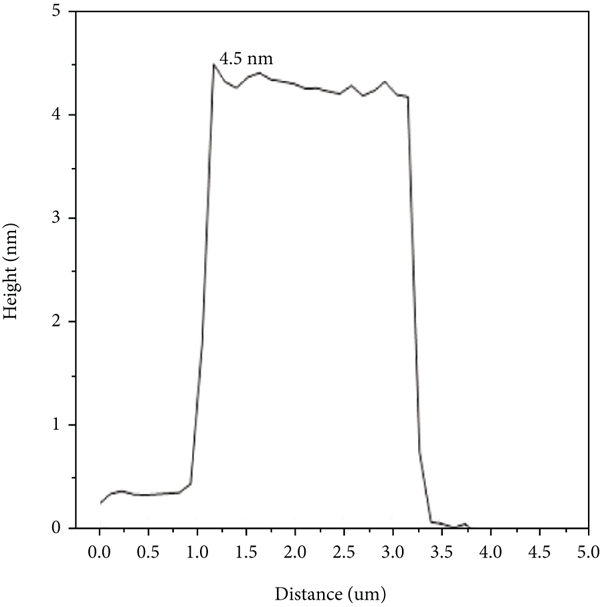
AFM can further explore the height and morphology of GO and GO solidified on the surface of red sandstone [50]. The surface thicknesses of GO and GO/red sandstone were characterized, as shown in Figure 6. It can be seen from Figure 6 that GO exhibits a single-layer or double-layer structure [51], and the maximum thickness is only 2.4 nm as shown in Figures 6(a) and 6(c). For the GO/red sandstone samples, we can clearly see red sandstone particles with a height of 4.5 nm and GO attached to the surface of red sandstone particles, as shown in Figures 6(b) and 6(d), which is consistent with the results measured by SEM and TEM, indicating that GO is adsorbed on the surface of red sandstone, which further indicates that red sandstone can effectively remove GO.

(a) GO AFM; (b) GO/red sandstone AFM; (c) GO height map; (d) GO/red sandstone height map.


3.2. The Effect of Solution pH on Adsorption
pH is an important factor affecting the interaction of substances [52]. Figure 7 shows the effect of different pH on the adsorption performance of GO by red sandstone when the adsorbent mass is 40 mg, the solution concentration is 80 mg/L,

Effect of pH change on the adsorption of GO by red sandstone.
3.3. The Effect of Adsorbent Mass on Adsorption
Figure 8 shows the effect of the red sandstone mass on the adsorption of GO. When GO concentration is 80 mg/L,

The effect of red sandstone mass on the adsorption of GO.
3.4. The Effect of GO Concentration on Adsorption
On the basis of the above experiments, the red sandstone mass was set to 40 mg,
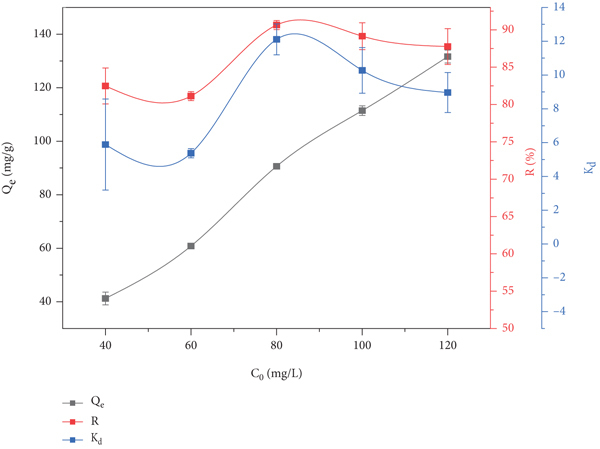
The effect of GO concentration change on the adsorption of GO by red sandstone.
3.5. Adsorption Kinetics and Adsorption Thermodynamics
The above test results show that when
3.5.1. Adsorption Isotherm
In nature, the temperature of an aqueous solution is different at different times. In order to explore the adsorption capacity of GO by red sandstone at different temperatures, when
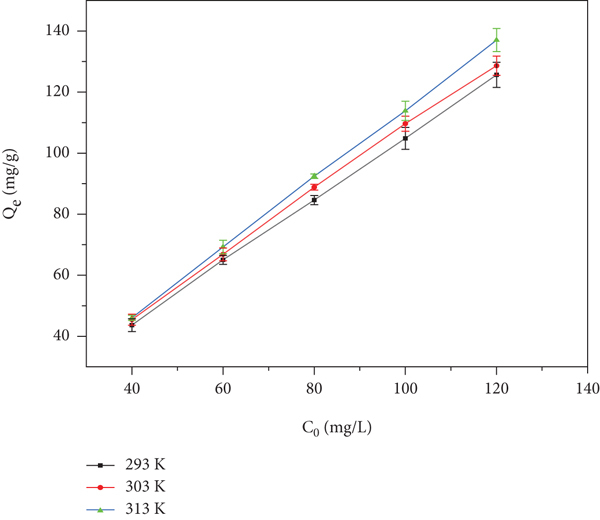
Adsorption isotherm of GO by red sandstone.
In order to further explore the adsorption morphology of GO on the surface of red sandstone, Langmuir and Freundlich adsorption isotherm equations were used to fit the adsorption process, as shown in formulas (4) and (5) [56]. The fitted image is shown in Figure 11, and the fitting results are shown in Table 3. The correlation coefficients

Adsorption isotherm fitting.
Isotherm pseudo parameters.
where
3.5.2. Adsorption Thermodynamics
In order to analyze the effect of temperature change on the adsorption of GO by red sandstone, the experimental results were calculated by fitting the thermodynamic parameters, and the energy changes during the adsorption process were analyzed to determine whether the adsorption was a spontaneous reaction or a nonspontaneous reaction [58].
Thermodynamic parameters such as standard free energy (
Thermodynamic fitting parameter table.
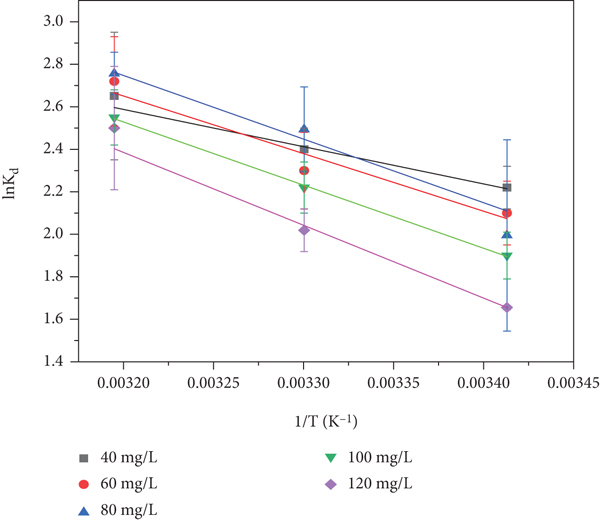
Thermodynamic fitting diagram of GO adsorption by red sandstone.
where
3.5.3. Adsorption Kinetics
The adsorption rate is an important index to evaluate the adsorption performance, which is generally studied by adsorption kinetics. Adsorption kinetics can reveal the diffusion mechanism, adsorption steps, and controlling factors of adsorption [61]. At the same time, it can also reveal the time when the adsorbent reaches the adsorption equilibrium. In order to explore the above factors, the pseudo-first-order kinetic model and pseudo-second-order kinetic model are usually adopted [62], as follows:
where
In order to reduce the change of the solution during the sampling process, thereby increasing the concentration of GO and causing experimental errors, we set up six groups of parallel samples to sequentially extract the solution in each time period. After solution extraction, centrifuge the extracted solution [63]. Figure 13 shows the change of adsorption capacity over time, when GO concentration is 80 mg/L,
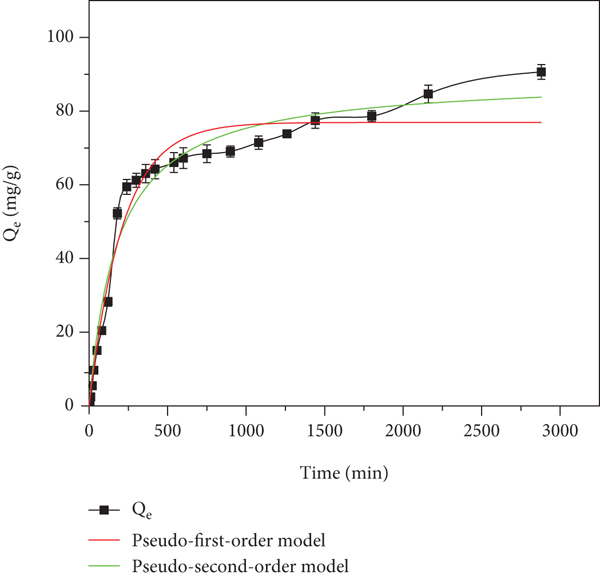
Graph of adsorption capacity over time and fitting curve of the pseudo-first-order model and pseudo-second-order model.
At the same time, the test data were fitted by kinetic formulas (9) and (10). The fitting results are shown in Figure 13 and Table 5. It can be seen from the figure that the equilibrium adsorption capacity fitted by the pseudo-first-order kinetic model is 76.2 mg/g, while that fitted by the pseudo-second-order kinetic model is 89.88 mg/g, which is closer to the actual measured data of 90.03 mg/g. In addition, the correlation coefficients
Kinetic fit data plot.
4. Conclusion
Red sandstone, GO, and GO/red sandstone were characterized by microscopic tests such as SEM, TEM, XPS, FT-IR, AFM, BET, and XRD, and the adsorption isotherm, adsorption thermodynamics, and adsorption kinetic models were combined to systematically reveal the adsorption mechanism of GO by red sandstone. The following main conclusions are drawn:
The experimental results show that the red sandstone has a good adsorption capacity for GO. The adsorption of GO on red sandstone conforms to the Langmuir model and belongs to monolayer adsorption. The adsorption of GO to red sandstone is endothermic, and the amount of adsorption increases with increasing temperature. The adsorption of GO on red sandstone is more in line with the pseudo-second-order kinetic equation, which belongs to chemical adsorption. Kinetic experiments show that the adsorption equilibrium time of red sandstone is 2800 min This study did not discuss the pore size, specific surface area, and polarity of red sandstone for the adsorption capacity of GO. We will continue to explore in the next exploration
The results of this study contribute to a better understanding of the adsorption behavior of GO with natural materials in aqueous environment, which is crucial for handling GO in aqueous solution and reducing the hazard of GO in nature.
Footnotes
Data Availability
The data used to support the findings of this study are available from the corresponding author upon request.
Conflicts of Interest
The authors declare that there is no conflict of interest regarding the publication of this paper.
Acknowledgments
The authors disclosed receipt of the following financial support for the research, authorship, and/or publication of this paper: this research was funded by the National Natural Science Foundation of China (41772311 and 52179107).