
Abstract
Studies have been carried out to investigate the removal of crystal violet (CV) cationic dye by using rice husk which was used as a raw material to prepare activated carbon (AC) and it was treated with anionic surfactant. In this process, AC was treated with three different anionic surfactants, namely, lauryl sulfate ACMAS, ACSDS, and ACHTAB. Characterization and analysis of optimum ACMAS were done using different techniques which were used which proves the adsorption of the dye by ACMAS. Effects of various physical parameters like time of contact, additive salts, initial dye concentration, effect of pH, and effect of adsorbent dose were studied. Minute changes in the dye removal capacity were observed due to the presence of various cations. Cations like NO2- caused an increase in the capacity of adsorption but cations like Fe2+decreased the capacity of adsorption in the sample solution. The effectiveness of film diffusion and intraparticle has been shown by mass transfer parameters. The various kinetic studies have shown that pseudo second-order kinetic study best suited with the experimental data. Error analysis and studies of isotherms have shown that the adsorption equilibrium was controlled by Langmuir isotherm study with maximum CV dye adsorption capacity of 235.7 mg/g. Thermodynamics studies revealed endothermicity of the process with negative
1. Introduction
Dyes are intricate chemical compounds that, when in touch with the majority of a substance, may attach themselves to it and provide colour, much as how dyes do for clothes and fabrics. According to the most recent estimates, there are about 7,105 tonnes of dye produced every year and around 100,000 distinct dyes are known [1]. Additionally, the textile sector consumes 10,000 tonnes of dye annually worldwide, of which 100 tonnes are released into water bodies each year [2]. Synthetic dyes are used in a variety of sectors but are mostly related to the textile industry because of their complicated bonding structure [3]. The concentration of dye in textile industry effluents can be rather high. Science is starting to look at the potential environmental and health risks associated with dye emitted by the textile industry [3]. As a result, new environmental laws are being implemented to regulate the release of dyes into freely flowing water bodies. During COVID-19 lockdown periods, such water pollution levels were drastically reduced due to minimum or nonoperations of industries [4].
Crystal violet dye having chemical formula C25N3H30Cl is one such cationic dye and it is used for various purposes like dyeing, colouring, and coating. Despite having a wide range of applications, CV has been described as a biohazard dye and a refractory dye molecule that stays in the environment for a long time and has hazardous effects on the environment. In some fish species, it functions as a mitotic toxin, a powerful carcinogen, and a powerful clastogene, encouraging the formation of tumours [1]. Due to this reason, the dye receiving water bodies needs treatment of the harmful dyes. Various industries like printing industry and dyeing industry produce a large number of dye effluents. The dye effluent after mixing with water causes various harmful effects as it possesses high level of chromaticity and huge content of organic matter. The wastewater containing dye effluent also affects the aquatic life and it has harmful effects on the process of photosynthesis [2, 3]. The various treatment methods include physical treatment, chemical treatment, and biological treatment, for example, advanced oxidation [3], flocculation [5], ozonation [6], and membrane filtration [7, 8]. Due to the critical nature and high cost involved, the treatment for dye wastewater has some limitations [9, 10]. Among all the treatment processes, adsorption is found to be the most suitable for the treatment of dye removal from wastewater [11–18]. In order to treat wastewater or to remove impurities from wastewater, the most commonly used adsorbent is activated carbon (AC). AC is prepared from various raw materials like flax fibre, sugarcane bagasse, and pine tree wood [19–23]. Activated carbon without any surface treatment has a very low capacity of adsorption due to its small specific area. In some cases, it becomes necessary to treat the activated carbon in order to increase its capacity of adsorption by increasing the bonding capacity. Various processes like physical, chemical, and biological are adopted to for the surface treatment of activated carbon. Treatment of activated carbon also known as surfactant modification is highly essential. An increase in the dispersion and solubility of activated carbon in water occurs due to surfactant treatment of activated carbon as it leads to a strong bonding between AC and water. Modification by surfactant has also a great advantage of being cost effective [24], and it does not cause any harm to the structure of activated carbon. Moreover, surfactant has also the capacity to change the surface charge characteristics of activated carbon leading to increase in pollutant adsorption site [25]. Surfactant modification is used in various adsorption processes of organic pollutant, reactive dyes, heavy metals, etc. [26–33]. Among all the surfactants, sodium lauryl sulfate is one of the most effective surfactants. Many researchers have carried out studies to investigate the effectiveness of surfactant-treated activated carbon on the removal of organic matter from wastewater, but very rare studies have been carried out on removal of dye by using surfactant-treated activated carbon.
Previous studies have shown that surfactant-treated activated carbon has a diverse impact on the dye containing wastewater, and that is why it is important to find out the effect of the presence of anions on the process of adsorption. More data is also required to investigate the adsorption of crystal violet dye by anionic surfactant-modified activated carbon. In this present study, the effectiveness of using surfactant-treated activated carbon on the removal of crystal violet dye was studied.
2. Materials and Methods
2.1. Materials
Crystal violet (C25N3H30Cl) having molar mass of 407.99 g/mol was used as an adsorbent. Hexadecyl trimethyl ammonium bromide (HTAB), SLS (C12H25SO4Na), and SDS (C12H25SO3Na) were the surfactants utilized in this investigation. Other chemicals used were calcium chloride, sodium chloride, hydrochloric acid, magnesium sulfate heptahydrate, sodium hydroxide, sodium nitrite, sodium sulfate, potassium chloride, potassium hydroxide, potassium chloride, and ferrous sulfate. All of the chemicals are procured from HiMedia, India. The chemical activation approach was used to make AC from rice husk (RH). Analar grade CV dye was also obtained from HiMedia. Figure 1 illustrates the chemical structure of CV dye.

Chemical structure of crystal violet.
2.2. Activated Carbon Preparation from Rice Husk
Activation through physical activation and chemical activation techniques is the general technique used to activate carbon derived from waste biomaterials [34]. To improve the capacity of adsorption of the organic dye, chemical agents such as H2SO4, ZnCl2, H3PO4, K2S, HNO3, KCNS, H2O2, NaOH KMnO4, KOH, (NH4)2S2O8, and K2CO3 are generally employed to activate the carbon [35]. The most difficult aspect of the AC preparation procedure is its activation. NaOH activation is cheaper than other chemicals and less harmful to the environment than KOH-AC activation. Through surface reactions, NaOH is an effective activator for disordered carbon compounds [36].
To generate rice husk activated carbon (AC), following methods were utilized: first, washing of the rice husk with water to eliminate dirt and other impurities, then it was kept for drying in an oven for 12 hours at 110°C, crushed, and sieved into fractions with an average particle size of 1.0 mm. Second, the husks were carbonized at 400°C for 90 minutes with a nitrogen flow of 300 mL/min. After that, NaOH (weight ratio 1/3) impregnation was done with the samples and dried at 120°C for 12 hours. For the activation the material obtained, the temperature was increased to 800°C at a rate of heating of 10°C and maintained at the final temperature for 60 minutes, after which the preparative process was then carried out by heating at 400°C for 20 minutes in presence of nitrogen at a rate of flow of 300 mL/min. At last, the active ingredient was grinded, neutralized with 0.1 M HCl, and washed many times with high temperature distilled water to keep the pH constant (6.6–7.0). The samples activated carbon after washing were kept for drying for 24 hours under vacuum at 120°C in a desiccator. As a result, activated carbon was produced.
2.3. Surfactant Modification of Activated Carbon
In 100 mL of solution, 8.60 mM anionic surfactant SLS and 5 g activated carbon were added. The AC was then filtered and rinsed with deionized water after being oscillated in a shaker at 303 K for 6 hours. The filtered AC was then dried for 24 hours at 313 K in an air-dry oven before being kept in a sealed and dry location. The surfactant concentration that corresponds to the critical micelle concentration (CMC) has been demonstrated to be the optimal for adsorption [37]. According to literature, SLS has a CMC of 8.60 mM at a temperature of 28°C. ACR and ACMAS were the names given to the AC in untreated form and the AC modified with anionic surfactant SLS, respectively. At a concentration of 1 CMC, the SDS and HTAB were utilized to alter AC in the similar technique and were dubbed ACSDS and ACHTAB, respectively.
2.4. Batch Analysis Parameters for Adsorption Analysis
The influence of experimental factors such as pH (3–11), starting CV concentration (25, 50, 75 mg/L), contact duration (0-180 minutes), adsorbent dose (5-100 mg), temperature (293, 303, 313 K), and ionic species on the ability of adsorption of CV onto modified AC was found out utilizing batch experiments. A pH meter and 0.1 M hydrochloric acid (HCl) and sodium hydroxide (NaOH) solution were used to determine the solution’s original pH. In a conical flask having 250 mL capacity, a particular amount of treated AC was added having 100 mL of solution at different concentration of CV. Each combination was rotated at 150 RPM at 25°C at the appropriate time intervals. After adsorption, the materials were then filtered and examined. The CV (1 g/L) stock solution was prepared by dissolving the appropriate amount of CV in distilled water. CV concentrations were determined using UV–Visible spectrophotometer (PerkinElmer lambda 45) at
2.5. Adsorption Capacity Based on Mass Balance Method
UV/visible spectrophotometer (PerkinElmer Lambda 45) was used to test the removal of CV using surfactant-modified activated carbon at the maximum absorbance peak for CV (590 nm). The mass balance on dye concentration (Equation (1)) was used to determine the rate of adsorbate removed (adsorption capacity):
Dye (CV) removal % was found out using Equation (2):
2.6. Characterization Studies
The pore volume, surface area, and pore size distribution of ACMAS with an automatic adsorption-desorption system (BELSORP-mini II, BEL Japan Inc.), based on N2 adsorption data at -196°C, are found out using Brunauer-Emmett-Teller (BET) analysis. X-ray diffractometer instrument (X-ray 6100 Shimadzu-Japan) having Cu K⍺ radiation (
2.7. Point of Zero Charge and Zeta Potential
The particular pH value at which a sorbent surface possesses a net zero or neutral charge, is known as the point of zero charge (
The zeta potential is the main factor which decides the adsorbent surface stability. The extent of electrostatic repulsion between nearby and particles which are similarly charged in a dispersion is given by the value of zeta potential. High zeta potential will indicate the stability of the small particles; i.e., the solution will have resistance against aggregation. When there is a weak potential, forces of attraction might outweigh repulsiveness, causing the dissipation to break apart and flocculate. Colloids, those are having high zeta potential capacity (positive or negative), are termed as electrically stable, whereas those with a weak zeta potential coagulate or flocculate.
Zetasizer Nano ZS (Malvern Instruments) at 25°C was considered to analyze zeta potential for ACMAS in a suspension of liquid. A He-Ne laser of 633 nm was used to provide light, and an avalanche photodiode (APD) was used as the detector. For the measurement of zeta potential, electrophoretic light scattering process was applied. To give electrical support to the ionized surface of adsorbent, a dip cell (zen1002, Malvern Instruments) having two parallel Pd electrodes was utilized. At a temperature of 12.8°, the signals were noted and the data analysis was carried out using Zetasizer Software. According to ISO13099 [39, 40], for evaluating ACMAS zeta potential in solution, the Smoluchowski model was used for the interpretation. The surface zeta potential was measured using a surface zeta potential cell (zen1020, Malvern Instruments) and a zeta potential transfer standard (DTS1235, Malvern Instruments) as a tracer particle, according to Malvern Instruments’ approach [41].
The main difference between zeta potential and point of zero charge is that in point of zero charge, it is the pH of dispersed ACMAS surface of the average charge when it becomes zero where as in case of zeta potential, it is the difference between the stationary layer and the dispersion medium of the solution consisting ACMAS surface in dispersion.
3. Results and Discussion
3.1. Influence of Surfactants and Adsorption Mechanism
For a concentration of CV of 50 mg/L, the degree of CV adsorption onto AC modified with various surfactants in aqueous solution is presented using Figure 2. Favorability of dye adsorption capacity by various surfactant observations was in the following order as ACMAS > ACR > ACSDS > ACHTAB, with ACMAS showing the highest adsorption capacity and so on.

CV sorption onto different AC’s (
In comparison to ACMAS and ACSDS, ACHTAB had the least amount of CV dye adsorption. As HTAB is a surfactant having cationic nature, it had an opposite attraction with cations of dye and the sites of adsorption which were preoccupied on AC, leading to a weaker capacity of cationic CV dye adsorption. Surfactants on AC may restrict the pores of the carbon, limiting its capacity to absorb CV when compared to untreated carbon. Surfactant-loaded AC has higher production capacity of sites for exchange of ions with more attraction for CV than surface of AC which are untreated. The more adsorption of CV on ACMAS versus ACR has shown that the positive influence of the ACMAS functional group counter weighed the negative impact of blockage of pores, whereas the lower CV removal by ACSDS versus ACR have shown that the negative impact of blockage of pore counter weighed the positive impact of the ACSDS functional group.
Due to the strong bonding between the cationic CV dye and anionic surfactant, AC treated with anionic surfactants has a high ability of adsorption for CV dye. Adsorption is influenced by the chemical characteristics of the surfactant’s functional groups. The sodium ions (e.g., R-SO3
− Na+) and protons (e.g., R-SO3
− H+) bound to the strong acid conjugate base of SLS may be readily diluted in a solution containing and replaced with the dye ion [42]. As a result, the ACMAS had a significant CV elimination effect. Due to the lack of a strong acid conjugate base, the bonding between SDS functional group and CV dye was smaller than that of SLS, resulting in a lower adsorption impact of ACSDS on CV than ACMAS. Figure 3 depicts the potential sorption mechanism for chemical adsorption of CV onto ACMAS. On ACMAS, reactions between the CV dye cation (M+) and RSO3Na might have happened according to Equation (3) to Equation (5). The active group of SLS that has a tendency to be dissolved in water is RSO3Na, while the carboxyl, phenolic hydroxyl on AC is represented by ROH.

Chemical phenomenon for CV sorption onto ACMAS surface.
3.2. Characterization and Surface Morphology of ACMAS
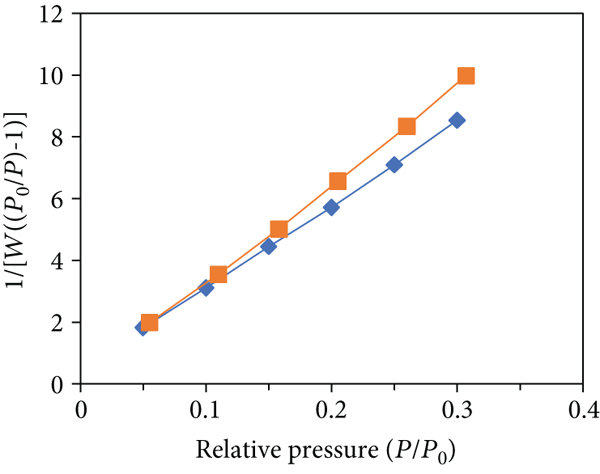
Using several models, BET analysis was done to find the volume of pore, to get an idea about average radius of pore and surface area of the adsorbent. Degassing of 25 mg of adsorbent was done at 300°C for 3 hours to determine surface area. It took roughly 24 hours to complete the surgery. The distribution of pore size curve produced (Figure 4) using the Barrett-Joyner-Halenda (BJH) analysis displays the adsorbent’s primary pore size distribution, and the whole adsorption and desorption data are provided in Tables 1 and 2. Adsorption and desorption phenomenon exposed a typical I-type isotherm. The adsorbent area of surface before adsorption was 191.25 m2/g and 202.64 m2/g after adsorption. Multipoint BET was used to get the surface area in the

Plot for BET analysis: (a) CV adsorption-desorption plot for isotherms, (b) plot for surface area, and (c) distribution of pore size for BJH desorption.

BET analysis parameters.
BJH analysis parameters.
The XRD patterns for ACMAS and CV-loaded ACMAS are depicted using Figures 5(a) and 5(b). XRD pattern of ACMAS in Figure 5(a) showing as many as 14 distinct and sharp peaks at several

XRD pattern for (a) unused ACMAS and (b) CV-loaded ACMAS.

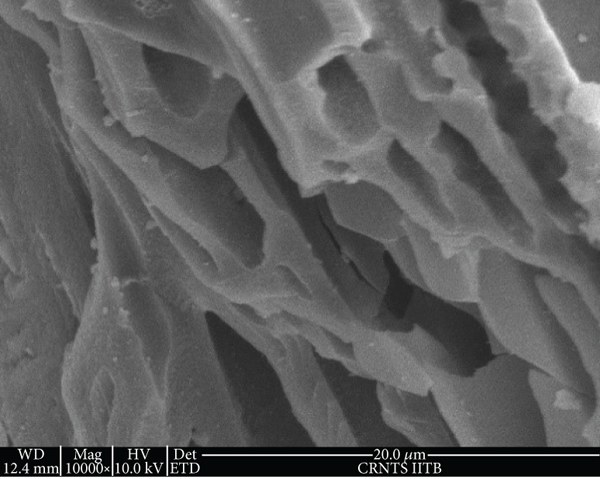
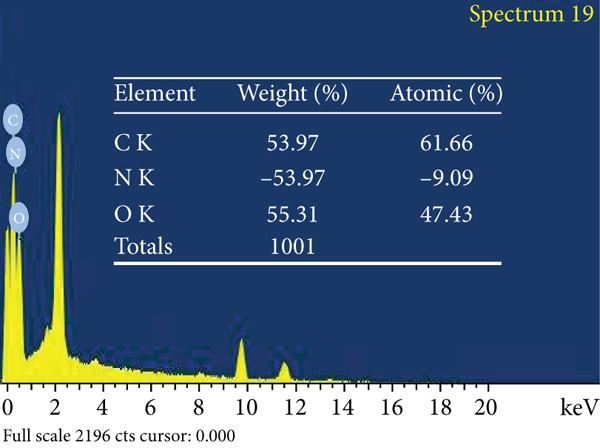
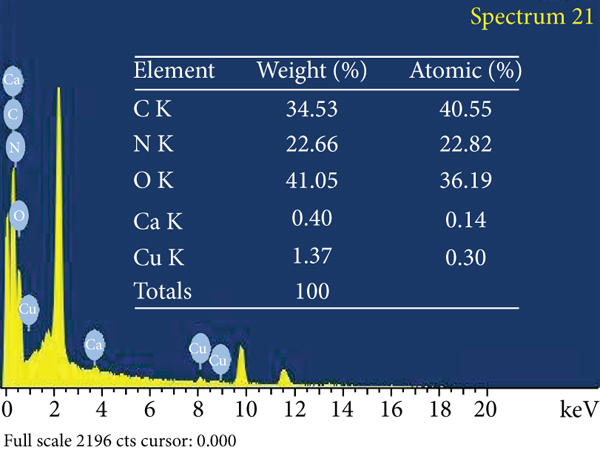
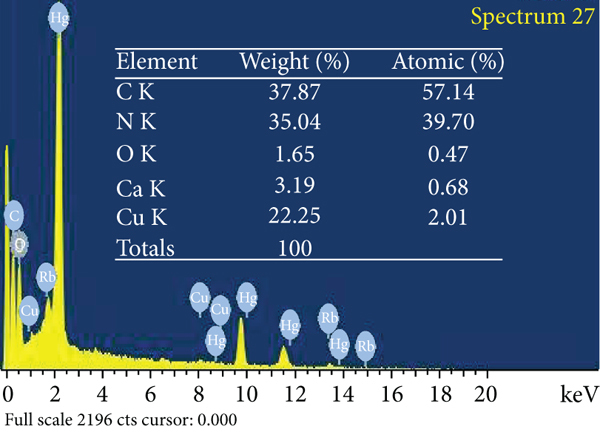
The adsorbent surface structure was investigated using environmental scanning electron microscopy (ESEM). Figure 6 depicts the adsorbent’s surface morphological and elemental properties in detail. Figure 6(a) depicts an ACR surface with a modest quantity of carbon detritus and micropores of various diameters. In comparison to untreated AC, Figure 6(b) depicts the ACMAS surface for a significant number of undulations and a considerable amount of rubbish component filling the pores. This was owing to SLS molecules’ electrostatic contact and adhesion. A substantial amount of material debris packed the pores, perhaps reducing surface area but also providing with ion exchange sites for adsorption. Figure 6(c) depicts the ESEM image for ACMAS after CV dye adsorption, from which it can be observed that CV dye particles got attached to the surface of ACMAS. The elemental analysis of ACR, ACMAS, and ACMAS after CV adsorption is investigated using XEDS analysis and depicted using Figures 6(d)–6(f). Investigation of elemental presence on surfaces showed that ACR (Figure 6(d)) is mainly composed of C, N, and O component, and after treatment with anionic surfactant SLS, the presence of Ca and Cu components was also noticed (Figure 6(e)) which may be due to the surface modification of the raw activated carbon with surfactant. Figure 6(f) shows replacement of N and Ca elements with Rb and Hg components but not in the same proportions, which suggests change in adsorbent surface morphology after dye adsorption. From the study, it can be inferred that after CV sorption, ACMAS-CV composites were formed which are confirmation of CV adsorption. The presence of different elements on the adsorbent surface at different stages is simultaneously shown in Figures 6(d)–6(f). Similar sorption phenomenon is reported earlier.

ESEM mages for (a) ACR, (b) ACMAS, and (c) ACMAS after dye adsorption and XEDS images for (d) ACR, (e) ACMAS, and (f) ACMAS after dye adsorption.

To reveal the various functional groups responsible for CV adsorption process, FTIR analysis was conducted.
FTIR is very useful for characterizing and knowing functional groups. Routine spectrum analysis was conducted at research facility SAIF Bombay, India. The features of the instrument are addressed in Section 2.6 of this report. Figures 7(a) and 7(b) show the FTIR spectra of ACMAS before and after CV adsorption. As depicted in Figure 7(a), due to the attached hydroxyl or amine groups, the broad band and strong band for ACMAS were observed at 3451.59 cm-1. The –CH asymmetric stretching resulted in a value of 2918.38 cm-1. The carboxyl group stretching vibration was assigned to the peak of 1710.48 cm-1. The bands at 1611.46 cm-1, 1412.44 cm-1, and 1366.79 cm-1 ascribed to asymmetric and symmetric stretching vibrations of
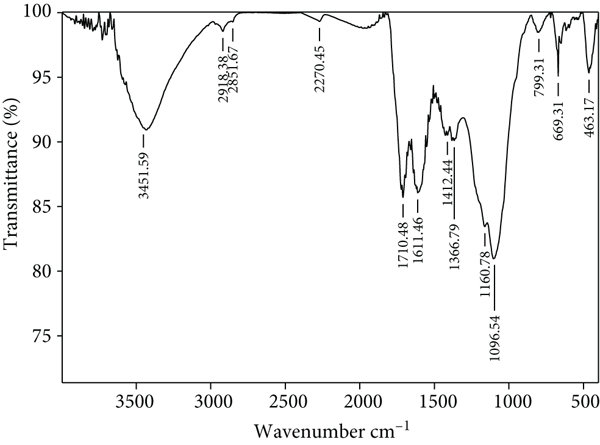
FTIR routine spectrum for (a) ACMAS before adsorption and (b) CV-loaded ACMAS.

To analyze the ionized active sites/pores and their sizes, to magnify the adsorbent surface and to affirm the buildup of adsorbate layer formation over the adsorbent, HR-TEM analysis was conducted which proves the adsorption of CV molecules on the ACMAS surface. As shown in Figure 8(a), the pores present in the AC surface might have covered by the ionized debris due to SLS modification, but the availability of the debris themselves provided with the ionized active sites which are responsible for efficient dye adsorption. As depicted in Figure 8(b), the dark spots visible are attributed to deposition of CV dye molecules on the ACMAS surface. HR-TEM study thus confirms the findings of other characterization studies like BET, XRD, FTIR, and ESEM. A magnified sample adsorbed site is illustrated using Figure 8(b) which shows the average pore size after adsorption as 24.2 nm which is in line with the BET analysis.

HR-TEM images for (a) unused ACMAS and (b) CV-loaded ACMAS.

3.3. Influence of pH on CV Adsorption Capacity
Figure 9 depicts the elimination rate and capacity of adsorption of CV onto ACMAS as a function of pH. The alkaline state was advantageous for CV adsorption on ACMAS, as illustrated using Figure 9(a). Figure 9(b) reveals the adsorption capacities of MG at pH 7, for which when the starting concentration of CV was 25, 50, and 75 mg/L, corresponding adsorption capacities were 59.14, 159.23, and 199.72 mg/g, respectively, while for same dye concentrations, at pH 11.0, CV adsorption capacities of 63.24, 167.43, and 204.76 mg/g were reported. Therefore, increasing the pH value enhanced both the MG adsorption rate and the adsorption capacity.
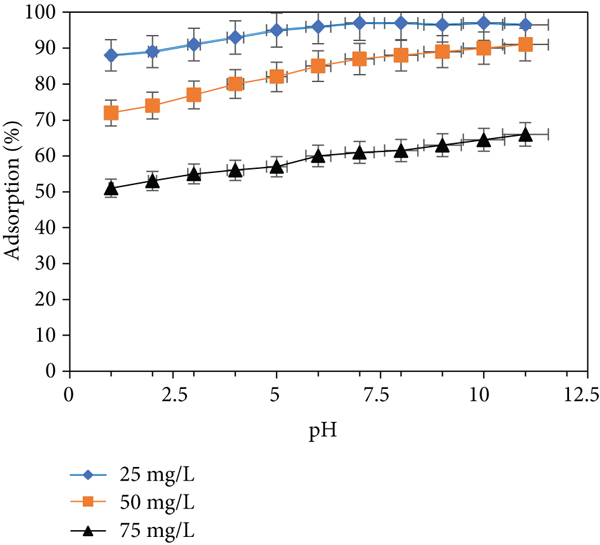
(a) Adsorption rate and (b) adsorption capacity of CV onto ACMAS at

The amount of ionization of acidic chemical and basic chemicals and the charges present at the surface of ACMAS are controlled by the pH values of dye solution [44]. At lesser pH level, hydrogen ions (H+) would not be dissociated by functional groups having oxygen on ACMAS, and SLS-electronegativity AC’s and the force of electrostatic attraction between ACMAS and dye cation would not be strong. Furthermore, free hydrogen ions may have slowed the dye cation’s adsorption onto the AC site by competing for adsorption, resulting in a decreased CV elimination rate. The dissociation degree of CV decreased as the quantity of hydroxide ions in the solution grew, and therefore, the CV removal rate increased as the pH value climbed [45]. Moreover, as pH increased, the degree of H+ dissociation by the functional groups having oxygen on the ACMAS surface increased, enhancing ACMAS electronegativity and the force electrostatic attraction between ACMAS and the dye cation [33]. Moreover, O-H groups and C=O groups on the adsorbent’s surface can captivate cationic dye molecules when the pH is high [46]. The same has been justified using FTIR analysis (Figures 7(a) and 7(b)), where it is evident from shifting and shrinking of O-H and C=O groups after adsorption. As a result, in an alkaline environment, ACMAS has a high CV adsorption capability. The findings are similar as reported earlier [11]. According to another report [47], the rate of adsorption of cationic dye by leaf of raw pine charcoal at higher pH level was found to be effective than that at lower pH levels. The rate of adsorption rose significantly from pH 2 to 7 and just marginally between pH 7 and 9. Another authors [48] investigated the influence of pH on cationic dye adsorption by several ACs, finding that the dye’s adsorption capability increased as the starting pH rose.
The zeta potential determination method is discussed in Section 2.7 of this report. Fluctuation of zeta potential values for ACR and ACMAS with respect to pH is shown in Figure 10(a). Values for ACMAS and ACR were evaluated as 3.37 and 4.29, respectively.

Plot for (a) zeta potential for ACR and ACMAS and (b) point of zero charge for ACMAS.

Study showed that ACMAS had a higher surface electronegativity than ACR, which was attributed to the van der Waals force attachment of the surfactant’s hydrophobic alkyl end to the activated carbon surface (nonpolar). To lower the amount of dissociated H+, SLS was applied to the functional group present on the surface of AC having oxygen like phenolic-hydroxyl and carboxyl. Because of its greater electronegativity, ACMAS has a more effective electrostatic affinity and adsorption capability towards CV compared to ACR. In this research, the rate of adsorption of CV on ACMAS was generally steady, while the pH was approximately 4 to 8.
The positive and negative
3.4. Influence of Adsorbent Dose
Dose of adsorbent has a remarkable impact on the activity of adsorption. The impact of dose of adsorbent on adsorption of CV adsorption investigated to obtain the optimal quantity of adsorbent at different concentrations of CV [50]. As illustrated in the image below (Figure 11), 100 mL of CV solution having three varieties of concentrations (25, 50, and 75 mg/L) was tested with different adsorbent dosages (5-100 mg). Under varied CV concentrations, a similar pattern in CV adsorption pattern on ACMAS was found. Because the number of adsorbent pores and adsorption sites grew due to increase in sorbent quantity, CV removal rate steadily enhanced.

Influence of ACMAS dose for CV sorption (
When the adsorbent mass attained a particular value, the adsorption would trend to equilibrium. At adsorbent masses of 35, 40, and 50 mg, the CV removal rate approached saturation, corresponding to starting concentrations of CV of 25, 50, and 75 mg/L, respectively. The quantity of molecules of CV dye present in the aqueous mix was insufficient to entirely mix with all influential site of adsorption on the adsorbent at high adsorbent doses, leading in an equilibrium condition of the surface and a fall in capacity of adsorption per unit adsorbent mass.
3.5. Influence of Contact Time
For three starting CV concentrations (25, 50, and 75 mg/L), Figure 12 depicts the relation between the rate of adsorption and the capacity of adsorption of CV on ACMAS and time.

Influence of contact time for CV adsorption onto ACMAS (a) sorption rate and (b) sorption capacity, with

Figure 12 shows that as contact duration rose, elimination capacity and capacity of adsorption of CV by ACMAS increased as well, eventually reaching a maximum value. The procedure was split into two halves. To attain the relative adsorption equilibrium condition known as rapid adsorption, the first stage required 5–30 minutes. The interactive process between CV dye and the active sites of adsorption was responsible for this performance, and the ACMAS adsorbent functional groups were entirely and effectively completed. For the first halve, the pace at which the dye was adsorbed onto the sorbent surface regulated the absorption rate. The sluggish adsorption process was the second phase. The relative rise in CV removal extent after 30 minutes of contact time was not significant, and as time passed, the adsorption rate declined and ultimately stabilized. The ACMAS adsorbent’s functional groups were gradually saturated as a result of the process of binding between sorbate molecules and sorbent surface ionized sites. In the second halve, transfer of dye occurred from outer boundary to the inner site with available pores present on the surface of the sorbent which ultimately controlled the adsorption capacity and rate [50]. Furthermore, the lower the starting dye concentration, the quicker it took to reach adsorption equilibrium. The findings were mostly in line with earlier research on dye clearance rates [37]. Based on the correlation between contact duration and CV elimination, a contact time of 120 minutes was chosen for following tests.
3.6. Influence of Dye Concentration
Considering 5 to 100 mg of ACMAS and considering a pH value of 6.0 for the modelled dye solution, the effect of varying starting concentrations of dye (25, 50, 75, and 100 mg/L) on the removal of CV dye was investigated. Adsorbent samples of 15 mg were introduced to a dye solution of 100 mL and adsorbed for 120 minutes at 293 K. Table 3 shows the experimental results.
Influence of dye concentration on its own percentage removal.
As per the findings listed in Table 3, as the starting concentration of dye was changed from 25 to 100 mg/L, the sorption rate (percent) of CV by 15 mg of ACMAS adsorbent fell from 96.5 percent to 73.1 percent, but at the same time, for increase in dye dose from 25 to 100 mg/L, the equilibrium capacity of adsorption (
Due to a shortage of accessible high-concentration active sites of CV, the dye removal extent reduced as the initial CV concentration rose [51], but the capacity of adsorption of CV on ACMAS increased as the initial concentration of CV grew. SLS’s sulfate functional group offered ion exchange sites that were favorable for CV ion adsorption. Activated carbon enhanced with surfactant having anionic character and exhibits more adsorption sites with positive charges and a strong adsorptive activity for removing cationic dye when compared to untreated AC [26, 40].
3.7. Determination of Mass Transfer Parameters and Rate Limiting Step
The reaction rate is critical for adsorption, but determining the rate limiting step will aid to choose a reactor configuration as well as the time required for interconnection between the adsorbate and adsorbent (Helfferich,1962). From the standpoint of the application, the rate limiting step is equally critical. In adsorption, if the rate-limiting stage is decided by the pore diffusion, then pausing for almost 30 minutes during column operations can improve capacity of adsorption. Similarly, if the rate-limiting phase is decided by the film diffusion, the pause will not show any impact on the adsorbent’s adsorption capacity. Hence, the phases in the sorption process that control the overall rate of elimination must be determined.
3.7.1. Intraparticle Diffusion or Pore Diffusion Model
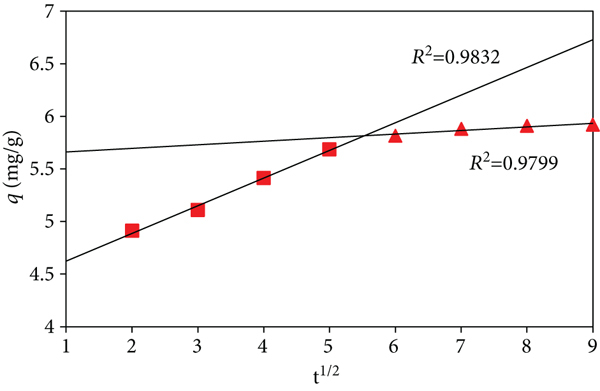
The equation proposed by Weber and Morris gives the rate limiting step in pore diffusion as follows:
Equation presented using Equation (6) is the form of straight-line
The thickness of boundary layer effect is determined by the

Plot for (a) intraparticle diffusion model, (b) pseudo 2nd-order rate kinetic, (c) Elovich model, and (d) modified Freundlich model (


Experimental data fitted for pore/intraparticle diffusion revealed that the linear line of the plot does not pass through the origin (Figure 13(a)) hinting that the sorption process was not entirely regulated by intraparticle diffusion and other processes are also involved in the mass transfer process. As the sorption progressed, the boundary layer thickness might have increased which is evident from the fact that as the sorption moved forward, the intercept constant
Kinetic constants for CV sorption onto ACMAS.
Plot for
3.7.2. Liquid Film Diffusion Model
Adsorbate diffusion to the adsorbent surface from the liquid phase is a crucial point to be considered in obtaining the rate of adsorption. The liquid film diffusion model was proposed by Boyd as follows:
In the Boyd plot, a graph is plotted between

Film diffusion model for CV adsorption onto ACMAS (CV dye
As per analysis, the linear plot for film diffusion also does not pass through the origin, but is close to origin showing that film diffusion also has part in the absorption analysis. Likewise, other kinetic models are discussed as below.
3.8. Study of Other Adsorption Kinetics
To analyze factors influencing rate of reaction and to understand the reaction chemistry between adsorbate and adsorbent, a study of kinetics is crucial. Apart from intraparticle diffusion model, rate of adsorption was analyzed by fitting the experimental data into several other rate kinetics. Data were fit into five rate kinetics to reveal the suitable reaction rate (including intraparticle/pore diffusion model which is discussed in Section 3.7 of this article).
3.8.1. Kinetic Models for Pseudo 1st and 2nd Order
Pseudo 1st-order model can be expressed as follows [36]:
Also, equation for the 2nd-order rate model can be expressed as follows [38]:
Second-order rate kinetic is understood to be proportionate for concentrations equivalent to two reactants, and also this rate kinetic symbolizes chemical sorption and hence fast and high sorption. Now integrating Equation (10) and using
Table 4 shows the relevant kinetic equation parameters calculated from the slopes and intercepts of the linear plots. The fitness of the pseudo second-order model is superior than the pseudo first-order model, as seen by the correlation coefficient values. Also, comparing adsorption capacity data from experiment with adsorption capacity calculated using models, it is revealed that 1st-order rate kinetic values are in large variation with experimental data while the 2nd-order kinetic values are in line with the experimental values justifying the appropriateness of pseudo 2nd-order rate kinetic model. Table 4 shows that for pseudo 1st order, no pattern has been discovered for
3.8.2. Elovich Model and Modified Freundlich Model
The equation for Elovich can be represented as follows [50, 51]:
Equation describing a straight line can be given as follows:
The Elovich equation’s constants are determined from the plot of
The equation of modified Freundlich was actually given by Kuo and Lotse (1973). It can be represented as follows:
The constants are determined from the graph of
From the analysis of kinetics, it was revealed that experimental data fitted best with the pseudo 2nd-order rate kinetic for adsorption of CV dye onto surfactant-modified AC and thus also suggesting that process was favored by chemisorption. Studies suggested that sorption mechanism was not entirely supported by the combination of intraparticle and film diffusion at different stages of process but also controlled by 2nd-order rate kinetic where electrons were transferred between cationic and anionic functional groups present in the CV dye and surfactant-modified AC surface.
3.9. Adsorption Isotherm Studies
Establishing the most accurate relation for the equilibrium curves is critical for design optimization of an adsorption system for the elimination of adsorbates. For the present study, various isotherm models are adopted to describe the equilibrium nature of adsorption process. Isotherm models like Temkin, Freundlich, Langmuir, Redlich-Peterson (R-P), Toth, Radke-Prausnitz, and D-R models were used to assess the fitness of experimental equilibrium adsorption data for CV adsorption onto ACMAS. These isotherms are represented by the equations as follows [51, 52]:
For surface of adsorbent, possessing a nonuniform heat of adsorption distribution throughout the surface, the Freundlich isotherm holds true. The Langmuir isotherm, on the other hand, indicates that sorption occurs at homogenous locations inside the adsorbent. The isotherms of Redlich-Peterson, Toth, and Radke-Prausnitz, on the other hand, may be used in both homogeneous and heterogeneous systems, whereas D-R isotherm is applicable in case of multilayer adsorption.
The parameters of isotherm and coefficients of correlation in order to adsorb CV dye onto ASM-AC are shown in Table 5. To identify the isotherm parameters by fitting the experimental data, nonlinear regression analysis was performed using the solver-add-in tool of Excel 2007.
Isotherm constants for CV sorption onto ACMAS.
For Langmuir isotherm,
Langmuir

Plot for (a) Langmuir isotherm, (b) D-R isotherm, and (c) Redlich-Peterson isotherm for CV removal onto ACMAS (


For Freundlich model, the adsorption capacity and intensity are shown by the constants
Analysis of isotherm models revealed that experimental data at equilibrium point fitted better with Langmuir model, followed by D-R and Redlich-Peterson models. Suitability of Langmuir model indicated that CV sorption was homogenous over the adsorbent surface. Results implied that AC treated with anionic surfactant produced a consistent pore distribution over the AC surface assisting in uniform and homogenous adsorption of CV dye. From the study of kinetics and isotherms it can be inferred that adsorptive interaction between sorbate and sorbent resulted homogenous and chemical adsorption. Moreover, Table 6 shows the comparison for Langmuir adsorption capacity with previous reported adsorbents for CV dye.
3.10. Analysis of Error Function
A vast amount of data from the investigation of dye adsorption by surfactant-modified AC (ACMAS) was evaluated on multiple linearized models for finding the best-fit model. But due to the linearization inherent bias resulted and sets of different isotherm parameters were established using nonlinear regression equations. This gives a mathematical procedure to find out the parameters of isotherm using the actual isotherm equation. So, the optimization approach requires an error function to match the isotherm data to the experimental equilibrium data. Because the error function chosen has an impact on the parameters of the derived-error function, which is mostly based on absolute deviation bias, the data fits into a zone of high concentration. This weighting is increased even more when extreme errors are penalized by the square of the deviation. The bias can be counterbalanced by dividing the deviation with the help of a computed value to demonstrate the relevance of fractional deviation. By the use of Solver add-in with Microsoft Excel, isotherm parameters were discovered during the analysis of error function isotherms by minimizing the respective error functions over the concentration range. This program’s initialization is based on a clever guess parameter. In Microsoft Excel, an iterative procedure was started using the numbers obtained from the linearized version of the model. The following sections detail the various error functions.
3.10.1. The Sum of the Absolute Errors (SAEs)
The summation of the method of absolute errors can be given by the following equation:
3.10.2. The Sum of the Square of the Errors (SSEs)
The summation of the squares of the error’s method can be written as follows:
The isotherm parameters that are computed using this error function provide a better fit as the error value; hence, the biasing of fit towards data acquired at the high end of the concentration range increases as the square of the magnitude of error increases. Despite being the most often used error function, the error function has a number of drawbacks.
3.10.3. The Hybrid Fractional Error Function (HYBRID)
The sum of the square of the error is divided by the measured value to best suits the sum of the square of the error at a very low concentration. Porter et al. created an error function to achieve this better match. It also uses the number of data points minus the number of parameters (
3.10.4. Marquardt’s Percent Standard Deviation (MPSD)
It is represented as follows:
This error function is used by different researcher in this subject in the past. It sometimes resembles the geometric mean error distribution, which improves with the number of degrees of freedom of the system [64].
3.10.5. Average Relative Error (ARE)
The average relative error function [65] is as follows:
This error function tries to keep the fractional error distribution as small as possible throughout the whole concentration range.
3.10.6. Chi-Square (
) Test
The sum of square of difference between actual experimental data and theoretical data predicted from using various models is defined as chi-square with all the individual difference of square being divided from each respective data produced from models. When comparing the fitness of isotherms, the lowest values of
Error functions for CV sorption onto ACMAS.
From the inference of results of the error functions values (Table 7) and the values of coefficient of correlation for the isotherms (Tables 5 and 6), the suitability of isotherms for the present study is found in the following order: Langmuir > D-R > Redlich-Peterson > Radke-Prausnitz > Toth > Temkin > Freundlich.
As per the fitness, three of the best-fit isotherms (Langmuir, D-R, and Redlich-Peterson) are shown using Figures 16(a)–16(c), respectively. For Langmuir model, the curve is plotted between
3.11. Influence of Temperature and Thermodynamic Parameters
Three distinct concentrations of CV dye (25, 50, and 75 mg/L) were investigated at different temperatures (293 K, 303 K, and 313 K), and the results are presented using Figure 17. At all concentrations, capacity of CV adsorption onto ACMAS was directly proportional to rise in temperature. This revealed that the adsorption was an endothermic process that occurred spontaneously.

Effect of temperature variation on CV removal onto ACMAS (
With increasing temperature, chemical potential, solubility, and thermal motion of dye molecules increased [66]. Furthermore, the structure of pore of AC was shown to be highly correlated with temperature. Due to thermal expansion, the structure of pore and number of active adsorption sites of activated carbon became more with rise in temperature. Due to these factors, the capacity of adsorption of CV on ACMAS has increased with rise in temperature.
In the research of adsorption thermodynamics, the temperature influence and mechanism of sorption were further investigated. From the standpoint of energy, the thermodynamics of ACMAS adsorption were investigated. The adsorption thermodynamics approach was used to investigate the driving force of adsorption and establish whether or not the adsorption process was spontaneous. Enthalpy change (
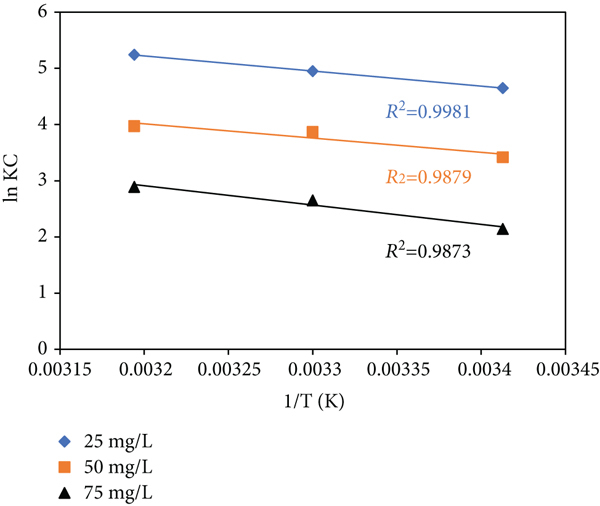
Van’t Hoff’s plot for CV sorption onto ACMAS.
Thermodynamic parameters for CV removal onto ACMAS.
The negative
3.12. Determination of Activation Energy
Adsorption happens when an adsorbate particle collides with the surface of an adsorbent with a specific minimum energy and a specific direction. The adsorbate particle must pass the energy wall present on the adsorbent’s surface in order for adsorption to occur. Activation energy is the minimum quantity of the required energy needed for the adsorption process. If the value of activation of the adsorption process is above 40 kJ/mol, process is considered to be under the influence of chemical adsorption, and if it is less than 40 kJ/mol, it is said to be controlled physical adsorption [14]. An empirical relation is given by Arrhenius for this energy:
Applying operation of natural log (at the base
By plotting the curve (Figure 19) of
Plot between
3.13. Influence of Additive Salts and Coexisting Anions
For the investigation of influence of various salts such as FeSO4, CaCL2, MgSO4, NaCl, NaNO2, KCl, and NH4Cl 100 mL of CV solution was used for each of the dye concentration values, viz., 25, 50, and 75 mg/L. After adjusting the solution pH at 6.0 and oscillation of 30 minutes, tests were carried by adding 200 mL of additive salts in the dye solution for each salt compound. Influence of salts on sorption capacity is illustrated using Table 9.
Influence of additive salts on CV removal onto ACMAS (
The adsorption of CV onto ACMAS was little affected due to coexistence of ions/salts in the solution mix. The dye removal rates were 78.2%-82.5% for 50 mg/L dye concentration, in the presence of coexisting ions, and it was found more or less same to removal rates of 81.6% when the ions were absent. For 75 mg/L initial CV concentration, the clearance rate of CV in the presence of coexisting ions (55.2% - 58.4%) was similar of ions were absent (57.1%). This finding is comparable to other work on the influence of cations on ammonium adsorption on ACMAS [28]. It showed that the adsorption mechanism was unaffected by ionic species such as NH4+, Na+, Ca2+, K+, and Mg2+.
The capacity of adsorption of CV onto ACMAS in presence of NaCl, CaCl2, or NH4Cl increased marginally. This can be attributed to the enhanced deionization method of CV dye in aqueous mix due to dipole-dipole interaction, ion dipole forces, and van-der-Waals interaction bonding between molecules of dye. Previous findings also reported that additional minerals/salts increase the dye removal rate by AC carbon subjected to surfactant modification [20]. Presence of (NO2-) ion had a stronger influence on the adsorption of CV by ACMAS. For NO2- presence in aqueous mix, CV removal rate is reported as 86.2% which is higher when compared to absence of same ion when the CV concentration was 50 mg/L (for solution in absence of
3.14. Isosteric Heat of Adsorption
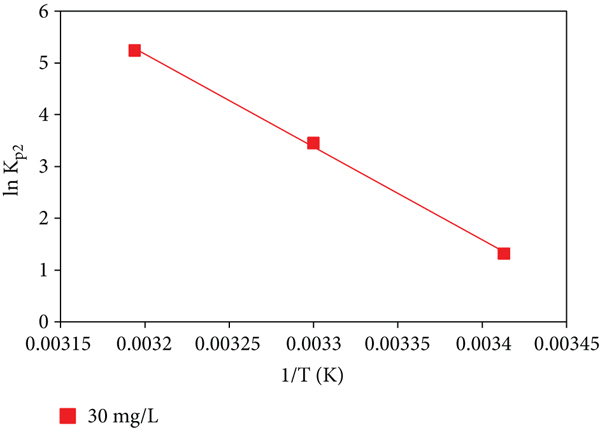
The adsorption heat at a constant surface coverage is known as the isosteric heat, i.e., at a particular constant quantity of adsorbate material that has been adsorbed at the adsorbent surface and it is calculated using the integrated Clausius-Clapeyron equation:
At equilibrium,

Relation between
The temperature and the SL are the main factors on which the isosteric heat of adsorption depends. The process is called an endothermic process if the isosteric heat increases with increase in temperature. Similarly, if the isosteric heat decreases with decrease in temperature it is said to be exothermic. If the surface of adsorbent is homogeneous them the isosteric heat of adsorption is independent of the surface loading and will be constant. But if the isosteric heat of adsorption changes with surface loading then the surface of adsorbent is energetically heterogeneous which favors adsorption. It is also indicating the presence of strong lateral interaction between adsorbed molecules. The low value of isosteric heat of adsorption is result of predominance of adsorbate-adsorbate interaction where as high value of isosteric heat of adsorption is due to predominance of adsorbent-adsorbate interaction. Figure 21 shows the increase in isosteric heat against increase in temperature which suggests that the adsorption was endothermic in nature which is in synchronization with the thermodynamic studies done for this study.

Plot between
3.15. Column Study
To understand the performance of adsorbent column, a column of glass having 2 cm diameter and 50 cm length was utilized. To give support to the adsorbent, the bottom of the column was filled with glass wool, and the column was then filled with 2 g of ACMAS with an initial bed depth of 10 cm. Flow rates of 0.5, 1.0, and 1.5 mL/min were used to pass a 25 mg/L CV solution through the column. In a conical flask, the treated water was collected. Figure 22(a) depicts the experimental breakthrough curves (S-curves) produced for different flow rates. Due to limited contact time, higher rates of flow led in early breakthrough. Due to insufficient contact time, the adsorption capacity declines as the flow rate increases from 0.5 to 1.5 mL/min, whereas it increases at a low flow rate up to 0.5 mL/min. Since flow rate of 0.5 mL/min showed maximum adsorption, hence, this flow speed and bed depth of 10 cm was chosen for column study using variation in dye concentrations, viz., 25, 50, and 75 mg/L, results of which are depicted using Figure 22(b). Analysis revealed that adsorption with higher concentration (75 mg/L) attained early breakthrough compared to other two concentration studies (25 and 50 mg/L). Similarly, study has been done for three separate bed depths of 10, 20, and 30 cm for constant flow rate and dye concentration values of 0.5 mL/min and 25 mg/L, respectively. Results of column analysis using bed depth variation are shown in Figure 22(c).
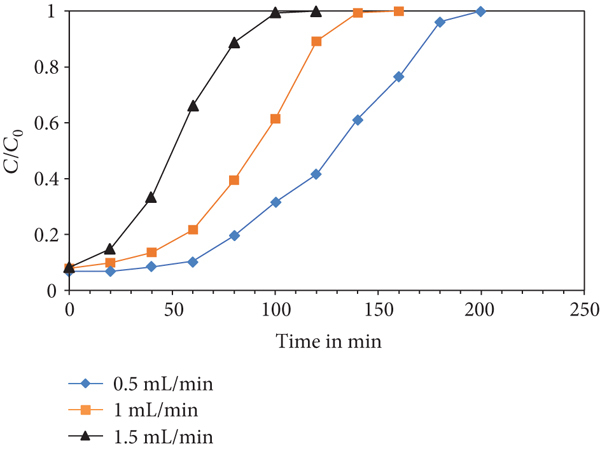
(a) Breakthrough curves at different flow rates (


Various breakthrough models are presented in Table 10; viz., the Thomas, Yoon-Nelson, Bohart-Adam, and Clark models were utilized for various flow rates to match the experimental data of the column studies in order to define the fixed bed column behaviour and scale it up for industrial applications. For column adsorption isotherm, the inclusiveness or exclusiveness of reactions, importance, and the rate law type utilized, each of these models differs from the others [71, 72].
Linear equations for breakthrough models.
The Thomas model is a generic model for describing column performance when external and internal diffusion resistances are exceptionally low. The adsorption behaviour is assumed to follow second-order reversible reaction kinetics and a Langmuir isotherm without axial dispersion in this model.
Linear form is as follows:
Yoon and Nelson devised a simpler model that requires no precise information on the adsorbate’s characteristics, the adsorption bed’s parameters, or the kind of adsorbent. The rate of decline in the likelihood of an adsorbate molecule is considered to be proportional to the probability of adsorbate adsorption and the probability of an adsorbate breakthrough on the adsorbent in this model.
Linear form is as follows:
The equilibrium, according to Bohart-Adams, is not immediate. The adsorption capacity depends on the adsorbent, and adsorbing species concentrations are proportional to adsorption rate.
Linear form is as follows:
The Clark model is based on the usage of the Freundlich isotherm in conjunction with a mass-transfer notion. The Clark model implies that the mass transfer zone’s shape remains constant and that all adsorbate is eliminated at the column’s end.
Linear form is as follows:
Figure 23 shows how breakthrough curves for various flow rates were fitted to the models. Table 11 results reveal that Thomas model fit better with the experimental data well and had a high

Breakthrough curves for (a) Thomas model, (b) Yoon-Nelson model, (c) Bohart-Adam model, and (d) Clark model.


Parameters for different column study models for different flow rates.
3.16. Regeneration Studies
Eluents such dilute HCl and dilute NaOH were used to regenerate the used ACMAS. All the reusability studies were carried at room temperature. Figure 24(a) and Table 12 show the desorption and reuse of ACMAS with 1.0 M NaOH at
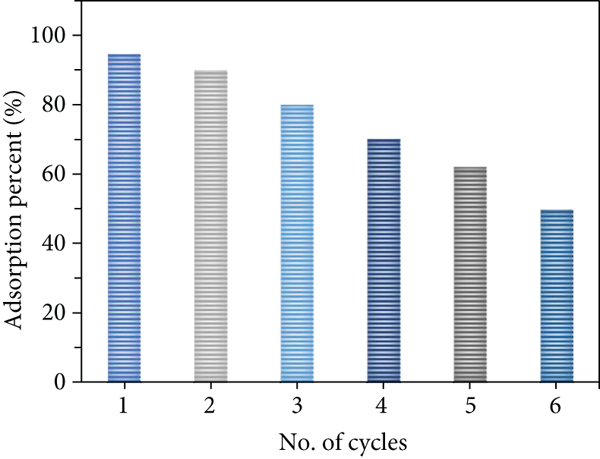
(a) Adsorption-regeneration cycle. (b) Regeneration of ACMAS with NaOH and HCl.

ACMAS recycle-regeneration data using 1.0 M NaOH.
Adsorption capacity and % adsorption by using different conc. of NaOH and HCl for ACMAS regeneration.
Desorption capacity comparison for different eluents.
3.17. Analysis of Chemical Oxygen Demand (COD)
The digesting system was turned on, and a temperature of 150°C was established to know chemical oxygen demand (COD). After that, 10 digestion tubes were considered and each of the tubes received 50 mL of sample (dye solution with a concentration of 50 mg/L). They were added with mercuric sulfate and standard K2CR2O7 (potassium dichromate, strength 0.125 N). After that, the tubes were placed in a plastic tray and allowed to cool before being filled with 50 mL of sulfuric acid reagent. The sulfuric acid reagent was slowly introduced. The solution was then thoroughly blended. The tubes were stored in a COD digester after the material was mixed. The air condensers were placed into the tubes, and the reflux of the mixture was set for 90 minutes. The air condensers were then removed from the tubes, as well as the tubes from the COD digester, and the COD digester was allowed to cool to room temperature. Titration against 0.1 M ferrous ammonium sulfate solution with 1-2 drops of ferroin indicator was used to measure the COD value (Assam state pollution control board manual). The test was conducted using a COD block digesting system (model Pelican Kelplus-08L CAC). The COD value (in mg/L) was determined as follows:
Observations (data not given) revealed that before adsorption, COD value of sample solution was at 119.76 mg/L and the same has reduced to 43.15 mg/L after adsorption. Hence, it is conclusive that before adsorption due to the presence of higher initial concentrations of CV dye, the COD value of the water solution was higher, and as the solution was subjected to adsorption, dye concentration of the solution reduced, and eventually, the COD value of the solution came down. It also indicates that due to addition of ACMAS in the solution, any increase in the COD value of the solution was insignificant, hinting that ACMAS was stable in water solution and was not releasing any chemical into the solution during adsorption process. The reduced COD value of the solution after the adsorption process and the removal of dye indicates the fitness of the ACMAS as an efficient adsorbent for the removal of CV dye from the solution.
3.18. Adsorption of CV onto ACMAS Using Real Water Samples
Table 15 shows the CV adsorption rate onto ACMAS in three distinct actual water samples: water from tap, natural water, and wastewater. The water sample collected from tap was taken from lab faucets, the natural water sample was taken from the Gaurang River in Kokrajhar, Assam, India, and the wastewater sample was taken from an unnamed drain on the CITK campus. In 100.0 mL water samples, a specified quantity of CV was added and concentrations of 25, 50, and 75 mg/L were generated, accordingly. All of the samples were brought down to a pH of 6.0 and agitated in a shaker for 30 minutes. For comparison, distilled samples of water were used as benchmark water samples. As per findings, in comparison to modelled dye wastewater, the rate of adsorption of CV by ACMAS in actual water samples was marginally enhanced.
CV adsorption onto ACMAS in real water samples.
4. Conclusion
In this present study, results have clearly shown that use of anionic surfactant-treated activated carbon has improved the adsorption of crystal violet dye. The adsorption capacity was greatly influenced by initial concentration of dye, dose of adsorbent, effect of pH, effect of contact time, etc. While treating the surfaces of activated carbon with anionic surfactant, the groups those are soluble in water were bonded with the AC surfaces. Due to this, specific binding sites having functional groups were present at the surfaces of activated carbon for removal of dye. Anionic surfactant-treated activated carbon was found to be more effective on dye removal as it has the capability of removing cationic dyes. Various characterization experiments were carried out to investigate the capacity of dispersion and the capacity of dye adsorption onto adsorbent surfaces. The pH level at which the adsorption process was favorable was given by
Footnotes
Data Availability
All the data are incorporated in the manuscript in the form of table or figure.
Conflicts of Interest
The authors declare that they have no known competing financial interests or personal relationships that could have appeared to influence the work reported in this paper.
Authors’ Contributions
Rumi Goswami is responsible for the experiments, data collection, writing, preparation, editing the manuscript, interpretation, writing manuscript, data curation, and reviewing. Amit Kumar Dey is responsible for the conceptualization, methodology, and supervision.
Acknowledgments
Authors acknowledge the contribution made by the Environmental Engineering Lab, Department of Civil Engineering, Central Institute of Technology, Kokrajhar, India. The authors also would like to thank the Sophisticated Analytical Instrument Facility, Bombay, IIT Bombay, India.