
Abstract
SF6/N2 gas mixture decomposition components can reflect the operation status inside GIS, and be used for fault diagnosis and monitoring inside GIS. NF3 and N2O are the characteristic decomposition components of SF6/N2 mixed gas. In order to find a potential gas sensitivity material for the detection of NF3 and N2O. This paper investigated the adsorption properties of NF3 and N2O on Al- and Ga- doped graphene monolayers based on density functional theory. Through the analysis of adsorption distance, charge transfer, adsorption energy, energy band structure, etc., the results indicated that the adsorption effect of Al- and Ga-doped graphene to NF3 and N2O are probably good, and these nanomaterials are potential to apply for the monitoring of GIS internal faults.
1. Introduction
SF6 has been extensively adopted for high-voltage gas insulation devices due to its superb arc extinguishing and insulation abilities. However, it has a strong greenhouse effect [1–3]. Concurrently, the addition of N2 can greatly reduce the use of SF6 gas without significantly affecting the insulation performance, which is of great importance in achieving energy conservation and emission reduction [4–7]. However, SF6/N2 mixed gas under partial discharge (PD) or partial overheating conditions will produce gases such as NF3, SO2, CO2, and N2O [8]. It is a feasible technical method to comprehend the fault diagnosis of SF6/N2 mixed gas insulation equipment by monitoring this characteristic component decomposition information.
As the research hotspot of gas sensing materials in the sensor field, graphene has become an irreplaceable material with its ultrahigh electron mobility and specific surface area (SSA), along with superb mechanical characteristics [9–12]. Compared to other sensing materials, the following documents are available. According to He et al. C2H2 gas was analyzed for its sensing properties as well as electronic characteristics on diverse boron nitride nanotubes-modified transition metal oxide (Fe2O3, TiO2, and NiO) nanoparticles [13]. It was found that the conductivity of C2H2 gas on the three transition metal oxides and modified boron nitride nanotubes was different, especially on Fe2O3 and TiO2. In his studies of the gas sensing properties of single-walled carbon nanotubes doped with gold atoms for SO2 and H2S. Chen et al. found that SO2 and H2S have good adsorption properties on gold doped single-walled carbon nanotubes [14]. Syaahiran et al. implemented the DFT method to analyze CO, H2S, and H2 for their gas sensing performances on (WO3)
Many scholars have studied the gas sensors of atom doped graphene, such as Mn, Pd, and Pt, to better study the interaction between graphene materials and gas molecules and to explore the gas-sensing characteristics of gases onto doped and intrinsic graphene surfaces. Gui et al. through DFT calculation, studied adsorption properties for typical oil soluble gases (C2H2, CH4, and CO) in transformers by doping Mn atoms at graphene bridge sites [17]. The gas sensing mechanism was analyzed by using the density of states (DOS) and molecular orbital theory. As a result, manganese-doped graphene was the potential gas-sensing substance in the detection of CO and C2H2. According to the literature, gas adsorption is more evident due to the doping of transition metals [18]. It is confirmed that doped graphene shows better gas sensing performance than intrinsic graphene, and metal doping remarkably enhances graphene chemical activity and adsorption performance.
According to above-mentioned, this paper studies the gas sensitivity of Al-doped Gra and Ga-doped Gra to NF3 and N2O gas molecules based on DFT. This work will guide the manufacturing of gas sensors and provide basic gas sensitivity information, as well as aluminum-doped graphene or gallium-doped graphene as a potential candidate for resistance chemical sensors for GIS internal fault diagnosis.
2. Computational Details
The present work conducted first-principle calculation by Dmol3 quantum chemistry module from Materials Studio [19–21]. Perdew Burke ernzerho (PBE) function of the generalized gradient approximation (GGA) is used for managing the electron exchange relation [22]. Besides, double numerical plus polarization (DNP) is selected to be the atomic orbital basis group. The maximum atomic displacement, energy convergence accuracy, orbital tailing, and maximum force are set to 5 × 10⁻³ Å, 1.0 × 10⁻⁵ Ha, 0.005Ha, and 0.05 eV/Å, respectively [23, 24]. Also, to ensure precision in calculating total energy, this work established global orbital cut-off radius and self-consistent field error at 4.5 Å and 1.0x10⁻⁶Ha, respectively, Additively, a 2 × 2 × 1 Brillouin
3. Results and Discussion
3.1. The Optimization of Al-Doped Graphene, Ga-Graphene, NF3, and N2O
Firstly, the adsorption characteristics of the aluminum and gallium atoms onto the graphene surface are discussed through the formation energy (
Formation energy of Al- and Ga-doped Gra at T, B, H, and R sites.
Figure 1 presents optimal geometry for aluminum-doped graphene, gallium-doped graphene, NF3, and N2O, with bond angle and bond length being expressed as
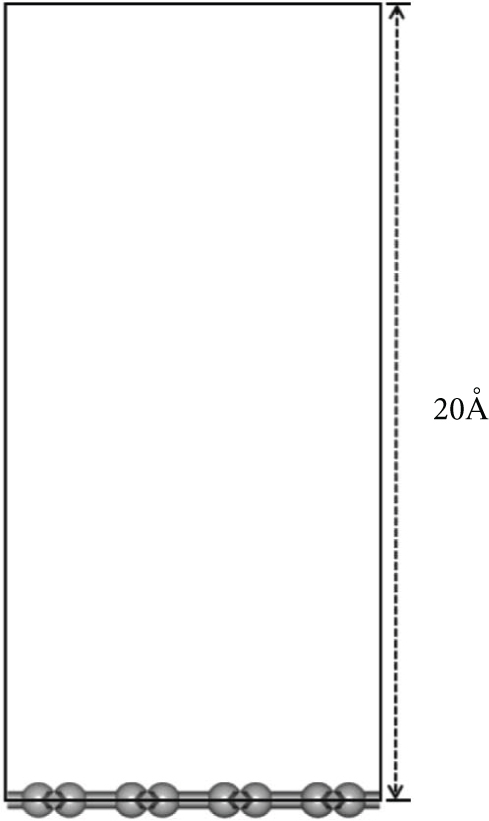
Geometry optimization structure of Al- and Ga-doped graphene, N2O, and NF3 ((a) side view of Al-doped graphene; (b) top view of Al-doped graphene; (c) top view of Ga-doped graphene; (d) N2O; (e) NF3).

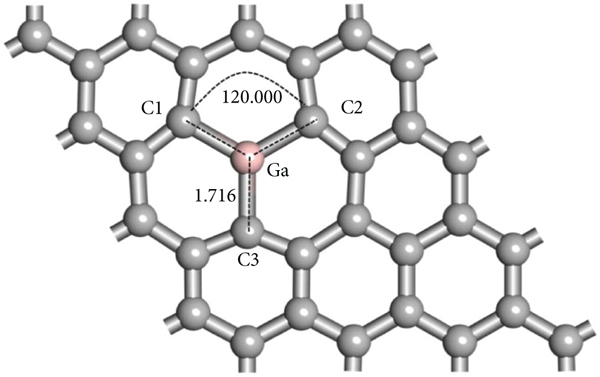
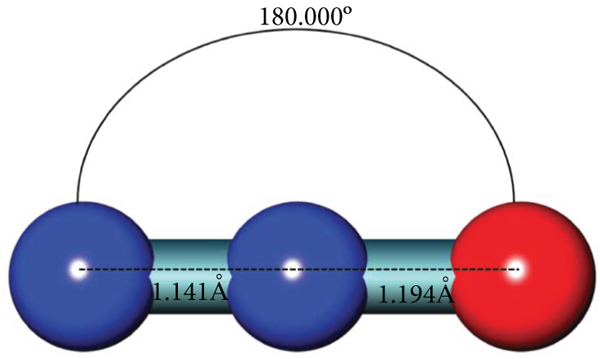

Figure 2 shows the TDOS for graphene, Al- and Ga-doped graphene. The structural properties of doped-graphene are further analyzed through TDOS. Contrast undoped graphene, it is known that the charge distribution of TDOS increases remarkably near the Fermi level after doping aluminum and gallium relative to intrinsic graphene, suggesting that aluminum and gallium doping enhances graphene structure conductivity.
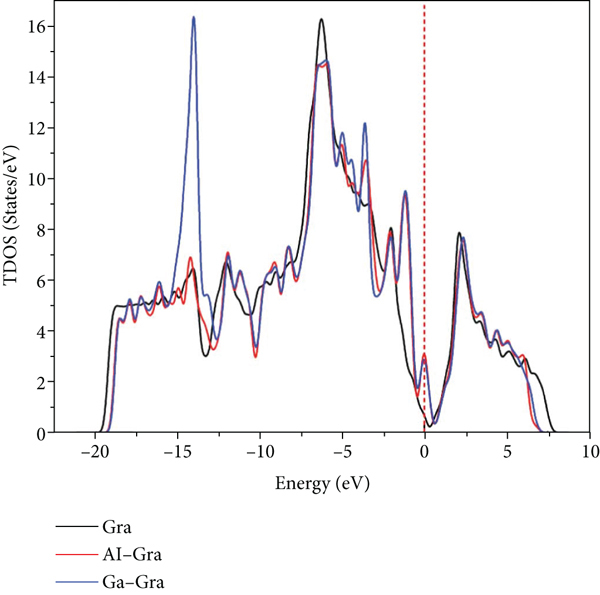
The TDOS configuration of graphene, Al- and Ga-doped Graphene.
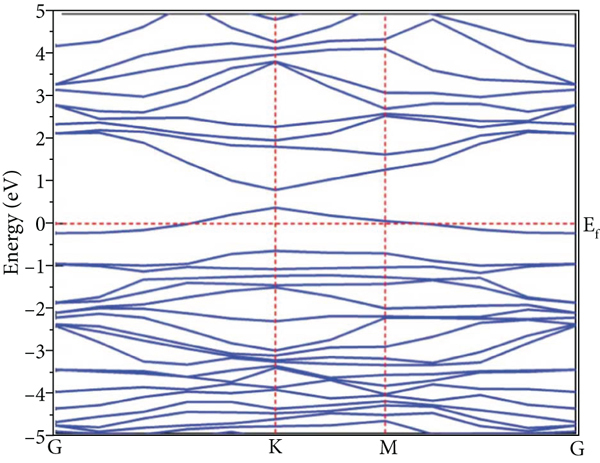
The band structure of intrinsic graphene is shown in Figure 3(a). It can be seen from the figure that the valence band and conduction band are almost tangent at the Fermi energy level, and the band gap is 0.005 eV, approaching 0 eV. However, after doping aluminum atoms, as shown in Figure 3(b), the valence band moves up and intersects with the

The band structure of undoped graphene, Al- and Ga-Graphene ((a) Undoped Graphene; (b) Al-Graphene; (c) Ga-Graphene).


3.2. The Adsorption Properties of NF3 on Aluminum-Doped Graphene
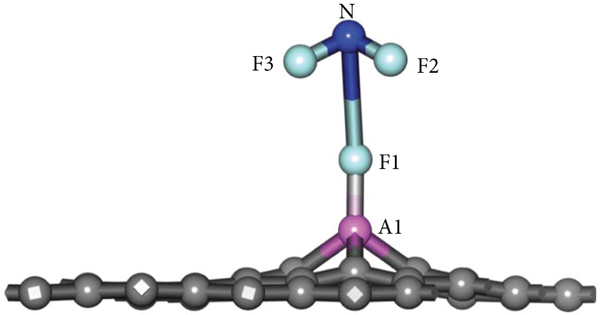
Different original approach sites for NF3 on aluminum doped sites were calculated for obtaining adsorption structure with the highest stability to further analyze the adsorption characteristics of aluminum-doped graphene on target gas. A characteristic adsorption structure is obtained following optimization. Figure 4 shows its top view and side view. Table 2 displays the charge transfer and adsorption energy, together with structural parameters.

Adsorption configuration of NF3 adsorbed on Al-Graphene: (a) top view; (b) side view.
The Ead, Qt, and structural parameters of the NF3 adsorbed on Al-Graohene.
As observed from the adsorption structure in (Figures 4(a) and 4(b)). The bond length formed by A1-F1 is 1.689 Å, and the number of electrons transferred from aluminum-doped graphene surface onto NF3 reaches 0.291e. Noteworthily, the NF3 structure alters the following adsorption, among them, the F1-N bond length increases to 3.072 Å, and the angle of F1-N-F2 becomes 75.591°. The
Figure 5(a) shows the TDOS for NF3 on aluminum-doped graphene surface. The TDOS showed significant changes at -14 eV, -9.2 eV, -7.3 eV, -5.4 eV, -3.4 eV, and other positions when compared with the nonadsorbed gas. Due to the outermost electrons of atoms contributing the most during adsorption, just PDOS for Al-3p, F-2p, and N-2p is discussed. From the PDOS in Figure 5(b), we can see that for the above orbitals, their overlapped peaks can be seen at approximately, -9.3 eV, -7.3 eV, -3.9 eV, Fermi level, and 5.2 eV. PDOS and TDOS analyses implicit that there are great interaction between NF3 and aluminum-doped graphene.

TDOS before and after NF3 adsorption and PDOS of the main interacting atoms ((a) TDOS; (b) PDOS).

Figure 6 displays the difference in electron density of NF3 adsorbed onto aluminum-doped graphene surfaces from different sides, in which the red and blue areas indicate elevated and declined electron density, respectively. The post-gas adsorption charge distribution is analyzed intuitively based on the difference in electron density. From Figure 6, it shows that the red area around the F atom shows that electrons are received, while the blue area around the N atom, Al atom, and C atom indicates that electrons are lost due to the reduction in electron density. Gas molecules are suggested to play the role of electron acceptors, while Al-Graphene is the electron donors. Therefore, NF3 molecules bring drastic changes in electron density to the surface of aluminum-doped graphene.

The charge difference density of NF3 adsorbed on Al-Graphene ((a) F1 and F2 atom section; (b) F3 atom section).

Collectively, based on the structural parameters of DOS, adsorption energy, and charge transfer, together with the difference in NF3 electron density adsorbed on aluminum-doped graphene, it is obvious that the interaction between NF3 and aluminum-doped graphene is very severe.
The band structure of aluminum-doped graphene without adsorbed gas exhibit in Figure 7(a). Figure 7(b) exhibit the band structure of NF3 molecules adsorbed on aluminum-doped graphene surface. From above, it is known that the band structure of aluminum-doped graphene has an obvious band gap near the

The band structure of Al-Graphene and NF3 adsorption on Al-Graphene ((a) Al-Graphene; (b) NF3-F-Al-Graphene).

3.3. The Adsorption Properties of N2O on Aluminum-Doped Graphene
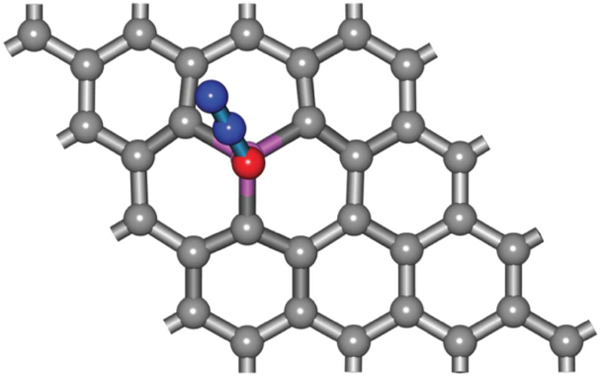
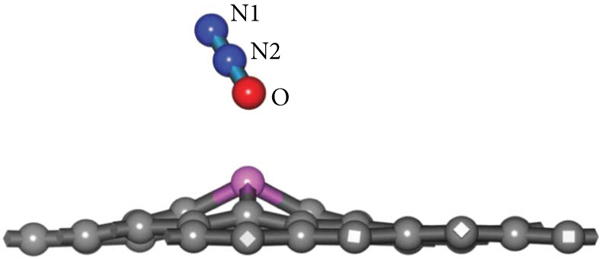
Gas molecules approach the aluminum-doped graphene surface with different atoms for the adsorption of N2O. 3 characteristic adsorption structures are acquired following geometric optimization, according to Figure 8, the parameters of the above configurations are exhibited in Table 3. Figures 8(a) and 8(b) exhibits top and side view for M1 configuration. N2O is close to the doped surface with an N1 atom, and the

Adsorption configuration of N2O adsorbed on Al-Graphene ((a) M1 top view; (b) M1 side view; (c) M2 top view; (d) M2 side view; (e) M3 top view; (f) M3 side view).


The Ead, Qt, and structural parameters of the N2O-adsorbed Al-Graphene.
Figures 8(c) and 8(d) exhibits side and top view for M2 configuration. N2O is close to the doped surface with an N2 atom, and the
The side and top views for the M3 configuration are displayed in Figures 8(e) and 8(f). N2O is close to the doped surface with the O atom, and the
TDOS for M2 configuration is exhibited in Figure 9(a). When N2O molecules are adsorbed onto an aluminum-doped graphene surface, there are obvious changes around -12.07 eV, -11.01 eV, -5.71 eV, and 0.89 eV. Due to the outermost electrons of atoms contributing the most to adsorption, this work only analyzes PDOS for Al-3p, N-2p, and O-2p. From PDOS observed in Figure 9(b), N-2p together with O-2p orbital peaks coincide around -12.15 eV, -10.97 eV, -10.25 eV, -5.62 eV, and 0.86 eV. According to PDOS, potent chemisorption of N2O with aluminum-doped graphene was seen. At the same time, considering that the N-2p orbital contributes the most to the adsorption process, the N2O adsorption structure shows extremely high stability within the M2 configuration.

TDOS before and after N2O adsorption and PDOS of the main interacting atoms ((a) TDOS; (b) PDOS).

The difference in electron density of M2 configuration is exhibited in Figure 10. Red and blue areas stand for elevated and declined electron densities, respectively. O and N1 receive charge in the adsorption process, and the charge close to the N2 atom declines. There is also an increase in electron density on the aluminum-doped graphene surface. According to the distribution on electron density, N2O gets electrons.
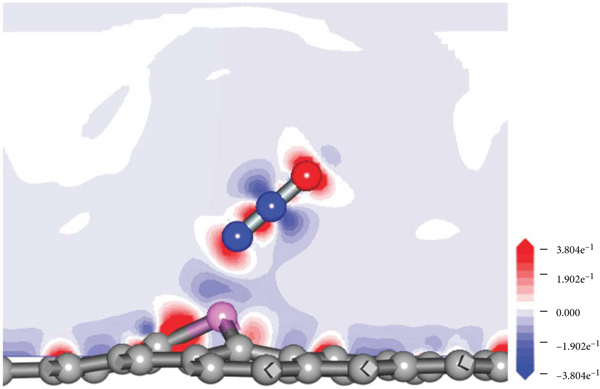
The charge difference density of N2O adsorbed on Al-Graphene.
The band structure of aluminum-doped graphene without adsorbed gas exhibit in Figure 11(a). Figure 11(b) shows the band structure of N2O molecules adsorbed on aluminum-doped graphene surface. It can be seen that after adsorbing N2O, the energy gap of aluminum doped graphene decreases, the conduction band near the Fermi level becomes more smooth, and introduced new energy levels. Accordingly, the density of states near the
The band structure of Al-Graphene and N2O adsorption on Al-Graphene ((a) Al-Graphene; (b) N2O-N-Al-Graphene).

3.4. Prediction of Desorption of Aluminum-Doped Graphene
The decomposed components of SF6/N2 mixed gas can be desorbed from the sensing material surface under heating conditions. The
In which,
The desorption time of NF3 and N2O gas molecules at 375 K, 575 K, and 775 K is shown in Figure 12. The optimal desorption time of NF3 molecule at 775 K is

Desorption time at different temperatures.
3.5. Adsorption of NF3 and N2O Gases on Gallium-Doped Graphene
Since the number of outermost electrons of Ga atom is the same as that of Al atom, the doping of Ga atom is also considered. Its adsorption mode is the same as that of Al doped graphene, so only consider that NF3 molecules are close to Ga-doped graphene as F atoms, and N2O molecules are close to Ga-doped graphene as N atoms. As shown in Figures 13(a) and 13(b), NF3 molecules are adsorbed on Ga-doped graphene surface, the
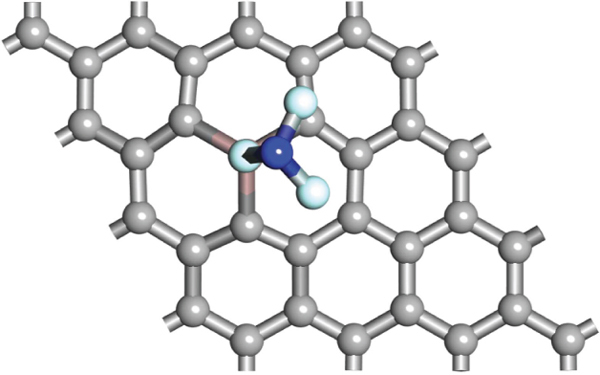
The adsorption configuration of NF3 and N2O adsorbed on Ga-Graphene ((a) X1 top view; (b) X1 side view; (c) X2 top view; (d) X2 side view).


The Ead, Qt, and structural parameters of the NF3 and N2O adsorbed on Ga-Graphene.
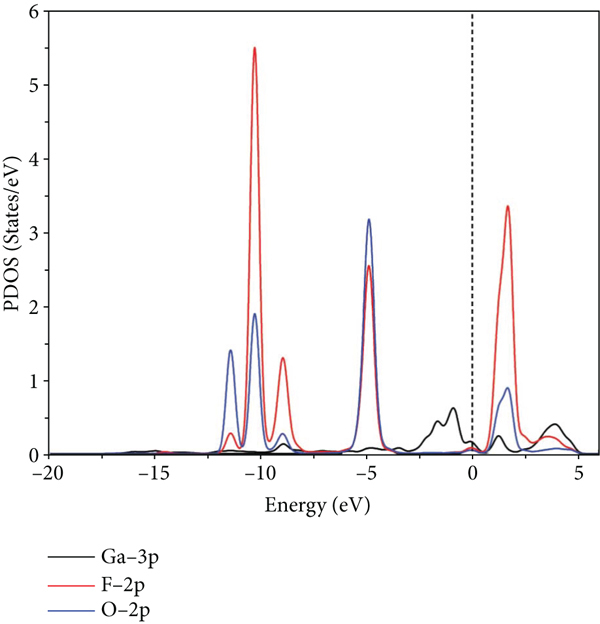
As shown in Figures 14(a)–14(d), it is the TDOS and PDOS of NF3 and N2O on Ga-doped graphene surface. For NF3 molecule, a new peak appears at the

The density of states configuration of NF3 and N2O adsorbed on Ga-Graphene ((a) NF3-TDOS; (b) NF3-PDOS; (c) N2O-TDOS; (d) N2O-PDOS).


Figures 15(a) and 15(b) shows the charge difference density of NF3 and N2O on Ga-doped graphene, respectively. It can be seen that after the adsorption of NF3 and N2O, the color near F atom turns red, indicating that the charge increases, and the color near N atom turns blue, indicating that the charge decreases. The charge near N1 atom and O atom in N2O molecule increases, and the electron concentration near N2 atom and graphene surface decreases, indicating that the gas obtains charge.

The charge difference density of NF3 and N2O adsorbed on Ga-Graphene ((a) the charge difference density of NF3 adsorbed on Ga-Graphene; (b) the charge difference density of N2O adsorbed on Ga-Graphene).

4. Conclusions
The adsorption characteristics of NF3 and N2O molecules on Al- and Ga-doped graphene surfaces were studied in this paper, for the sake of finding the resistance chemical sensor material for GIS internal fault diagnosis. Among them, the most likely adsorption mode of NF3 molecule is that F atom is close to Al-doped graphene. They have large charge transfer and
The present work sheds more light on the association of characteristic decomposition components of SF6/N2 gas mixture and Al- and Ga-doped graphene, and provides the theoretical foundation to adsorb characteristic decomposition components in SF6/N2 gas mixture onto Al- and Ga-doped graphene.
Footnotes
Conflicts of Interest
The authors declare that they have no conflicts of interest.
Acknowledgments
The authors would like to acknowledge the support of Science and Technology Research Program of Chongqing Municipal Education Commission (Grant No. KJZD-K202001505, KJQN202001503) and the Graduate Science and Technology Innovation Project of Chongqing University of Science and Technology (Grant No. YKJCX2120404).