
Abstract
Corn stover (CS) is mainly composed of three parts: pith (CSP), rind (CSR), and leaf (CSL). These parts have different lignocellulosic constituents and structural properties. Herein, biosorbents derived from individual corn stover constituents were prepared in an effort to determine the significance of each constituent for multipollutant removal. In this study, SEM, BET, XRD, FTIR, XPS, fibre composition, and contact angle measurements were used to characterize and analyse the physical and chemical properties of the three components of CS and to study their adsorption effects, adsorption isotherms, and kinetics. The lignocellulosic compositions of CSP and CSR were similar, the cellulose content in CSP and CSR was significantly higher than that in CSL, and the hemicellulose content of CSL was much higher than those of CSP and CSR. The minimum lignin content was found in CSP, and the maximum lignin content was found in CSR. The results show that each component had a certain adsorption effect on typical organic pollutants (antibiotics, oils, and dyes). CSP had the strongest oil adsorption capacity, CSR was more suitable for adsorbing antibiotics, and CSL had outstanding adsorption capacity for dye. The pseudo-second-order model and the Langmuir adsorption isotherm model could describe the adsorption processes well, and they consisted of monolayer adsorption accompanied by chemical adsorption reactions. The focus of this study was to provide references for selecting effective adsorbent precursors to remove organic pollutants from wastewater.
1. Introduction
In recent decades, many pollutants have been produced worldwide due to the development of industrialized economies and growth in populations. Organic matter is widely used, so organic pollution in the water environment is a serious issue. Among these organics, oils, antibiotics, and dyes are most commonly found. Oil spills occur during natural seepage, extraction, transportation, refining, and consumption [1]. An oil layer on water surfaces hinders photosynthesis and oxygen exchange, causes harm to aquatic animals and plants, affects human activities and health, and may even cause cancer and mutagenicity in humans. Antibiotics are commonly used in humans and veterinary medicine to treat diseases and to promote the growth of aquaculture and livestock [2, 3]; however, they are only partially metabolized in organisms, so up to 80-90% of the parent compounds and/or metabolites are excreted [4]. These compounds may enter the environment through the application of biosolid manure in farmland, grazing of livestock, or discharge of wastewater [5, 6]. Based on market sales data, China is the largest producer and user of antibiotics in the world [7]. According to a study, 54,000 tons of antibiotics are excreted by humans and animals each year, and nearly 53,800 tons end up in the receiving environment [8]. Therefore, the current situation for pollution is not encouraging. Organic dyes are also used in many industries, such as textiles, paints, printing, and plastics. It is estimated that more than 10,000 kinds of commercial dyes are produced annually, totaling more than
Many methods have been established for the removal of organic pollutants, such as oxidation [11], precipitation [12], adsorption [13], electrochemical techniques [14], and ion exchange [15]. Adsorption has been considered a promising method for removing contaminants due to comprehensive economic and environmental considerations [16]. Therefore, it is of great significance to develop a low-cost and efficient adsorbent for the removal of organic pollutants from wastewater.
Agricultural waste has always received extra attention because it is an attractive starting precursor because of its abundance, low-cost, biodegradable properties, and special structures, such as its large specific surface area, unique porosity, and rich functional groups in pores [17]. Agricultural wastes can be used in their natural form or modified with various treatments [18]. The chemical composition, morphological structure, and mechanical properties of biomass are essential criteria for selecting the best lignocellulose material [19, 20].
The production level of corn is one of the largest among the crops in the world and can result in a large quantity of stover waste after harvest. In developing countries, most of the stover is disposed of by direct dumping or burning in the field without effective utilization, which causes serious air pollution, such as haze, and damage to the land and the surrounding area [21–24]. This is a threat to the ecological environment. However, corn stover is a good resource for many fields, such as the paper industry [25], building material industry [26], adsorption material industry [27], and biofuel industry [28]. As an agricultural waste, corn stover is a promising resource for environmental technology used in the treatment of wastewater, since it is rich in cellulose, hemicellulose, and lignin, and the availability of specific functional groups (such as hydroxyl (-OH)) offers the potential to use them as adsorbents [29].
Corn stover has been used to effectively remove many contaminants, such as oil [30], metal ions [31], dyes [32], and other organics [33]. Previous studies indicated that the adsorption capacity of raw corn stover for dye reaches 4 g g-1 and approximately 4.3 g g-1 for gas oil [34]. The maximum level of removal of emulsified oil by raw corn husk, 56.33%, was achieved with a contact time of 60 min, a pH of 7-8, and a dose of 10 mL L-1 at 150 rpm. To date, however, corn stover is often used in whole form as a raw material for adsorbents. Different biomasses have different microstructures and physicochemical properties, and even the same biomass with different tissues and fractions has different microstructures and physicochemical properties, which can significantly influence adsorption capacities. Corn stover is mainly composed of three parts: the pith, rind, and leaves. Each part has different tissues, cell morphologies, and chemical compositions. The structure, composition, and characteristics of different parts of the corn stover cause unpredictable adsorption performance due to the different types of tissues and organs [35]. For instance, a study has shown that raw corn stalk has a lower capacity for Cu (II) ions than raw corn cob (0.113 mmol g-1) [36]. To effectively utilize agricultural waste and to generate larger economic benefits, each of the different parts of corn stover must be considered.
So far, there is insufficient research on the applications of corn polymers, fibres, and composites, with no study conducted on the impact of the physical, morphological, and mechanical properties of corn stover biomass on organic pollutant adsorption. The aim of this work is to report the characterization of the various natural parts of corn stover with the aim of exploring their potential in the development of biosorbents to remove antibiotics (sulfadiazine (SD)), oil (machine oil (MO)), and dyes (methylene blue (MB)) (Figure 1) from an aqueous solution. The main goal of this study is to observe the structural differences of the raw corn stover pith, rind, and leaf through characterizations, to help increase their utilization rates under realistic conditions, and to discuss their adsorption performances by studying the influence of contact time and initial concentration on the adsorption efficiencies for typical organic pollutants on corn straw. The adsorption kinetics and equilibrium isotherms were studied to analyse the adsorption mechanism. This research may provide valuable information on the physical and chemical characteristics and adsorption properties of different tissue fractions in corn stover and allow further application.
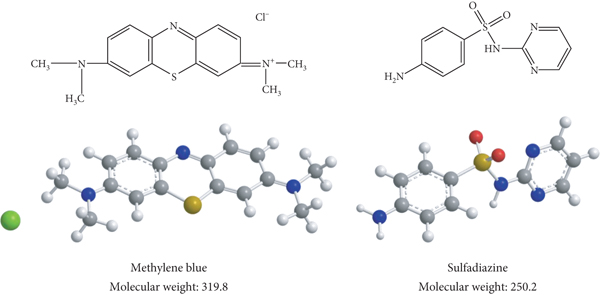
Methylene blue and sulfadiazine structural models.
2. Materials and Experimental Methods
2.1. Preparation of Materials
Corn stover was gathered from a farm located in Baise city, Guangxi province, China. The raw materials were cleaned with water and dehydrated in direct sunlight. The pith, rind, and leaf were manually separated from the corn stover and then converted to powdered materials by grinding and sieving, and these were named CSP, CSR, and CSL, respectively. The fractions with particle sizes passing through 20- and 60-mesh sieves were dried in an oven at 60°C for 24 h and used for subsequent analysis and experiments.
Sulfadiazine, acetonitrile, and methanol were used as HPLC grade. The oil was purchased from Shell Helix (HX7 5W-40), with a density of 0.843 g cm-3 and a viscosity of 14.45 cp at 20°C. The other chemicals involved in these experiments were purchased from Sigma-Aldrich. The Milli-Q water was utilized (18.2 MΩ-cm).
2.2. Chemical Composition Analysis
The chemical constituents of CSP, CSR, and CSL were determined using ASTM standard methods. Cellulose (ASTM D 1103-55T), hemicellulose (ASTM D 1104-56), and lignin (ASTM D 1106-56) were studied [37].
2.3. Characterization
Scanning electron microscopy (SEM) (Gemini SEM 300, ZEISS, Germany) was used to characterize the surface morphology of the corn stover pith, rind, and leaf at different magnifications. An ASAP 2020 instrument (Micromeritics, USA) running at 77 K was used to determine the BET surface area and pore size of the samples from nitrogen adsorption isotherms. The tests used the BET formula,
The crystal structures of the three samples were measured by X-ray diffraction (XRD) (D8 ADVANCE, Bruker, Germany) using a Cu target with an incident wavelength of 0.154056 nm, scanning range of 5-60° and speed of 2°/min. The crystallinity index (CrI) is a parameter commonly used to quantify the proportion of crystallization area in cellulosic materials and was determined with the following equation [38]:
The contact angles (CA) on the surfaces of the samples were measured with a dynamic contact angle analyser (OCA15EC, Data physics, Germany). The water contact angle (WCA) and the oil contact angle (OCA) were determined by the sessile drop method. Briefly, the sieved sample was adhered to the surface of a glass sheet with double-sided tape to obtain a uniform covering. After dripping 5 μL of water or oil droplets onto different positions of the corn stover specimens, the contact angles were automatically calculated with the circle fitting method.
2.4. Sorption Experiments
2.4.1. Antibiotic Sorption
Sulfadiazine is poorly soluble in water (the solubility is 200 mg/100 mL at 37°C). To ensure the accuracy and reliability of the test data, a stock solution of sulfadiazine (100 mg L-1) was prepared in methanol prior to use. All the batches of test solutions were prepared with the stock solution and transferred to 25 mL glass vials equipped with screw caps for sorption. In each test, a 10 mL aliquot of the antibiotic solution was placed in a 25 mL chromatographic sample bottle containing a 0.01 g sorbent. The vials were sealed immediately with a cap and placed on a shaker, then agitated at 150 rpm at 25°C for 24 h. The mixture in each bottle was immediately filtered through a 0.22 μm membrane (Millipore Co.) with a syringe to analyse the concentration by HPLC (Agilent 1100, USA). Formic acid (
2.4.2. Water and Oil Sorption
The sorption of oils, as well as water, by various tissue fractions, was studied according to the following procedure. The artificial oil spill was simulated by adding 150 mL of distilled water and a quantity of motor oil to a 250 mL glass beaker. Each tested sample (0.05 g) was put into a preweighed and labelled filter bag, sealed with hot melting, and then put into the solution. After the sorption was complete, the filter bag was lifted for 3 min to extract excess oil and then weighed. The sorption capacity per unit mass of adsorbent (g g-1) was calculated with the following expression:
2.4.3. Dye Sorption
A stock solution of MB (1000 mg L-1) was prepared, and the working solution was serially diluted during the experiments. In all batch sorption experiments, 0.01 g of adsorbent was placed in a centrifuge tube containing 50 mL of MB solution, which was stirred on a shaker at 150 rpm for a specific test time. The initial concentration of MB used for the sorption kinetic study was 100 mg L-1. The effect of the initial concentration of methylene blue was studied over the range of 25-300 mg L-1. After sorption, the solutions were centrifuged at 10,000 rpm for 15 min, and the supernatants were analysed at 665 nm using a UV-visible spectrophotometer (Shimadzu UV-2600, Japan). The calculation method for adsorption capacity is the same as formula (2).
2.5. Sorption Kinetic Models
To determine possible mechanisms and the effects of rate-controlling steps on the sorption, CSP, CSR, and CSL were contacted with pollutants at different intervals, and then, the sorption kinetics were studied. Four models were used to describe the time dependence of organic contaminant adsorption onto the samples. The expressions and parameter definitions are shown in Table 1. The Lagergren pseudo-first-order kinetic model is one of the most commonly used equations for describing the physical adsorption process of adsorbents in an aqueous solution [19, 20]. The pseudo-second-order model is consistent with chemical adsorption being the rate-controlling step. Elovich assumed that the active sites of the adsorbent are heterogeneous and therefore exhibit different activation energies for chemisorption [39]. Intraparticle diffusion (usually the rate controlling step) is a possible method for moving ions from solution onto an adsorbent, and it describes the process of pollutant adsorption in the pores of the sample [40].
Sorption kinetic model expressions and parameter definitions.
2.6. Sorption Equilibrium Isotherms
The sorption isotherm model provides effective information about the mechanism of adsorption, the surface properties of the adsorbent, and the affinity between the adsorbent and the adsorbate. The most frequently utilized models are the Langmuir and Freundlich adsorption isotherms. The Langmuir isotherm model explains monolayer homogeneous sorption based on the assumption of a fixed number of sorption sites, and each site can hold only one sorbate molecule (the sorbed layer is one molecule in thickness). All sites are equivalent, and there is no interaction between the sorbed molecules [36]. The Langmuir model can be described with the following equation:
The Freundlich isotherm model is an experimental model, usually expressed by the following equation:
It can also be expressed in a logarithmic form as the following equation:
3. Results and Discussion
3.1. Effect of Fractionation on the Physiochemical Properties of Corn Stover
3.1.1. Compositions of Corn Stover Fibres
Based on the structures, corn stover can be divided into the leaf, rind, and pith. Through observation and composition analysis, it was found that the structures and chemical compositions of the parts are different (Figure 2(a)). The CSP structure is made of flexible material wrapped with long fibres, and it is very light. CSR has the highest mechanical strength. The structures of CSR and CSL are compact, mostly in the form of longitudinal fibres, and the state of the CSP is relatively loose and has a certain elasticity [41]. The weight proportions of the parts in corn stover are also different, and CSR and CSP account for 60% and 20% of the total weight, respectively.

(a) Extraction and preparation of corn stover biomass; (b) content of different parts of corn stover.

Corn stover is mainly composed of cellulose, hemicellulose, and lignin [42], and the lignocellulose compositions of various parts of CS are shown in Figure 2(b). Because of the different saccharification rates in different parts of the plant during the growth process, the content of cellulose and hemicellulose in different parts is different. Cellulose was the main component in the biomass of the straw. The lignocellulosic compositions of CSP and CSR were similar; the cellulose content in CSP reached 40.5%, and that in CSR was nearly 40%, which was significantly higher than that in CSL. The hemicellulose content of CSP and CSR is similar, but the hemicellulose content of CSL was much higher than those of CSP and CSR, reaching 38.8%. Lignin provides mechanical strength to the cell walls, which plays an important role in increasing the compressive strength of the stem and strengthening the cell wall. Lignin is also beneficial for enhancing the longitudinal grooming ability of plant stems; thus, the lignin content of CSR and CSL is relatively higher than that of CSP. The minimum lignin content of CSP was 3.72%, and the maximum in CSR was 6.85%. This is consistent with previous results [43]. The cell wall of CSR has a higher degree of lignification, and the lignin content of CSL and CSP is lower. From the chemical compositions determined in these experiments, the cellulose content in CSP was the highest, the hemicellulose content in CSL was the highest, and the lignin was mainly concentrated in CSR. It can be inferred that the tightness of the fibre bundle structure and the lignin content exhibit a positive correlation. However, cellulose contains a variety of active groups, and the high content of cellulose makes it easier to apply modifications to prepare adsorption materials, so it is speculated that CSP is more suitable for chemical modification. Studying the chemical composition of a material is the first step for exploring adsorption capacity, as it allows the detection of raw material variability, processes of optimization, and establishment of quality parameters.
3.1.2. Morphological Characteristics
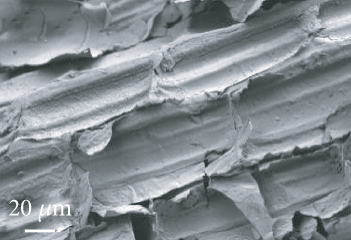
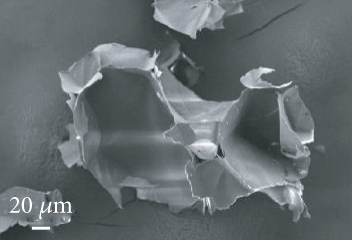
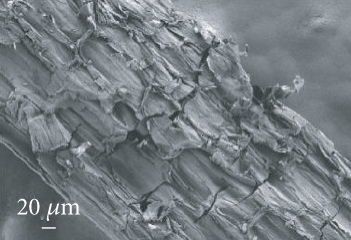
SEM images of the three fractions of corn stover are shown in Figure 3. The structures are divided into two parts: fibrous and scattered small particles. The bar is the internal meridian of CSP, while the block-shaped CSP is composed of slices that are similar to a honeycomb porous structure. This may be the reason for its elasticity. The outer part, CSR, displayed well-ordered and intact fibres and showed more fibre cells under the epidermis than did CSP and CSL. With different morphologies, CSL had a relatively rough surface compared with the other two parts. The coarse and disordered fibres contained in CSL could increase the pore volume and external surface area of the material [22–24].

SEM photographs of corn stover pith (a–c), rind (d–f), and leaf (g–i) at different magnifications.


3.1.3. BET
The specific surface areas and porosity characteristics of CSP, CSR, and CSL are summarized in Table 2. The surface areas were found to be 3.80 m2 g-1, 1.25 m2 g-1, and 1.37 m2 g-1 for CSP, CSR, and CSL, respectively. The pores can be divided into three size classes based on the pore diameters, and these classes are macropores (>50 nm), mesopores (
The porosity characteristics of corn stover pith, rind, and leaf.
3.1.4. XRD and FTIR
For the XRD patterns (Figure 4(a)), the results showed that the main peaks for CSP, CSR, and CSL were located at 21.55°, 21.80°, and 21.92°, respectively. Similarly, both CSR and CSP revealed a minor broad peak at 2θ equivalent to 15.74°, but CSL shows a strong broad peak at 2θ equivalent to 16.16°. The crystallinity of cellulose is one of the most important characteristics contributing to its physical, chemical, and mechanical properties, and the crystallinity index (CrI) has been used to interpret the cellulose structure [45]. Calculated with formula (1), the crystallinity indices (CrIs) of the raw materials CSP, CSR, and CSL were 50.6%, 50.9%, and 46.1%, respectively. It can be seen from the calculations that the relative crystallinity of CSR is slightly higher than those of CSP and CSL.
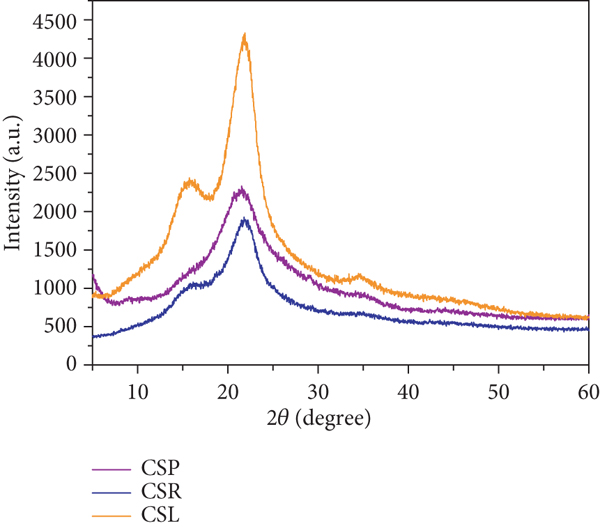
XRD (a) and FTIR (b) spectra of corn stover pith, rind, and leaf.

FTIR was used to analyse the surface functional groups of all samples. The typical FTIR spectra of raw corn stover fibre over the range from 4000 to 400 cm-1 are presented in Figure 4(b). Both CSP and CSR exhibited roughly the same trends. In the high-frequency region, the band at 3323~3421 cm-1 is associated with the stretching vibration of the O-H bond in the molecules, characteristic of the presence of hydrophilic groups [2]. For the three tissue fractions of corn stover, the absorption peaks are attributed to the C-H bonds of alkanes, appearing from 2900 cm-1 to 2600 cm-1 [46]. This suggests the presence of -CH3/-CH2 groups on the corn stover surface, and these were the characteristic absorption peaks of cellulose [47]. This is consistent with the results of the composition analyses, in which the cellulose content in CSL is less than that in CSP and CSR. The absorption band at 1704 cm-1, showing high intensity in the spectra, is assigned to C=O stretching vibrations. There are also some absorption peaks within the range 2000-1550 cm-1, which indicates the presence of lignin in corn stover [47]. The absorption band at approximately 1034 cm-1 might correspond to the stretching vibration of C-O due to the presence of hemicellulose [22–24]. The glycosidic linkages in cellulose are indicated by the peak at 896 cm-1. Figure 4(b) illustrates that different compositions of corn stover have different peak intensities. CSP has more C=C bonds, CSR has more C-H bonds, and CSL has lower peak intensities than the other two parts, which confirms that different parts have different chemical compositions [48].
3.1.5. XPS
X-ray photoelectron spectroscopy (XPS) characterization was used to further characterize the functional groups of the samples. The surface element compositions (atomic fraction, %) determined by XPS wide scan spectra are shown in Figure 5(a). As with the FTIR results, the compositions of CSP and CSR are approximately the same, while that of CSL differs. The high-resolution C1s and N1s spectra of the three parts of corn stover were studied to identify the differences in surface chemical binding. The C1s high-resolution spectra of CSP, CSR, and CSL are shown in Figure 5(b). The C1s spectra were fitted to three components, and the most intense peak at 284.9 eV is related to C-C/C-H bonds in hydrocarbons, particularly methyl bonds in straw materials. The band at approximately 286.3 eV is usually attributed to C-O bonds in hydroxyl (C-OH) and ether (C-O-C) groups. With the presence of amino groups, there is also a contribution of C-N bonds to a peak at approximately 286.3 eV. CSL has the lowest fraction at approximately 286.3 eV, which is consistent with the results of chemical composition and FTIR analyses. The relatively weak bands ranging from 287.7 to 288.0 eV are assigned to carbonyl groups (C=O) and O-C-O linkages of ketones and carbonyl groups in the lignocellulose structure, especially that of lignin [49]. The N1s high-resolution spectra for the three samples and their curve fitting analyses are shown in Figure 5(c). The N1s high-resolution spectra were fitted with two components, which are assigned to free amino groups (-N(CH)2/-NH2) at approximately 400.0 eV and protonated amino groups (-N(CH3)3 +/-NH3 +) at approximately 401.7 eV. Table 3 summarizes the atomic fractions of free and protonated groups on the surfaces of the samples. Most amino groups on the surfaces of CSP, CSR, and CSL are free amino groups, accounting for 58.4%, 70.7%, and 86.1% of the amino groups present, respectively. The atom fractions of protonated amino groups (-N(CH3)3 +/-NH3 +) on the surface of CSP, CSR, and CSL are 41.6%, 29.3%, and 13.9%, respectively. As protonated amino groups can effectively remove anions through electrostatic interactions, CSR and CSL, with fewer protonated amino groups, exhibit poor anionic adsorption performance [50].

The XPS spectra of three parts of the corn stover.


Identification and quantification of C-groups and N-groups on the surfaces of the three samples.
aBinding energy (eV); bAtom fraction (%).
3.1.6. Contact Angle Measurements
Surface hydrophobicity is one of the most important properties for adsorption because water molecules can compete with adsorbates during the sorption process. Figure 6 shows the water contact angle (WCA) results for CSP, CSR, and CSL, with values of 58.8°, 74.5°, and 78.2°, respectively, and the oil contact angles (OCAs) of 52.8°, 57.6°, and 31.4°, respectively, which show that CSP, CSR, and CSL are all amphiphilic (with WCA and OCA below 90°). The WCAs of CSR and CSL are obviously larger than that of CSP. The poor hydrophobicity of pith is due to the flat surface and the greater proportion of cellulose, which is hydrophilic and has abundant hydrophilic hydroxyl groups that promote the wetting with water. The OCA of CSP and CSR are similar. CSL is the most lipophilic, which may be related to the lower content of cellulose and the low surface energy. It can also be seen from the FTIR results that the structure of CSL has fewer hydrophilic hydroxyl groups, so its hydrophobicity and lipophilicity are greater than those of CSP and CSR.
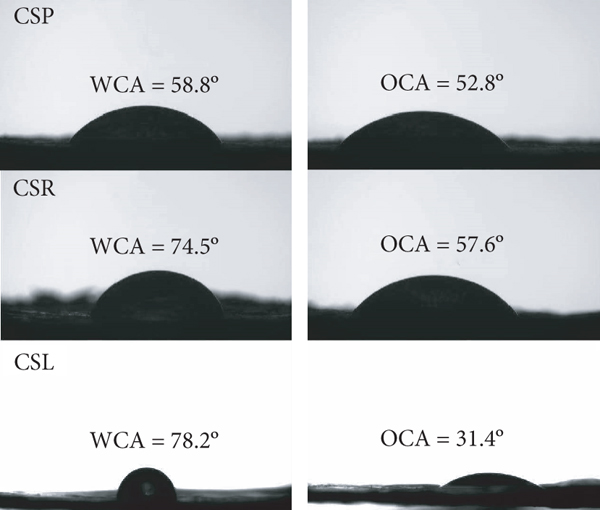
The water and oil contact angles of corn stover pith, rind, and leaf.
3.2. Adsorption Capacity
As shown in Figure 7, the adsorption trends of different parts of CS for antibiotics, oils, and dyes are significantly different. Experimental tests showed that there was little difference between CSR and CSP for the adsorption of low-concentration antibiotics (1 mg L-1), but CSL showed a better adsorption capacity. For the adsorption of high-concentration antibiotics (10 mg L-1), the adsorption capacity of CSR can reach 1.067 mg g-1, which is 1.67 times higher than that of CSL. The three fractions showed similar adsorption capacities for pure water and oil. CSP and CSL can effectively adsorb oil and water, possibly because they have relatively high surface areas and pore volumes, with which to store more oil and water molecules. They have more pores, and the buoyancy obtained makes it easier to absorb surface oil slicks. However, the total pore volume of CSR is only 0.000684 cm2 g-1, which makes it difficult to absorb viscous liquids such as water. CSL has obvious advantages over the other fractions in adsorbing methylene blue. For the 100 mg L-1 methylene blue solution, the adsorption capacity of CSL reached 85.48 mg g-1, which was 1.71 times that of CSP and 2.31 times that of CSR. The reason is related to their unique surface characteristics, and based on XPS analysis, CSL, with fewer protonated amino groups, may have better cationic adsorption performance.

The adsorption capacities of different parts of the corn stover.


3.3. Adsorption Kinetics
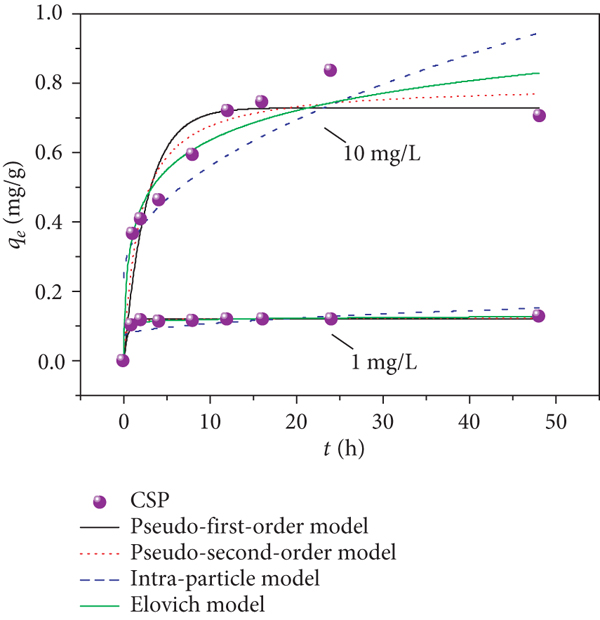
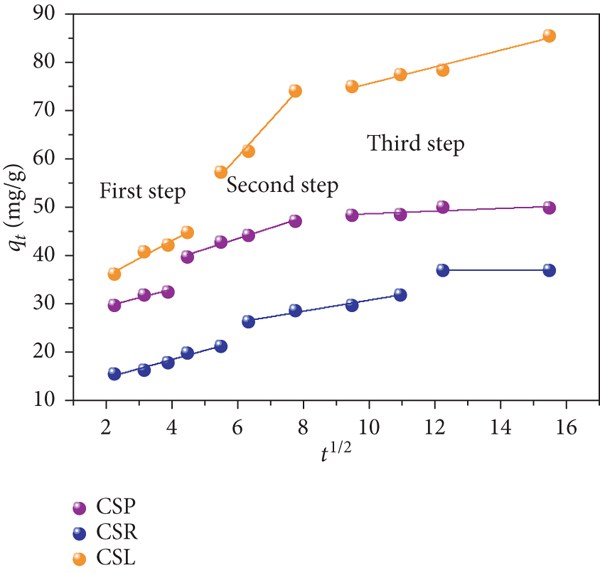
The plots of adsorption capacity versus time with different initial sulfadiazine concentrations and comparisons of adsorption of sulfadiazine by different parts of corn stover are shown in Figure 8. SD with a low concentration of 1 mg L-1 was quickly adsorbed within the first 2 h, which may be due to the occurrence of adsorption on the outer surface, and then, the adsorption equilibrium was reached at 4 h. The lower the pollutant concentration was, the higher the adsorption rate was. This result may occur due to the effective active sites enriched on the adsorbent surface during the initial process, which may contribute to the overall adsorption kinetics. There are usually three steps in the adsorption process: (1) the instantaneous adsorption stage, (2) the slow adsorption stage, and (3) the equilibrium stage [51]. Over time (i.e., in the slow adsorption stage), the decrease in adsorption capacity may be mainly caused by the gradual blockage of micropores and mesopores in the material, the gradual occupation of available adsorption sites, and the slow diffusion of pollutants into the pores of the material. For the 10 mg L-1 SD solution, fast adsorption by CSP and CSR occurred within 0-4 h, 4-24 h corresponded to the slow adsorption stage, and equilibrium was reached in 24 h. The adsorption by CSL was the fastest, and adsorption equilibrium could be reached within 16 h.
Adsorption kinetics of corn stover pith, rind, and leaf towards sulfadiazine (a, c, e) and methylene blue (b, d, f).


The kinetic data of two initial sulfadiazine concentrations were fitted to typical kinetic models, which are listed in Table 1, and the parameters obtained from these model fittings are given in Table 4. By comparing the
Kinetic parameters for different parts of corn stover in adsorption of sulfadiazine with two solution concentrations.
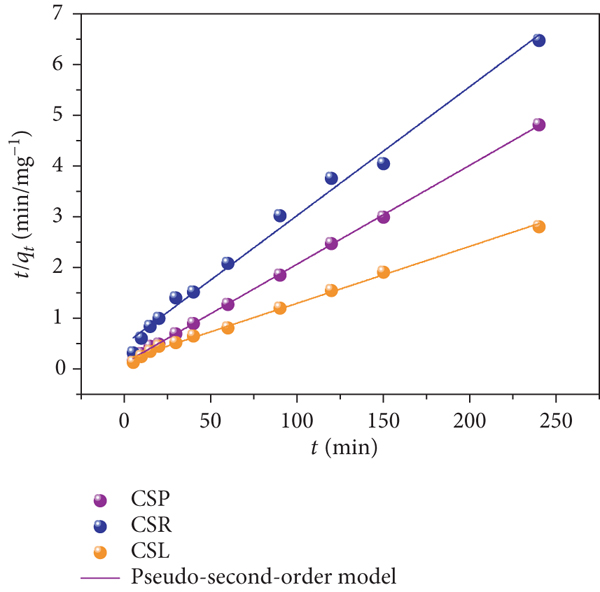
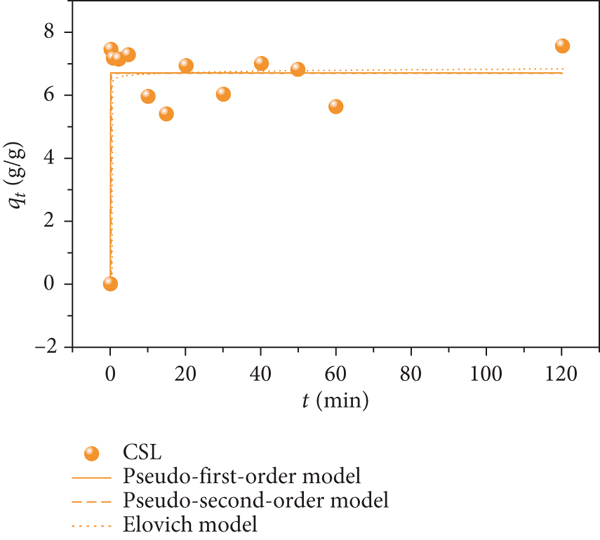
Figures 8(b), 8(d), and 8(f) show four MB adsorption kinetics on different parts of the corn stover. The concentration of methylene blue solution in the kinetic adsorption experiment was 100 mg L-1. The values of the constants for the kinetic models are shown in Table 5. The data showed good agreement with the pseudo-second-order kinetic models (
Kinetic parameters for the adsorption of methylene blue.
The plots of

Adsorption kinetics for corn stover pith, rind, and leaf with oil-water solutions at low initial concentrations (a, c, e) and high initial concentrations (b, d, f).


Kinetic parameters for adsorption of two concentrations of the oil-water solution.
3.4. Adsorption Isotherms
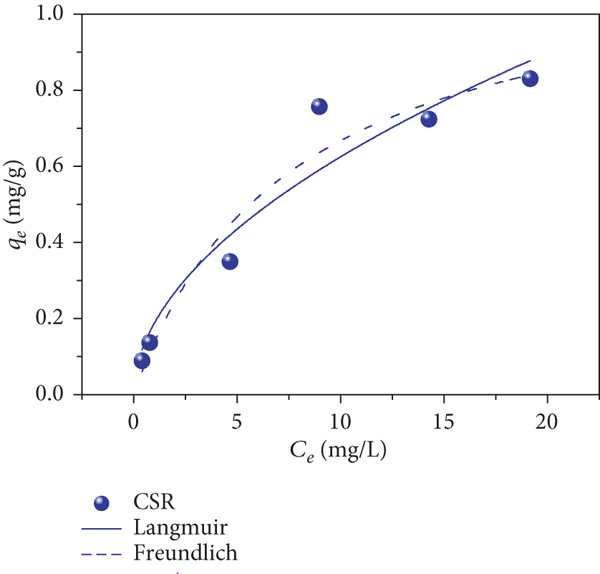
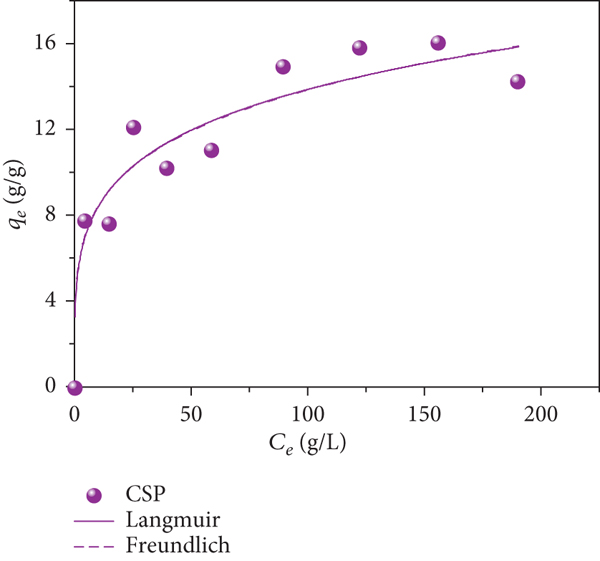
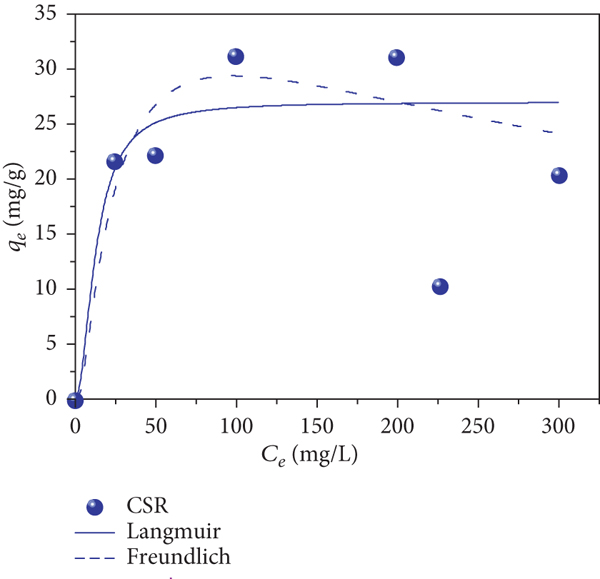
In batch sorption, the initial concentration of the target pollutant in the solution plays a key role as a driving force to overcome the mass transfer resistance between the aqueous and solid phases. Therefore, the amount of target pollutant adsorbed was expected to be higher with a higher initial concentration. Langmuir and Freundlich isotherm models are used to describe the adsorption of pollutants on biomass in the equilibrium phase. The capacity of the adsorbent can be predicted by plotting the adsorption data with the equilibrium isotherm model. Figures 10(a)–10(c) show that the adsorption trends in CSP, CSR, and CSL increase with the initial concentration of sulfadiazine in the range of 0.5-20 mg L-1. The parameters of the Langmuir and Freundlich models are shown in Table 7. For sulfadiazine, it is suggested that the maximum sorption capacities of the three different parts of corn stover followed the trend

Sorption isotherms for sulfadiazine (a–c), the oil-water solution (d–f), and methylene blue (g–i) with different parts of the corn stover.


Isotherm constants for adsorption of sulfadiazine, oil-water, and methylene blue onto different adsorbents.
For the oil-water solution and methylene blue adsorptions, the equilibrium data were usually fitted by Langmuir and Freundlich models (Figure 10). The
It is obvious that CSL has the best adsorption capacity for methylene blue, exceeding 80 mg g-1.
3.5. Adsorption Mechanisms
Contaminants can be sorbed to adsorbents by four possible effects: (i) physical adhesion (van der Waals’ force), (ii) pore filling effect, (iii) chemical interaction, and (vi) hydrophobicity [54]. Hence, the sorption performance is significantly related to structural characters and functional groups of adsorbents [55]. Based on the structural analysis by BET, XRD, FTIR, SEM, and contact angle measurements, and fitting results of the adsorption models, the possible adsorption mechanisms are elucidated in Figure 11.

The adsorption mechanisms of corn stover toward multipollutant.
Research indicates that the adsorbents with a large surface area and high porosity exhibit favorable adsorption towards dyes and oils [56]. As shown in Table 2, CSP and CSL had an excellent porous structure, which can increase in more adsorption sites. It is also pointed out that hydrophobicity plays a vital role in the interaction between the adsorbate and the adsorbent and is especially associated with oil sorption [57]. Both surfaces of CSP and CSL have good amphipathic (Figure 6), which could easily attract oil and MB. A large number of OH groups (Figure 4(b)) exist on the surface of lignocellulose adsorbents, which can easily form hydrogen bonding between adsorbents and adsorbates. Based on the above analysis, the pore filling effect, hydrogen bonding, van der Waals’ force, and surface hydrophobicity were considered to be combined actions in the adsorption process of oil and MB. For SD adsorption, although CSR has the lowest specific surface area and pore volume, its sorption capacity was the highest, which was primarily owed to the π-π interaction. The C-C/C=C proportion of CSR was greater than CSP and CSL (Table 3), which could provide a strong π-π linkage force for SD sorption [58].
4. Conclusions
The functioned agriculture wastes are able to effectively adsorb a variety of environmental pollutants. However, their performance can be influenced by many factors such as raw materials resource and raw material composition, requiring an understanding of the raw materials to be utilized effectively. This study highlighted the potential of corn stover fractions (CSP, CSR, and CSL) for the sorption of organic pollutants. The lignocellulose structural compositions of CSP and CSR are similar, and CSL has a higher hemicellulose content. The structure of CSP is fluffy, and CSR and CSL have higher crystallinity. CSP has the largest surface area, and CSL has the largest pore size. CSP is suitable for adsorbing oil molecules, and CSR can effectively remove antibiotics, especially at high concentrations (10 mg L-1), with capacities that can reach 1.067 mg g-1. CSL has outstanding adsorption capacity for methylene blue, and CSL has outstanding adsorption capacity for methylene blue of 85.48 mg g-1. Pseudo-second-order kinetics better fit the process of adsorption of organic pollutants on the sample, indicating that the adsorption process is a chemical adsorption. The equilibrium adsorption data of sulfadiazine on CSR and CSL are consistent with the Langmuir isotherm model. The adsorption of sulfadiazine by CSP is more consistent with the Freundlich adsorption model, which proves that the adsorption is multilayered. The process of stover adsorption of oil requires multiple analyses. For the adsorption of MB, the data are more consistent with the Langmuir isotherm model, that is, single-layer adsorption. The results of this work demonstrate that the breakdown of corn stover into its constituent fractions is an effective strategy for the adsorption of different organic pollutants and is conducive to the best use of all components of corn stover. In the future, we will further evaluate novel strategies for preparing modified materials derived from various parts of CS.
Footnotes
Data Availability
Data are available on request.
Conflicts of Interest
The authors declare that they have no conflicts of interest.
Authors’ Contributions
Dan Peng conceived and designed the experiments; Dan Peng and Min Deng wrote the paper; Dan Peng and Fan Ouyang performed the experiments, measurements, and characterizations; Lei Nie reviewed and edited the paper; and Sifang Kong contributed to the analysis tools.
Acknowledgments
This work was supported by the National Natural Science Foundation of China (No. 42007323), the Natural Science Foundation of Guangdong Province (No. 2018A030313363), the Shenzhen Science & Technology Project (No. SZIITWDZC2021A01, No. JSGG 20180504165551779), the Open Fund of Guangdong Provincial Key Laboratory of Petrochemical Pollution Process and Control (No. 2018B030322017), the High-Level Professionals and Innovative Teams (No. SZIIT2019KJ024, No. SZIIT2019KJ007), and the Characteristic Innovation Project of Guangdong Universities (2019GKTSCX092).