
Abstract
Endocrine-disrupting chemicals (EDCs) have attracted much attention in recent years. Graphene-based materials (GMs) have been deemed as excellent adsorbents for the removal of EDCs. The objective of the present study was to understand how the cationic surfactants (CTAB; cetyltrimethylammonium nitrate) affect the adsorption of EDCs (17α-ethinyl estradiol (EE2) and bisphenol A (BPA)) on graphene oxide (GO), reduced graphene oxides (RGOs), and the few-layered commercial graphene (CG). It was observed that the presence of CTAB showed different effects on the adsorption of EDCs to different GMs. The adsorption of EDCs on GO was enhanced because of the enhanced hydrophobicity of GMs after the adsorption of CTAB and the newly formed hemimicelles by the adsorbed CTAB, which could serve as the partition phase for EDCs. Moreover, the electron donor-acceptor interaction and cation bridging effect of the –NH4 + group of the adsorbed CTAB between EDCs and GMs could also enhance the adsorption of EDCs to GMs. With the increase of the extent of GM reduction, the adsorption enhancement by the presence of CTAB weakened. This could be attributed to the competition and pore blockage effect caused by the adsorbed CTAB. It is worth noting that the enhancement of CTAB on the adsorption of BPA to GMs was more profound than that of EE2. This is likely because the pore blockage effect plays a less important role in the adsorption of BPA due to its smaller molecular diameter and deformable structure.
1. Introduction
Endocrine-disrupting chemicals (EDCs), which are a class of the emerging contaminants, have been frequently detected in the aquatic environment in recent years [1–5]. They are capable of disturbing the physiological hormone systems of aquatic animals and human beings and increasing the risk of cancer, even at trace levels once ingested, and finally threaten the balance of the ecosystem [6, 7]. Thus, their transport and fate in the environment have received much attention.
Graphene-based materials (GMs), such as graphene oxide (GO), reduced graphene oxide (RGO), and graphene, have been applied in many fields due to their unique properties and have become an important member of the carbon nanomaterial family in recent years [8–12]. They have been proven to be excellent adsorbents for EDCs due to their large surface area, high hydrophobicity, and abundant functional groups [13–20]. For example, Jiang et al. [14] reported that 17β-estradiol showed strong adsorption affinities to GO, and the adsorption capacity of GO could reach 149.4 mg g-1, which was much higher than that of single-walled carbon nanotubes and multiwalled carbon nanotubes. Jin et al. [15] reported that the reduction of GO could enhance its adsorption affinity towards 4-n-nonylphenol and BPA, which was attributed to the stronger hydrophobicity and π electron density of RGO.
The adsorption affinities of EDCs to GMs could be affected by solution chemistry in the real aquatic environment. It was reported that cationic surfactants have been widely used in industrial manufactures and personal care products [21–26], and the concentration in the aquatic environment, especially in waste water, could reach mg L-1 levels [22–24]. Thus, the coexisting cationic surfactant would affect the adsorption behavior of EDCs to GMs. The cationic surfactant could be adsorbed on the graphene surface via electronic attraction and hydrophobic interactions ([27]); thus, it could compete for the adsorption sites and decrease the adsorption of EDCs on GMs. With the concentration of the cationic surfactant increasing, it might form hemimicelles on the graphene surface and afford more adsorption sites [28]. This may enhance the adsorption of EDCs on GMs. Whether the cation surfactant would increase or decrease the adsorption of EDCs on GMs largely depends on the interaction between the cation surfactant and GMs, which is attributed to the properties of GMs [27]. For example, for the porous adsorbent materials, the cationic surfactant may block the access to the available pores inside and inhibit the adsorption of EDCs. Furthermore, as reported, the configuration of EDCs may also play a role in their adsorption to carbonaceous nanomaterials [15, 29]. Thus, it is difficult to predict the actual effects of the cationic surfactant on the adsorption of EDCs to GMs. To the best of our knowledge, there are few studies on the cationic surfactant effects on the adsorption of organic contaminants to GMs. The only few researches focused on the surfactant effects were in regard to anionic surfactants [30]. As reported, the effects of the surfactant species on the adsorption of organic contaminants to carbonaceous nanomaterials were quite varied [31, 32]. Therefore, in order to understand the complex interaction mechanisms among EDCs, GMs, and cation surfactants, relevant studies should be conducted.
The objective of this study was to examine the effects of the cationic surfactant on the adsorption affinities of GMs for typical EDCs. 17α-Ethinyl estradiol (EE2) and BPA were selected as the model EDCs because of their different hydrophobicity and steric configurations. Cetyltrimethylammonium nitrate (CTAB) was selected as the model cationic surfactant. Their adsorption behaviors on GO and two RGOs with different reduction extent were compared, and a commercial graphene (CG) was selected as a comparison because of its flat and few-layered structure. The mechanisms that controlled the effects of the cationic surfactant on EDC adsorption to GMs were systematically discussed. This study could provide a better understanding of the adsorption behavior of EDCs on GMs in the real aquatic system in the presence of cationic surfactants.
2. Materials and Methods
2.1. Materials
GO (>99%) and CG (>99%) was purchased from Plan Nano Materials Tech Co. (Tianjin, China). RGOs were obtained by reducing GO using the method that we reported before [32]. The reduction procedures were as follows: First, 0.1 g GO powder was added in 400 mL deionized water and sonicated for 10 min, to obtain a GO suspension. Then, a certain amount of L-ascorbic acid was added into the GO suspension and stirred in the dark for 72 h at
EE2 (98%) and BPA (99%) were purchased from Sigma-Aldrich (Shanghai, China). The phycochemical properties of EE2 and BPA are listed in Table S1. The EDC stock solutions were prepared in methanol and stored at -20°C. L-Ascorbic acid (99.5%) was obtained from the VICTOR Co. (Tianjin, China). CTAB was purchased from Sinopharm Chemical Reagent Co., Ltd. (Shanghai, China). The critical micelle concentration and molecular structure of CTAB are summarized in Table S2. The inorganic salts (NaH2PO4·2H2O and Na2HPO4·12H2O) were obtained from Guangfu Technology Development Co. Ltd. (Tianjin, China). Glass optical fibers coated with polyacrylate (thickness 35 μm; volume 15.4 μL m-1) were purchased from Polymicro Technologies (Phoenix, AZ, USA).
2.2. Characterization of GO, RGOs, and CG
The morphological properties of GMs were examined with a transmission electron microscope (TEM) (JEM-2100, JEOL, Japan) and scanning electron microscopy (SEM) (S-3400N II, Hitachi, Japan). Surface elemental compositions of GMs were determined with X-ray photoelectron spectroscopy (XPS) (MultiLab 2000, Thermo Electron Corp., UK). The functional groups of GMs were analyzed by Fourier transform infrared transmission (FTIR) spectra (Bruker TENSOR 27 apparatus, Bruker Optics Inc., Germany). The graphitization degrees of GMs were evaluated by Raman spectra (RM2000, Renishaw Corp., UK). The ζ potential of GMs in the absence and presence of CTAB was measured by ZetaPALS (Brookhaven Instruments, USA) in a 10 mM Na2HPO4/NaH2PO4 buffer. The surface area and pore volume of GMs were determined from the surface area and porosimetry system (Micromeritics ASAP 2010, Micromeritics Co., USA). The relative hydrophobicity indexes of GMs were determined by the method reported by Walker et al. [33].
2.3. Adsorption Experiments
Adsorption experiments were conducted as follows [34]: First, 20 mg of GMs was added in a 10 mM phosphate buffer (NaH2PO4/Na2HPO4, pH 5.96) to obtain a 50 mg L-1 suspension of GMs. Then, the GM suspension was added to a 20 mL glass vial. In the experiments that examined the effect of CTAB, an aqueous stock solution of CTAB was added to reach the concentration of 40 mg L-1. After that, the methanol stock solution of EE2 or BPA was added into the GM suspension. The volume percentage of the methanol stock solution was kept below 0.1% (
2.4. Analytical Methods
The concentrations of EE2 and BPA were determined using an Agilent 1200 high performance liquid chromatography system equipped with a symmetry reversed-phase C18 column (
3. Results and Discussion
3.1. Characteristics of GO, RGOs, and CG
The selected physicochemical properties of GMs are summarized in Table 1, and the information of the surface element and functional group of GMs is shown in Figure 1. In general, surface O content of GMs was decreased by reduction, from 29.76% of GO to 26.71% of RGO_1 and 21.07% of RGO_2, while that of CG was 16.12%, which was the lowest (Table 1). The C weight percentages of epoxy/alkoxy (C–O/C–O–C) and carbonyl (C=O) of GMs were also decreased with the increase of the extent of reduction (Figures 1(a)–1(d)). The content of the O-functional groups on RGOs was higher than that of CG, which indicated that the reduction by L-ascorbic acid was not complete. It is noted that the C weight percentage of carboxyl (O–C=O) was increased from 2.13% of GO to 4.69% of RGO_1 and 5.50% of RGO_2. This is likely attributed to the adsorption of the reduction agent on RGOs as we reported before [32]. As shown in Figure 1(e), the peaks at 3422, 1735, 1227, and 1055 cm-1, which represented hydroxyl (O–H), carbonyl (C=O), and epoxy groups (C–O–C) and alkoxy (C–OH), respectively, were significantly weakened with the increase of the extent of reduction [35, 36]. This indicated that L-ascorbic acid could significantly decrease the amount of the polar functional groups on GO. The values of ζ potential of all GM solutions were negative, which was in the following order:
Selected physicochemical properties of GO, RGO_1, RGO_2, and CG.
aAnalyzed using X-ray photoelectron spectroscopy. bDetermined by the method reported by Walker et al. [33]. cMeasured in 10 mM Na2HPO4/NaH2PO4 buffer. dAnalyzed using surface area and porosimetry system.
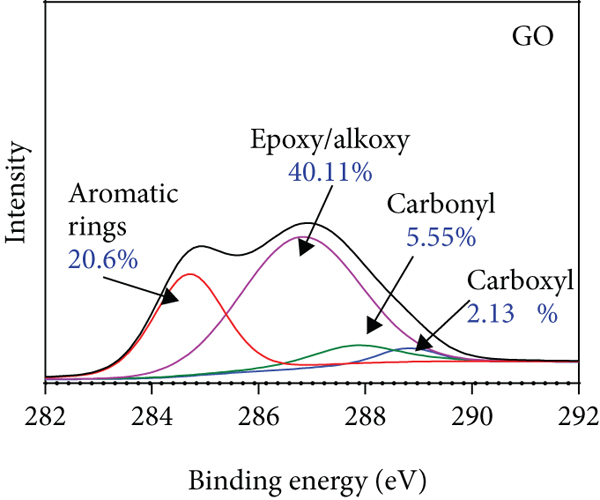
X-ray photoelectron spectroscopy (XPS) curve fit of C1s spectra of GMs (a–d); Fourier transform infrared spectra (FTIR) of GMs (e); Raman spectra of GMs (f).


The Raman spectra could reflect the graphitization degree of GMs [37, 38]. As shown in Figure 1(f), the D and G bands of GO, RGO_1, RGO_2, and CG were all at 1340 and 1600 cm-1, and the intensity ratios of D peak to G peak (
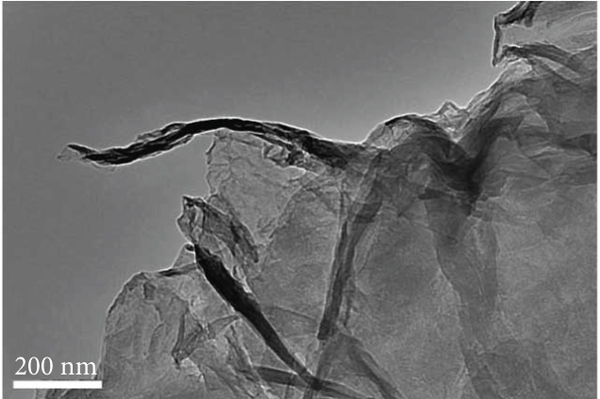
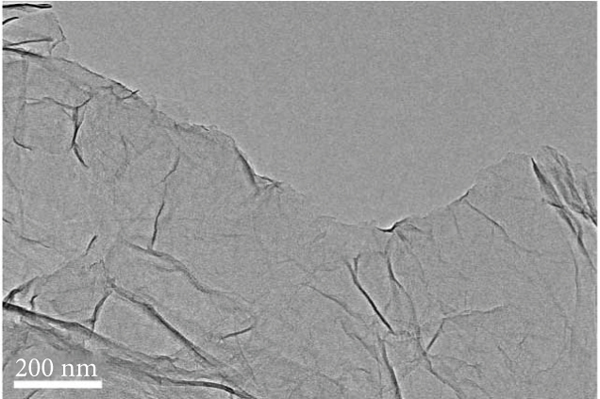
The morphological structures of GMs were examined by SEM and TEM. As shown in Figures 2(a) and 2(b), the surfaces of GO and CG were relatively flat and smooth, and their structures tended to be two-dimensional. With the increase of the extent of reduction, the graphene sheets of RGOs became wrinkled, fragmented, stacked, and porous, which were more like three-dimensional structures (Figures 2(e)–2(h)). This is likely because the L-ascorbic acid reduction could tear up the graphene layers to small fragments [32]. Meanwhile, the newly formed graphitic domains could enhance the π electron density and hydrophobicity of GMs and finally enhance the π-π interaction and hydrophobic interaction between the graphene layers and/or fragments. This could make them stacked together and form porous structures [32]. It is noted that the surface area and the pore volume of RGO_2 was much higher than those of GO and RGO_1, and the average pore diameter of RGO_2 was significantly decreased (Table 1). This is likely attributed to the smaller pores formed by reduction which could increase the inside surface of GMs.

Scanning electron microscopy (SEM) (a–d) and transmission electron microscopy (TEM) (e–h) images of GO (a, e), RGO_1 (b, f), RGO_2 (c, g), and CG (d, h).


3.2. Adsorption of EE2 and BPA to GMs
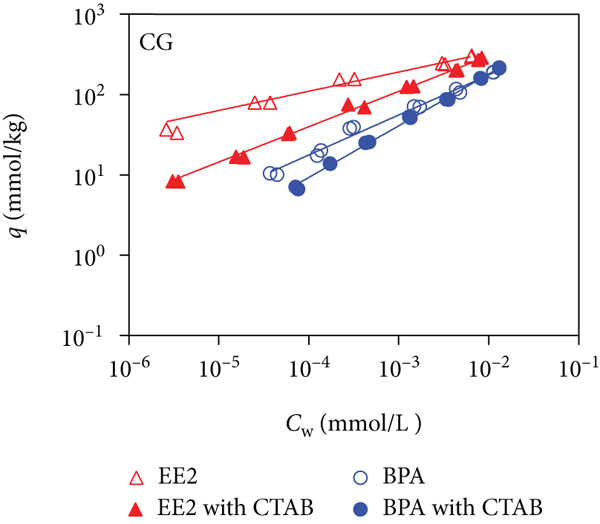
The adsorption isotherms of EE2 and BPA to GMs are shown in Figures 3(a) and 3(b), and the adsorption data were fitted with the Freundlich and Langmuir models (for the model details, see in the SI). The Freundlich model generally assumes that the adsorption is multilayered and heterogeneous, and the Langmuir model generally assumes that the adsorption is monolayered and the adsorption sites could reach saturation [40, 41]. The fitted parameters and the ranges of distribution coefficients (
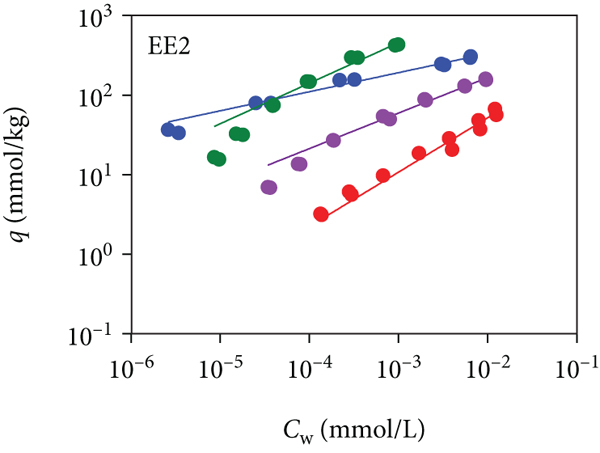
Adsorption isotherms of EE2 and BPA to GMs (a, b) and those normalized by BET surface area (c, d).


Summary of adsorption parameters [Freundlich model coefficients (
aValues after “±” sign indicate relative standard deviation.
As shown in Figure 3 and Table 2, RGOs exhibited stronger adsorption affinities than GO. The adsorption affinities (
To further compare the respective contribution of hydrophobic interaction with π-π EDA interaction, the normalized adsorption isotherms of EDCs to GMs were further normalized by relative hydrophobicity indexes and
It is noted that although the hydrophobicity and the π electron density of CG were the highest (Table 1), the adsorption capacities as well as the adsorption affinity of EE2 on CG were still lower than those on RGO_2, especially at high equilibrium concentrations. This could be attributed to the different structures of CG and RGO_2. The adsorption sites of CG were exposed because of the open-layered structure; thus, the EE2 molecules could be easily adsorbed at the low concentrations. With the increase of the EE2 concentration, the adsorption sites of CG became saturated. However, the wrinkled surface of RGO_2 could form new pores inside which could offer more adsorption sites. Thus, the EE2 molecules could be adsorbed on RGO_2 via the pore filling mechanism. Moreover, the content of O-functional groups on RGO_2 was higher than that on CG. The H-bonding interaction between EE2 and RGO_2 is stronger than that between EE2 and CG. The relatively stronger H-bonding on RGO_2 could also offset part of the hydrophobicity effect and π-π EDA interaction effect and made the adsorption of EE2 on RGO_2 stronger.
Interestingly, the reduction of GO showed stronger influence on EE2 than on BPA. For example, when the EDC equilibrium concentration was at 10-3 mg L-1, the
3.3. Effects of CTAB on Adsorption of EDCs Were Varied on Different GMs
The adsorption isotherms of EDCs to GMs in the presence of CTAB are shown in Figure 4, and the corresponding fitting results of adsorption data to the Freundlich and Langmuir models are summarized in Table 2. In general, CTAB showed different effects on the adsorption of EDCs to different GMs. For example, CTAB enhanced the adsorption of EE2 on GO and RGO_1, whereas it inhibited that of EE2 on RGO_2 and CG. The

Adsorption isotherms of EE2 and BPA to GMs in the absence and presence of CTAB.


According to the previous studies, cationic surfactants may alter the adsorption of organic contaminants via the following mechanisms: (1) increasing the solubility of organic contaminants, (2) competing organic contaminants with the adsorption sites, (3) changing the surface or aggregation properties of the adsorbent surface, (4) forming hemimicelles in which organic contaminants could partition in [30, 31, 42, 43]. In this experiment, the initial concentration of CTAB was selected as 40 mg L-1, which was much lower than its critical micelle concentration (Table S2). The effects of CTAB concentrations on the solubility of EDCs are shown in Figure S3. The result indicated that the selected concentration of CTAB had negligible effect on the solubility of EE2 and BPA, and the solubilization effect of CTAB on EE2 and BPA could be ignored. Thus, the different effects of CTAB on EDC adsorption on varied GMs could be attributed to the adsorption affinities of CTAB on GMs. Therefore, the adsorption affinities of CTAB on the four GMs were detected.
As shown in Figure S4, the adsorption affinity of CTAB followed the order
As shown in Figure 4(a), the adsorption of EDCs was enhanced by more than 1 log unit in the presence of CTAB, although CTAB occupied the highest amount of adsorption sites on GO. As shown in Table S3, after adsorbed CTAB, the ζ potential of GO became less negative. This indicated that the hydrophobicity of GO increased, and this could enhance the hydrophobic interaction between EDC and GO in the presence of CTAB. Meanwhile, it was reported that CTAB molecules were flatly adsorbed on the surface of GO at low surfactant concentration and competed with EDCs for the adsorption sites [27]. With the increase of surfactant concentration, the alkyl chains of CTAB molecules started to leave the surface of GO and form hemimicelles [27]. These newly formed hemimicelles could offer adsorption sites for organic contaminant partitioning [28]. Thus, in this study, it is supposed that when the amount of the adsorbed CTAB was

Adsorption coefficients of EE2 and BPA to GMs under different concentrations of CTAB. Different letters marked on the top of the bars indicate significant differences in each group (
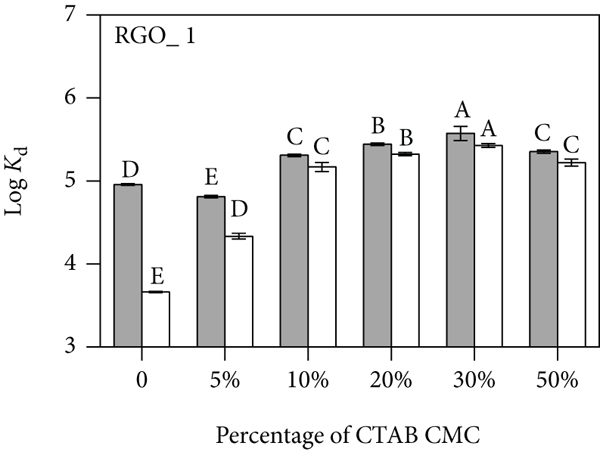
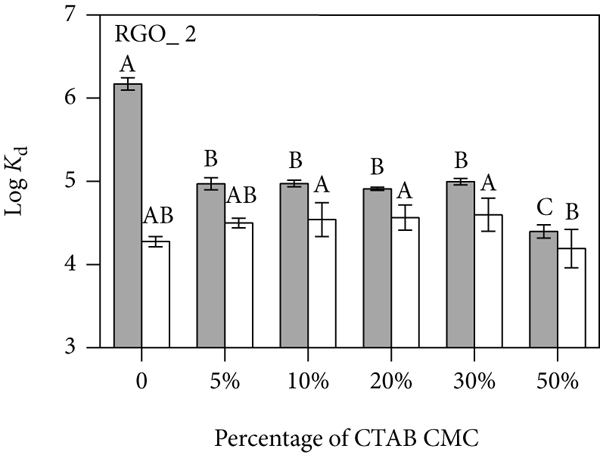

With the increase of the extent of GM reduction, the enhancement of CTAB to the adsorption of EDCs to GMs had been weakened (Figures 4(b) and 4(c)). As shown in Figure S4, the adsorbed amount of CTAB decreased to
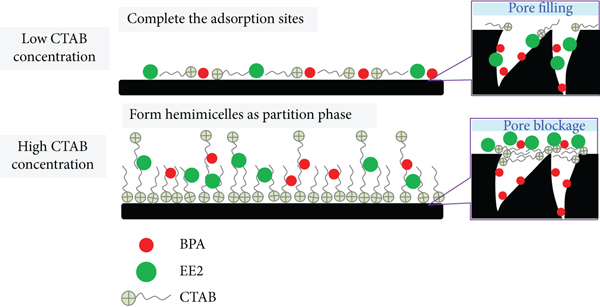
Schematic graph of mechanisms controlling the effects of CTAB concentration.
Notably, the adsorption of CTAB on CG was stronger than that on RGO_2, and the ζ potential was similar Compete the adsorption sites with EDCs (Table S3); however, the inhibition effect of CTAB on the adsorption of EE2 to CG was weaker than that to RGO_2, especially at a high concentration of EE2. This may be attributed to the open-layered structure of CG. The inhibition caused by the pore blockage effect did not play a role for the two-dimensional CG.
3.4. Effects of CTAB on Adsorption of BPA Were Different from those on EE2
As shown in Figures 4 and 5, the enhancement effect of CTAB on BPA was stronger than that on EE2. For example, when the aqueous EDC concentration was 10-3 mmol L-1, the value of
4. Conclusions
The reduction of GO by L-ascorbic acid could increase the hydrophobicity and the amount of micropores of GO and further enhanced the adsorption affinities of GMs for both EE2 and BPA. The presence of the cationic surfactant, i.e., CTAB, showed different effects on the adsorption of EDCs to different GMs. It was the enhancement effect on GO, and with the increase of the reduction extent, the enhancement effect of CTAB was weakened and finally became the inhibition effect. This could be attributed to the combination effects of the following aspects: (1) CTAB was flatly adsorbed on the surface of GMs at a low surfactant concentration and competed with EDCs for the adsorption sites; (2) with the increase concentration of CTAB, the hemimicelles formed on the surface of GMs could serve as a partition phase for EDCs; (3) the adsorbed CTAB on the surface of RGOs crisscrossed at the access of the pore and blocked the entrance of EDC molecules, thus inhibiting the adsorption of EDCs; and (4) the adsorbed CTAB could enhance the adsorption of EDCs to GMs by strengthening the hydrophobic effects, π-π EDA interactions, and also cation bridging. Furthermore, the configuration of EDCs also played an important role. The adsorption of BPA in the presence of CTAB was affected less by the pore blockage effects compared with that of EE2 because of the smaller molecular size and deformable structure of BPA. These results are of great importance for predicting EDC environment behavior on GMs in the real aquatic environment.
Footnotes
Data Availability
All data generated or analyzed during this study are included in this published article and its supplementary information files.
Conflicts of Interest
The authors declared no potential conflicts of interest with respect to the research, authorship, and/or publication of this article.
Acknowledgments
This work was supported by the National Natural Science Foundation of China (Grant 21707101), the Opening Foundation of the Ministry of Education Key Laboratory of Pollution Processes and Environmental Criteria (Grant 2017-06), and the Innovation Team Training Plan of the Tianjin Education Committee (TD13-5073).