
Abstract
An ionic soil stabilizer (ISS) is used to reinforce clay soils because the ISS can regulate the hydration processes and microstructures of clays. To evaluate the regulation of ISS, natural bentonite was modified by ISS at different concentrations in this research. Water vapour adsorption and X-ray diffraction (XRD) were carried out to interpret the hydration mechanism of bentonite. Meanwhile, an associated analysis between hydration pore structures and hydration mechanisms was implemented through variation of pore characteristic tests at different relative humidities (RHs) to distinguish multiscale pore adsorption of water during the corresponding hydration process. In addition, the pore characteristics were studied via XRD, nitrogen adsorption, and mercury injection tests. Finally, the origins that adsorbed water and pore structures changed by adding ISS were discussed. The results showed that for calcium bentonite, the cations hydrated first in the range of
1. Introduction
Swelling clay, which is intensely hydrophilic, has a highlighted behaviour in which clay expands with hydration and shrinks with dehydration. Generally, crystalline swelling and osmotic swelling occur sequentially when swelling clay hydrates [1–4]. At the beginning of hydration, water molecules are adsorbed into the clay interlayer, which is driven by the hydration energy of interlayer cations, resulting in the expansion of interlayer spacing (
According to the mechanism of adsorbing water, the two expansion stages actually originate from the unceasingly changing occurrence state of adsorbed water [5, 6]. When adsorbing water, the internal and external surfaces of crystal layers and even the surface of clay particles generate water layers with varying hydration energy. Then, adsorbed water transforms from bound water to DDL water as the thickness of the water layer increases. In this hydration process, water molecules ceaselessly enter the interlayer and interparticle space, generating a “wedging force” to enter the space so that clay swells.
In return, the pores changing with clay swelling influence the processing of adsorbing water and the properties of adsorbed water, indicating that hydration and pores are reciprocal [7–9]. According to the nomenclature terms of the International Union of Pure and Applied Chemistry (IUPAC), the pores can be divided into micropores (<2 nm), mesopores (2–50 nm), and macropores (>50 nm) through their pore size. For bentonite, which comprises phyllosilicate minerals, micropores are distributed mainly in the interlamellar space [5, 6, 10] and can be measured by X-ray diffraction (XRD) [11–13]. The mesopores are recognized in the space among particles and even in some space among aggregates [5, 6]. This kind of pore is usually measured by vapour adsorption (e.g., water and nitrogen) based on multifarious pore analysis methods, such as the frequently used BJH [14] and DH [15] methods. Furthermore, macropores appear in the space among aggregates or even larger clay particles [6, 10], and the mercury intrusion method can be adopted to study this scale of pores [16].
As stated above, hydration and pore characteristics are interdependent and reciprocal. Therefore, a question about the associated evolution of “hydration pores” has arisen. Although the change in crystalline structure during hydration has been investigated by means of XRD and water adsorption [12, 13, 17], the change in crystalline structure is concentrated on the microporous scale without meso- and macropores. In addition, a thermoporometry method has been employed to study the pore characterization of clay when it is hydrated [6]. This measurement could be made on liquid-saturated samples or on samples in equilibrium with a certain relative humidity (RH or
To solve the engineering problem that clay swelling brings while adsorbing water, many solutions have been proposed by students. Generally, cementitious materials such as lime and cement have been used to improve the engineering behaviours of clay [18, 19]. These types of materials could interact with clay from the following two aspects: (1) bivalent Ca2+ in cementitious materials replaces the monovalent cations so that the hydrated film of clay soil is reduced; (2) the production of cementitious materials strengthens the connection among clay particles. However, Ca2+ could be replaced by other intense hydration cations in shifted water circumstances, resulting in damage to cementitious production. Additionally, the improvement has been proven to attenuate after several drying and wetting cycles [20]. To overcome these disadvantages, some new stabilizers have been developed, such as ionic soil stabilizers (ISSs), polymer stabilizers [21], and bioenzyme stabilizers [22]. In particular, ISS could regulate the hydration properties of clay particles, which has drawn extensive attention from students [23, 24]. With regard to the constituents, ISS is generally thought to be a kind of hydrosolvent that contains several dissociated ions. These ions could interact with clay minerals and change their surface properties. By regulating the hydration properties, ISS suppresses the expansive potential of swelling clay and improves its mechanical behaviours [25, 26].
The above results indicate that adding ISS to reinforce swelling clay was promising. However, most of these studies focused on comparative analysis of macroparameters for raw and modified samples, while the impacts that ISS had on the two key factors (hydration and pore) in the process of adsorbing water need to be investigated further. Therefore, in this paper, the associated evolutionary mechanism of hydration pores for bentonite in the whole hydration process is discussed first. Based on this discussion, the adsorbed water and pore characteristics of raw and modified bentonite were studied. Then, the modified mechanism of ISS could be revealed by understanding the variation in the hydration process and pore structure. These results could assist in the area of clay modification and improvement.
2. Materials and Methods
2.1. Clay Minerals and Sample Preparation
A natural bentonite from Greek volcanic areas was selected as the material to study in this paper. The phase composition by XRD (D8-FOCUS with a CuK α radiation source, Ni filter, 40 kV, 40 mA, scan range of 2–65°2θ, step intervals of 0.02°2θ, and dwell time of 2 s; Bruker, Karlsruhe, Germany) demonstrated that this material extracted from physically crushed raw ore of bentonite and purified by hydraulic elutriation had above 95 wt% montmorillonite (Figure 1). GBT in the following discussion was short for this purified Greek bentonite. X-ray fluorescence (AXIOSmAX Instrument, PANalytical, Eindhoven, the Netherlands) tests showed that the chemical composition of this calcium bentonite dried at 105°C for 4 hours in mass percentage was SiO2, 57.99%; Al2O3, 17.92%; Fe2O3, 4.65%; MgO, 4.12%; CaO, 3.86%; Na2O, 0.59%; K2O, 0.45%; MnO, 0.07%; TiO2 0.74%; P2O5, 0.19%; and loss on ignition (LOI), 9.38%. The cation exchange capacity (CEC) of GBT was determined by the barium chloride method, and the type and contents of exchangeable cations were measured through inductively coupled plasma-optical emission spectroscopy (iCAP 6300, Thermo Fisher Scientific, Waltham, Massachusetts, USA). The cation results (Table 1) showed that the main exchangeable cation was Ca2+, indicating that GBT was calcium bentonite. The Atterberg test showed that the liquid limit and plastic limit of this calcium GBT were 226.70% and 43.75%, respectively.
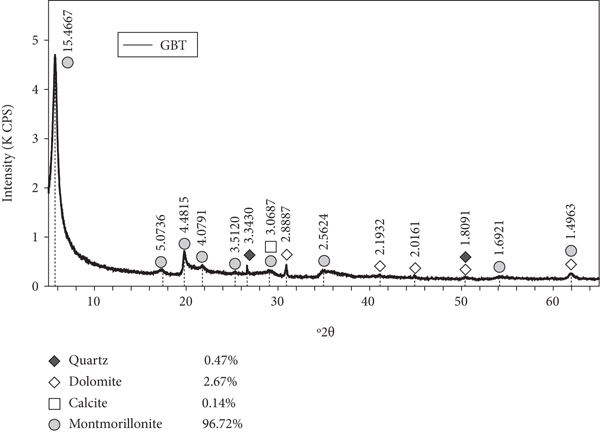
XRD spectrum of GBT.
CEC and exchangeable cation content of GBT.
2.2. Ionic Soil Stabilizer (ISS)
The ionic soil stabilizer was developed independently by Pro. The Wei Xiang group was produced through sulfonation of cottonseed oil with concentrated sulfuric acid under certain chemical conditions. The main component of ISS was cottonseed oil-based sulfonated oil, which had few metal cations, such as K+, Na+, Ca2+, and Mg2+ (Table 2), demonstrating that ISS would not mislead the exchangeable cation analysis of modified bentonite.
Metal cation content of ISS.
2.3. Modified Samples by Adapting ISS
ISS was a kind of grease that could not interact with clay directly unless it was diluted by water at a certain volume ratio. In previous work on modifying natural expansive soil, we found that the optimal dilution ratio for ISS was 1 : 200 [27, 28]. In this paper, the material was purified bentonite with >95 wt% clay minerals, which was 3.2 times the clay minerals of red clay [27, 28]. Hence, higher dilution ratios (volume ratios of 1 : 50 and 1 : 100) were chosen to modify the bentonite. Then, 100 g of naturally air-dried GBT was selected to interact with 200 ml of diluted ISS liquor. After sufficient stirring, the mixture of GBT and ISS was hermetically placed for 24 hours to acquire a complete interaction. Next, the modified bentonites were removed and leached to wash off the free ions and redundant ISS through centrifugation. This step was repeated 4 times to ensure that salt leaching was rigorous. Then, liquid nitrogen was added to pasty-modified bentonites to freeze-dry them. Finally, the freeze-dried samples were tested and designated GBT-1 : 50 and GBT-1 : 100 based on their ISS concentrations. Additionally, the raw bentonite tested was prepared in the same way and was designated GBT-0.
2.4. XRD and
Reflections
Approximately 40 mg GBT-0 was stirred in 0.7 ml distilled water to become a suspension, which was spread on glass slides for air drying. To save experimental time, 14 identical slides for bentonites were made to be exposed to a certain RH at the same time. Then, all slides were dried in a muffle furnace at 350°C for 2 h to dehydrate all the adsorbed water in bentonite. After drying the bentonites, 14 slides were exposed to a certain RH (from 0 to 1) in airtight glass pots controlled by the desiccant and different saturated brine solutions for 30 days to ensure that the mass change of each slide was less than 0.0005 g and guarantee adsorption equilibrium. At the end, all the slides were stored in sealed cases separately and measured by the XRD method.
2.5. Water Vapour and Nitrogen Adsorption
The clastic freeze-drying materials (GBT-0, GBT-1 : 100, and GBT-1 : 50) were put into an adsorption device named Autosorb-iQ (Quantachrome Instruments, Boynton Beach, Florida, USA) to measure water vapour adsorption-desorption isotherms (
2.6. Mercury Intrusion Method
The granular freeze-dried samples (GBT-0, GBT-1 : 100, and GBT-1 : 50) with a 5 mm grain size were placed in an AutoPore IV 9500 mercury injection apparatus (Micromeritics Instrument Corporation, Norcross, Georgia, USA) to investigate the macropores.
2.7. Variation of Pore Characteristic at Different RH
To obtain the variation in pore characteristics at different RHs, an indirect method was applied. First, three 20 cm3 compacted cutting ring samples of GBT-0 were made with dry densities of 1.2 g/cm3, 1.3 g/cm3, and 1.4 g/cm3. After saturation, the compacted samples were placed in the airtight glass pot mentioned in Section 2.4 to desorb water. To save test time, other samples were put separately into another 13 airtight glass pots with different RHs. To guarantee desorption equilibrium, more than 3 months were taken, and the final mass change was less than 0.01 g in seven-day continuous weighing. Simultaneously, the volume of each compacted sample was measured and calculated by a Vernier caliper. Finally, the variation in void ratio at different RHs could be calculated through the specific gravity of bentonite particles using a value of 2.75 g/cm3.
3. Results and Discussions
3.1. Hydration Mechanism of Bentonite
To better understand the influence of ISS on adsorbed water, the hydration process of natural bentonite was investigated first. Therefore, the hydration mechanism of raw bentonite is discussed as follows. The water vapour adsorption isotherm is the curve of adsorbance versus RH or
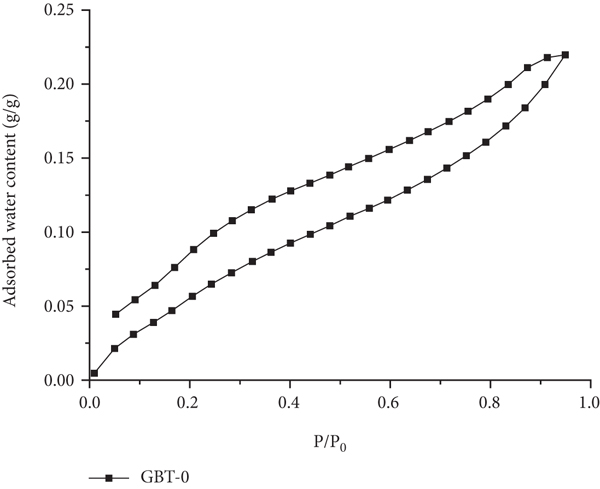
Water vapour adsorption isotherms of raw bentonite.
Figure 3 shows the first derivative of adsorbed water content in the desorption branch versus RH (or

Water vapour adsorption velocity curves of raw bentonite.
Water molecules were recognized to be able to interact with multifarious hydration sites (e.g., cations and the basal surface of the crystal layer) on the surface of clay, resulting in a difference in hydration energy for adsorbed water [30–32]. Moreover, the hydration energy of cations was much higher than the hydration energy of the basal surface, causing cation hydration to be the main driving force to adsorb water [11–13, 33, 34]. Thus, water molecules were supposed to move from the basal surface of the crystal layer with lower energy first during the desorption process. In addition, cations dehydrated afterwards. Hence, the first peak ranged from approximately 0.15 to 0.2 and the second peak ranged from approximately 0.8 to 0.9 in Figure 3, showing hydration of cations and adsorption of the basal surface, respectively. In addition, the RH Section 0.45~0.55 was the boundary that distinguished cation and basal surface hydration.
To verify the hydration sequence above, the curve in which

The hydration energy of cations was higher than the hydration energy of the basal surface of the crystal layer (as mentioned above). Consequently, water molecules entered the interlayer and interacted with cations to form a hydration shell at the beginning of hydration, indicating that the driving force that caused water molecules to enter the interlayer was mainly from the hydration energy of cations. In the range of
To summarize, the hydration mechanism for GBT-0 and other Ca-Monts was as follows: (1) in the range of
3.2. Definition of Multiscale Pores of Bentonite by Hydration Status
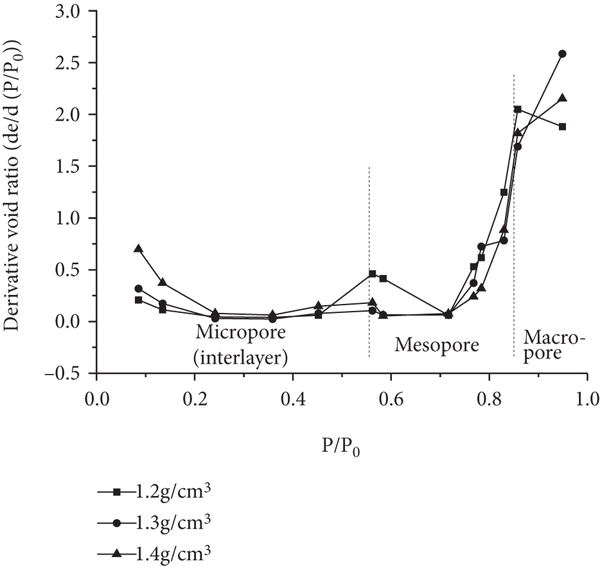
The variation in pore characteristics in the hydration process was studied by the means mentioned in Section 2.7 and displayed in Figure 5. Figure 5(a) shows the curve of the void ratio versus RH. Figure 5(b) illustrates the first derivative of the void ratio versus RH, which represents the variational rate of pores in different hydration statuses. In Figure 5(a), bentonite with three kinds of dry densities gave a difference of void ratio in that a 1.4 g/cm3 sample showed more notable increase of the void ratio with RH increasing at the range of 0~0.55 than the others. An RH of 0~0.55 was thought to be the range in which interlayer cations hydrated and crystalline swelling occurred. Bentonite with a 1.4 g/cm3 dry density had fewer pores to accommodate the expansion of the crystal layer and finally resulted in an increase in macroscopic volume. Conversely, the samples with lower dry density had space to accept crystalline swelling so that the void ratio increased gently with RH. Nevertheless, the results of bentonite with 3 dry densities all showed two boundaries,

Void ratio in different
In particular, the statement about a certain pore starting to adsorb water meant water molecules mainly entered this kind of pore, which did not mean that water molecules could no longer enter the previous type of pore. For example, in the range of
In conclusion, the multiscale pores of calcium bentonite that adsorb water in different hydration processes were defined as follows: (1) in the range of

Hydration sequence in multiscale pores of calcium bentonite.
3.3. Influence of ISS on the Pore Characteristics of Bentonite
Figure 8 illustrates the water vapour adsorption isotherms of GBT-0, GBT-1 : 100, and GBT-1 : 50. The forms of the curves of the modified samples were similar to the forms of the curves of the raw sample. Meanwhile, the water vapour adsorption velocity curves shown in Figure 9 also displayed the same peaks, which meant that the modified bentonites had the same hydration mechanism and RH boundaries to define pore types as natural bentonite. Note that the adsorbance of raw samples was higher than the absorbance of the modified samples, indicating that ISS reduced the adsorbing capacity of bentonite. Moreover, the isotherm of GBT-1 : 100 displayed an increase in absorbed water content, which was close to the increase of GBT-0 with an RH of >0.9 in the adsorption branch and >0.7 in the desorption branch, stating that the dilution ratios of ISS affected the reduction in adsorbed water content. In the water vapour adsorption test, sample GBT-1 : 100 showed a lower adsorbing capacity than the raw sample with a lower RH, which meant that the ISS in bentonite was sufficient at the current time. However, with RH over 0.9 in the adsorption branch and 0.7 in the desorption branch, the ISS in GBT-1 : 100 might be insufficient, resulting in an approximation of the adsorbed water content. The interaction between ISS and clay minerals was quite complex, which led to a difference in the water adsorbing capacity of modified bentonite.

Water vapour adsorption isotherms of raw and modified bentonites.


Water vapour adsorption velocity curves of raw and modified bentonites.
3.3.1. Micropore Characteristics
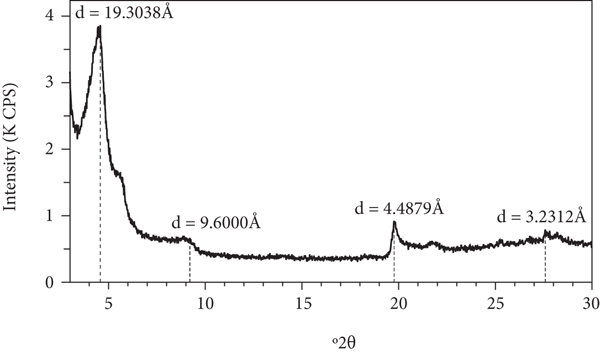
Bentonite is a kind of clay that comprises phyllosilicate minerals. The specific structures of bentonite produced a phenomenon in which micropores were distributed mainly in the interlamellar space. As mentioned above, the range


To deeply verify the above statement that the swelling behaviour of micropores was modified by ISS, adsorption equilibrium samples in saturated steam ethylene glycol (EG) were selected to test the
3.3.2. Mesopore Characteristic
The mesopores were discussed through vapour adsorption based on certain pore analysis models. Specifically, the desorption branch was usually picked to analyse mesopore characteristics because it presented a clear hydration sequence, as mentioned above. With further hydration in the range of

Pore size distribution of bentonites (water vapour adsorption).
In the discussion above, the analysis of mesopores was derived from the water vapour adsorption isotherm because this isotherm could present the mesopore characteristics in certain hydration sequences. However, measurement of mesopores is commonly performed by nitrogen adsorption considering that nitrogen molecules are nonpolar and interact with adsorbing materials through physical absorption. Allowing for a sufficient expansion of multiscale pores in the water content of the liquid limit for bentonite, pore structures in this status were conserved by means of freeze-drying through liquid nitrogen, and the obtained bulk samples were applied to nitrogen adsorption tests to investigate mesopore characteristics. Figure 12(a) illustrates the nitrogen adsorption isotherms of bentonite samples, and Figure 12(b) shows the pore size distribution curves based on the D-H model. The nitrogen adsorption results demonstrated that the main pore radius of bentonite was in the range of 10 nm~30 nm and that the pore radius of the modified samples decreased from 24.5 nm to 12.0 nm and 21.3 nm for GBT-1 : 100 and GBT-1 : 50, respectively. The volume that corresponded to the main pore radius of modified bentonites also displayed a reduction from 0.026 cm3/g to 0.025 cm3/g and 0.021 cm3/g, indicating that mesopores changed and clay particles became more aggregate.

Pore size distribution of bentonites (nitrogen adsorption).

Note that an obvious and narrow peak was distributed around the 2 nm pore radius in Figure 12(b). Regarding this peak, it was said that it was a fake peak influenced by the diversity of pore types and connectivity of pore networks. Additionally, all the narrow peaks were distributed in the same pore radius [39, 40]. Hence, this kind of peak is not discussed in this paper.
3.3.3. Macropore Characteristics
As mentioned above, when
Figure 13 shows the liquid limit and specific surface area (SSA), including

SSA and liquid limit of bentonites.
Thickness of weak adsorption water for bentonites.
As a result of the liquid limit, GBT-1 : 100 presented a thinner DDL than GBT-1 : 50, implying that the water-adsorbed content of modified bentonite was not necessarily positively correlated with the applied ISS concentration. The same phenomenon has been found in earlier studies, and thus, the concept of the optimal ratio has been proposed [27, 28], which meant that more ISS did not necessarily produce a better modification result. Determining this optimal ratio requires a reference value for the physical and chemical properties, such as the liquid limit, free expansion rate, and CEC. The difference in the selection of the reference value would also cause the difference in the optimal ratio, and it was difficult to have a uniform reference value, so that all physical and chemical properties of the clay showed the same modification pattern as the ISS concentration. As a consequence, it could not be simply assumed that the higher the applied ISS concentration was, the greater the reduction in DDL thickness.
To measure the size of the macropores, a mercury injection test was implemented, as shown in Figure 14. Freeze-drying was applied with the water content of the liquid limit before the test so that the pore structures could remain and be measured. The pore size distribution curves presented double peaks, indicating that two main macropores existed in bentonite. The main macropore size of the modified samples shifted from 9062 nm to 7248 nm (GBT-1 : 100) and 6583 nm (GBT-1 : 50) and from 2543 nm to 1624 nm (GBT-1 : 100) and 2509 nm (GBT-1 : 50) in comparison to the raw sample. Having the same changing trend as micro- and mesopores, modified samples swelled limitedly when hydration and development of macropores were depressed under the influence of ISS.

Pore size distribution of bentonites (by mercury intrusion).
3.4. The Origin of Adsorbed Water and Pore Structures Changing by Adding ISS
RHs of 0.45~0.55 and 0.8~0.9 were defined as the boundaries of pore types. For modified samples, the curve forms were similar to the curve forms of the raw sample, also having the same peaks shown in Figure 9. Therefore, boundaries of 0.45~0.55 and 0.8~0.9 were used to define the pore types of modified samples, such as natural bentonite. In the process in which micropores adsorbed water (

Exchangeable cations and CEC of samples.
With further hydration in the range
When RH was higher than 0.8~0.9 and even adsorbing water was in the liquid phase, water entered macropores, and the water content decreased for modified bentonites, as shown in Figure 8. Simultaneously, the size of the macropores decreased, as shown in Figure 14 and Table 3, demonstrating that macropores had a direct connection with adsorbed water. In this hydration process, the decrease in adsorbed water was produced by the comprehensive influence of SSA and CEC reduction. The expansion of macropores in modified bentonite was not sufficient because of the limit of adsorbed water.
From the above, regulation of ISS was brought to adsorbed water, and pore structures were realized through the reduction of exchangeable cations and the basal surface. In certain hydration sequences, ISS regulated the corresponding dominant hydration factors.
4. Conclusions
The hydration process and pore structure expansion were reciprocal. ISS regulated the corresponding dominant hydration factors to modify the adsorbed water and pore characteristics in certain hydration sequences. In this paper, water vapour and nitrogen adsorption, the mercury intrusion method, XRD, the exchangeable cation test, and the Atterberg limit test were implemented to investigate the hydration mechanism and pore structure evolution of bentonite. The RH was raised to define the hydration sequence and multiscale pore structures. In the range of
However, the quantitative relationship between ISS concentration and the reduction of water retention and pore size has not been investigated. To understand the precise application of ISS, further study will be necessary to establish such a functional relationship.
Footnotes
Data Availability
A data availability statement has been included in my manuscript.
Conflicts of Interest
The authors declare that they have no conflicts of interest.
Acknowledgments
This work was supported by the Education Reform Project of the Ministry of Education (E2020040), Sichuan Science and Technology Program (No. 2019JDRC0109), and National Natural Science Foundation of China (No. 41672297).