
Abstract
To alleviate the environmental problem associated with rare earth wastewater, this research applied waste orange peel (OP) for the adsorption of La(III) and Y(III) from aqueous solution. The adsorption properties of orange peel are characterized using scanning electron microscopy (SEM) and Fourier transform infrared spectroscopy (FTIR), and the participation of hydroxyl and other oxygen-containing groups that promote the physical-chemical interaction is verified. Batch adsorption results suggest that orange peel possesses a satisfactory adsorption performance for La(III) and Y(III). The optimal adsorption conditions were obtained at pH of 6, temperature of 40°C, appropriate dosage of 2 g/L and 3 g/L, contact time of 30 min, and initial ion concentration of 32 mg/L. Under the same condition, adsorption performance of La(III) is better than that of Y(III). The experimental data is well fitted by the Langmuir isotherm model with
1. Introduction
Ion-adsorbed earth ore is one of the most crucial mineral resources in the world. It is increasingly frequent to generate massive volumes of rare earth wastewater on account of continuous mining and smelting [1, 2]. Contaminated water from a mine in southern Jiangxi was measured that contained various rare earth elements (REEs), especially the higher concentrations of lanthanum and yttrium [3]. Slightly toxic REEs will accumulate once into living organisms and cannot be metabolized coupled with chronic ingestion, leading to the detrimental ecosystems and human health [4, 5].
The biosorption method is widely applied in the beneficiation and recovery of REEs [6, 7] by virtue of its advantages such as low cost, easy availability, high efficiency, and ecofriendliness [8]. For the porous surface and abundant adsorption functional groups with strong binding ability containing a carboxyl group, hydroxyl group, and amide group [9], orange peel (OP) is an exemplary candidate to deploy the adsorption technology for the mitigation of wastewater pollution; their biosorption studies have been mainly focused on heavy metals [10], organic drug [11], toxic oxyanions [12], and dyeing [13] wastewater. Nevertheless, there are a few reports concerning rare earth wastewater remediation [14, 15]. The majority of studies have focused on modifying with OP to improve the adsorption capacity, and the modification methods mainly include acid [16], alkali [17], salt [18], structure [19], carbonization [20], organic solvents [21], and compound modification [22]. The whole preparation process of modified OP is shown in Figure 1. In the complex operating process, large numbers of chemical reagents and distilled water are consumed for repeated immersion and washing. Furthermore, the biological structure of OP is easily destroyed [23], which is challenging to ensure the stability of adsorption performance and reuse. Thereby, the disadvantages of time consuming and low yield indicate that the modification method is not advisable under certain conditions. Feng et al. [24, 25] obtained final modified OP products after undergoing multistep operation with much ethanol, NaOH, and other modifiers to soak for more than 20 h. Zhang et al. [26] studied the effects of activators by preparing activated carbon from citrus peel residue, and the yield was only about 37%. Similarly, Xie et al. [27] applied OP to prepare activated carbon with the highest yield of 50.9%. In addition, when it comes to organic modification, given the deficiency of biodegradability for some typical organic solvents like thioglycolic acid, formaldehyde acrylamide, and others, which brings about hazard of toxic substances and the whole process costs elevated.
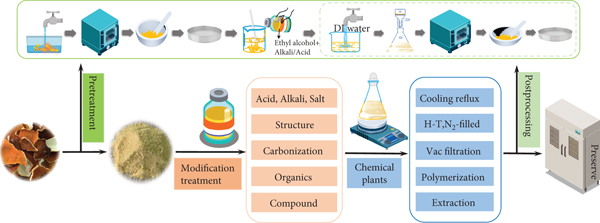
Preparation steps of modified OP.
In view of this, the adsorption properties of La(III) and Y(III) ions onto unmodified OP from aqueous solutions are investigated with characterization methods and varying conditions. This study is aimed at moderating rare earth wastewater pollution and addressing agricultural waste disposal, so as to provide theoretical and practical guidance for the application of OP in rare earth wastewater treatment.
2. Materials and Methods
2.1. Adsorbent Preparation
Orange peel was collected from an orchard in Ganzhou City, China. The peels were rinsed repeatedly without removing white pith, after which they were air dried and later oven dried at 65°C for constant weight. The dried peels were further ground into fine powder and sieved with particle size in the range of 125 to 150 μm. This powder was stored in PVC plastic bag for standby application. All chemicals used were of analytical grade. The pH was adjusted by adding either NaOH or HCl. Rare earth stock solutions of 5 g/L were prepared with lanthanum(III) sulfate octahydrate (99.99% La) and yttrium(III) sulfate octahydrate (99.99% Y) and diluted to desired concentration.
2.2. Characterization of the Prepared Adsorbent
A scanning electron microscope (SEM) (XL30 W/TMP, Philips, Netherlands) is used to assess the changes of the OP surface morphology before and after adsorption. The spectra of the adsorbents are recorded by the Nicolet Fourier infrared spectrometer (FTIR) in the wavelength range of 400-4000 cm-1, which can identify the affinity between the various functional groups of OP and that adsorption process for La(III) and Y(III).
2.3. Batch Adsorption Experiments
Adsorption experiments were performed in a set of 250 mL stoppered conical flasks by adding 0.15 g OP to 100 mL rare earth solutions with initial concentration of 32 mg/L at pH 6, and then, the solution was stirred for 120 min in constant speed agitators at room temperature. Selectivity adsorption experiments at different parameters were carried out to establish the optimal adsorption conditions. The effects of different experimental conditions on adsorption of OP were investigated by varying initial pH from 2 to 7, dosage of OP from 0.05 g to 0.5 g/100 mL, and repeating experiment between 20 and 50°C. The various initial concentration of rare earth ions ranged from 5 to 100 mg/L for isothermal adsorption study, and the kinetic study was carried out by varying contact time between 2.5 and 120 min. After reaching the preset contact time, a small number of supernatant solutions were filtered immediately.
The residual concentration of rare earth ions after adsorption is detected by spectrophotometer (UV-5100). The adsorption capacity (
3. Results and Discussion
3.1. Morphology and Functional Groups of OP
3.1.1. SEM Analysis
Figure 2 displays difference of OP surface structure. Before adsorption, OP embodied a loose and uneven porous structure, which provides plenty of effective sites for the adsorption of La(III) and Y(III). According to the principle of backscattered electron imaging, the microregions with high average atomic numbers in the sample are brighter on the image. Hence, it can be explained that luminous points of images (Figures 2(b) and 2(c)) are the adsorptive distributions of La(III) and Y(III) on the OP surface. The phenomenon reveals that the pore structure of OP is conducive to physical adsorption, and the charge aggregation of particle surface can be illustrated by the outersphere mutual acting (electrostatic) and the surface nucleation of REEs microcrystals in the adsorption process [9, 28].
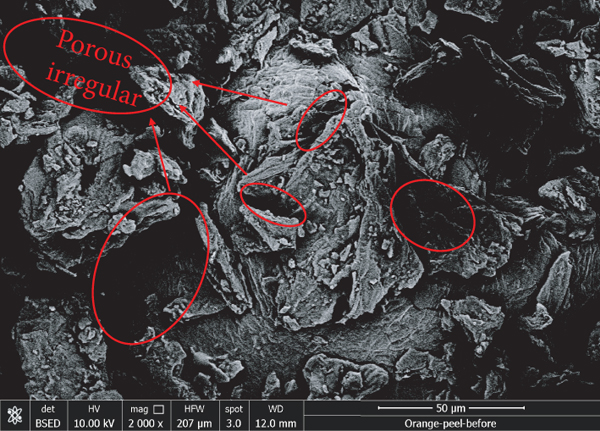
SEM images of OP before (a) and after La(III) (b) and Y(III) (c) adsorption.

OP-La(III)

OP-Y(III)
3.1.2. FTIR Analysis
As shown in Figure 3, the participation of diverse functional groups is proved by FTIR spectra of OP before and after adsorption. The peaks appear at 3428.30 cm-1, identifying as O-H vibrations that originate from the hydroxyl groups of alcohols, phenols, and carboxylic acids on the adsorbent surface [29]. The peak at 3099.87 cm-1 attributed to C-H stretching of the alkane groups [30], and the bimodality peaks near 2731.11 cm-1 represent the stretching of symmetric and asymmetric -CH bond from the aldehyde group [31]. The triple bond and cumulative double bond stretching including the deformation of carbon occurs in several peaks between 2393.93 cm-1 and 2068.50 cm-1. The prominent peak at 1757.36 cm-1 reflects C=O stretching of the nonionized carboxyl groups, which can be associated to organic compounds in OP that contain the dimer form of carboxylic acids, carboxylic esters, ketones, or amides [19]. The peaks at 823.94 cm-1 and 708.71 cm-1 are assigned to -CH out-of-plane bending vibration on the aromatic rings [32]. Overall, these functional groups are derived from main components such as pectin, hemicellulose, and lignin [18].

FTIR spectra of OP before and after adsorption for La(III) and Y(III).
The negligible differences of the OP spectral band before and after adsorption imply that the functional groups remain intact [33]. This is indicative of involvement of ion exchange or surface complexation process. Small range shifts of the peak position indicate that the hydroxyl, carboxyl, and carbonyl groups on the surface of OP played a critical role [30]. It is further supported by the reduction of vibrational intensity [33]. These notions are consistent with the previous finding about the adsorption of metals onto OP [30].
3.2. Batch Adsorption
3.2.1. Effect of Initial pH
The solution pH has been identified as the significant control factor that impacts the adsorption process [34]. As can be seen in Figure 4, the adsorption rate first increases and then decreases with the pH rising from 2.0 to 7.0. The maximum adsorption rates achieved at pH of 6 were 96.99% and 96.84% for La(III) and Y(III), respectively. Further experiments were carried out at pH 6, which is in agreement with the optimum removal of Cd(II) ion by OP at pH 6 as well [30].
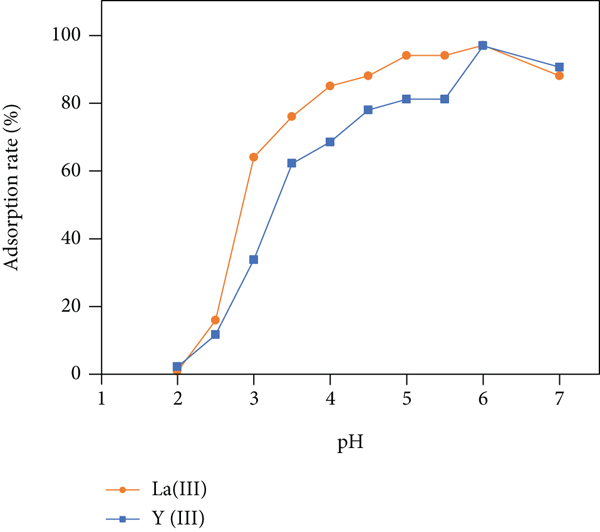
Effect of initial pH on the adsorption of La(III) and Y(III) by OP (room temperature,
The adsorption of La(III) and Y(III) onto OP is intimately dependent on the initial pH that affects the both metal ion existing speciation and adsorbent surface charge [30]. Additionally, H+ itself has strong competitive ability for adsorption sites [35]. Lower pH is considered to be a highly acidic medium that allows more protons to protonate active groups. Concurrently, the positive charge regions on OP and the rivalry for adsorption sites between excess H+ and two rare earth ions lead to lower adsorption rates [30]. With elevated pH, the binding sites perform deprotonation, yielding more negatively charged ligands, followed by an enhancement of adsorption capacity for La(III) and Y(III). From another perspective, other dissociation equilibria and anion concentration such as hydroxyl ions are increased at alkaline pH (6.0 and above the pKa). Consequently, the elements lanthanum and yttrium probably present in the form of hydroxyl complexes, changing their species into [M(OH)] n x- [33]. In that case, the adsorption for La(III) and Y(III) onto OP will be degraded. Combining with the FTIR observation of OP, ion exchange and electrostatic interactions exist in the adsorption process, and the potential functional groups such as the O-H, C=O, and C-O groups assume the main responsibility for binding La(III) and Y(III) ions [30].
3.2.2. Effect of Adsorbent Dosage
Figure 5 shows that the adsorption rate of La(III) and Y(III) increases as the dosage equally increases. This trend is attributed to increasing adsorbent particles at fixed concentrations, sufficient amounts of active sites, and available cites around rare earth cations together with larger specific surface area, resulting in stronger cation-adsorbent interactions [17]. The sharp decrease of the
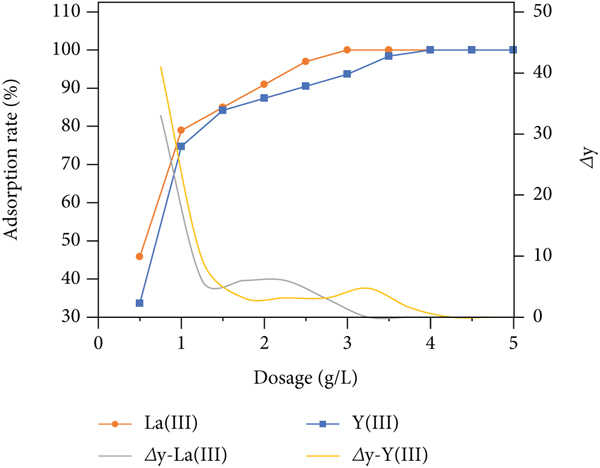
Effect of dosage on the adsorption of La(III) and Y(III) by OP (room temperature,
3.2.3. Effect of Temperature
As indicated from the Figure 6, the adsorption process undergoing two stages as the temperature continues to go up. The first one is growth of the adsorption rate, reaching a maximum about 40°C with 95.49% and 76.31% for La(III) and Y(III) by OP, respectively. The higher adsorption rate results from the rising temperature generates driving force to boost the flowability of granules and molecules, thereby facilitating contact between ions and active site of OP [37]. Then, the rates drop sharply in the second stage demonstrates that the process is endothermic and spontaneous [38]. Explicably, overtemperature has the potential to destroy the properties of OP and destabilize rare earth cations, which subdue the positive reaction of adsorption.

Effect of temperature on the adsorption of La(III) and Y(III) by OP (
3.2.4. Effect of Contact Time
Figure 7 shows that the adsorption was preliminarily faster within 15 min, the remaining adsorption sites are unemployed as a result of inadequate contact time. Whereafter, the adsorption rate becomes sluggish and achieves adsorption equilibrium at about 30 min. This trend means that the available sites are basically occupied, La(III) and Y(III) progressive enter the micropores of OP, causing a step-down in adsorption velocity owing to the mass transfer resistance on the OP inner wall. This is because the adsorption rate depends on the presence of empty adsorption sites and a high gradient concentration of solute [33]. Prior to the dynamic equilibrium, the OP surface endows with abundant exchangeable sites and porous domains of the adsorbent, which have greater accessibility for the ion binding. As the reaction proceeding, adsorption rates reach the maximum and then remain stable, which indicates that the OP adsorption tends to be saturated.

Effect of time on the adsorption of La(III) and Y(III) by OP (room temperature,
3.2.5. Effect of Initial Concentration
Further analyses include a set of optimum dosage experiments (

Effect of initial concentration on the adsorption of La(III) and Y(III) onto OP (room temperature,
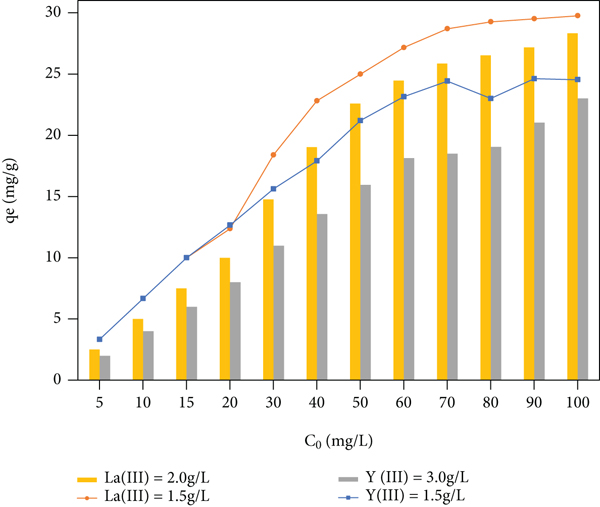
By contrast, the adsorption rate of the optimum dosage groups (
3.3. Adsorption Isotherm
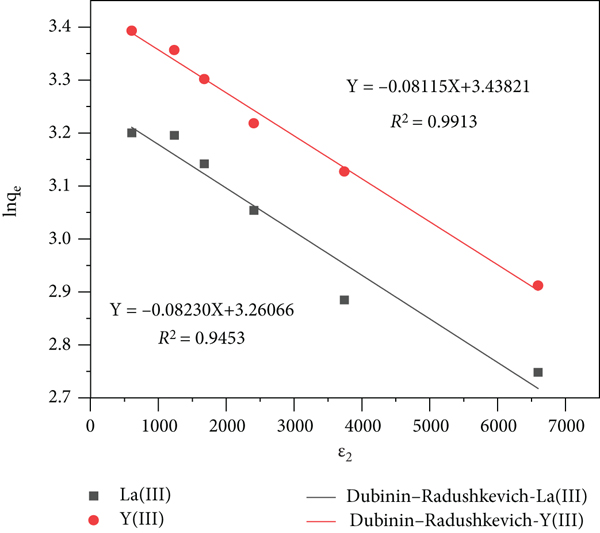
The equilibrium behavior of sorbents can be elucidated by isothermal adsorption models [30]. Langmuir, Freundlich, and Dubinin–Radushkevich (D-R) models are utilized to fit the experimental data (Figure 9). These models describe the adsorption property of adsorbents. One is that the surface may exist as a homogeneous or heterogeneous system; the other is monolayer (single surface contact) or multilayer form (readsorption caused by the adsorption force field). In addition, information concerning the energy distribution of active sites and interactions between adsorbed molecules at the solid-liquid interface is obtained [18, 39].

(a) Langmuir, (b) Freundlich, and (c) D-R isotherm plots for adsorption of La(III) and Y(III) onto OP.

Generally, the Langmuir isotherm assumes monolayer coverage of the adsorbent surface [40]:
The Freundlich isotherm assumes multilayer adsorption and a heterogeneous adsorbent surface [35]:
The D-R model describes the adsorption mechanism that does not assume a homogenous surface or constant adsorption potential [41], which conduce to the explanation regarding homogeneous and heterogeneous adsorption surfaces. The linear plot representation of the D-R equation is defined as
The universal gas constant is given as
where
In this study, the best fitting results among the isothermal models are determined by applying the SSE and EABS error functions [30]:
Relevant parameters on the experimental data of the La(III) and Y(III) adsorption are as given in Table 1, and Figure 9 shows the linear plots of isotherm models. The
Isotherm parameters for La(III) and Y(III) adsorption onto OP.
According to the Langmuir mathematical equation, the maximum adsorption capacity of La(III) and Y(III) is estimated to be 37.6 and 31.1 mg/g, respectively. The adsorption mode of La(III) and Y(III) onto the OP surface is predominantly monolayer which provides a single site to attach each ion. Since the
Although the Freundlich equation is an empirical one, the adequate description of adsorption data in a restricted concentration range is worthy of reference [40]. With the magnitude of
3.4. Adsorption Kinetics Studies
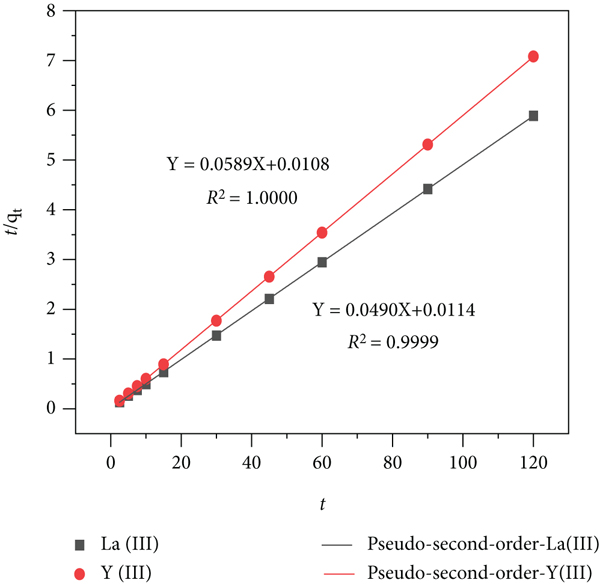
The pseudofirst-order (Equation (11)) and pseudosecond-order (Equation (12)) are performed to investigate adsorption kinetics of La(III) and Y(III) onto OP.
The fitting parameters and the linear plot are depicted in Table 2 and Figure 10. It is observed from the results that biosorption kinetics of La(III) and Y(III) on OP are well contoured by the pseudosecond-order equation. Consequently, the adsorption process mainly acts as the rate-controlling factor. On the other hand, the
Parameters of kinetic models for adsorption of La(III) and Y(III) onto OP.

(a) Pseudofirst-order and (b) pseudosecond-order kinetic linear plots for adsorption of La(III) and Y(III) onto OP.
3.5. Comparison of Various Adsorbents
Other untreated adsorbents for La(III) and Y(III) are presented in Table 3. The results exhibit better adsorption capacity of OP adsorbent compared to the leaf, shell, and bone waste. As expected, modification of materials has increased their adsorption efficiencies, whereas the assessment of adsorbent more to the point if efficiency, availability, reusability, and economic aspect are considered [30]. It is noteworthy that the unmodified wastes also have competitive sorption capacity.
Comparison of orange peel adsorption capacity with other natural adsorbents for removal of La(III) and Y(III).
Among biosorbents, OP has attracted more attention. The
4. Conclusions
The study herein indicates that OP as an economical adsorbent in practice is a good alternative for costly adsorbents. The adsorption rates are as high as 93.98% and 90.52% at a pH of 6.0, temperature of 40°C, and dosage of La(III) and Y(III) are 2 g/L and 3 g/L in initial ion concentration of 32 mg/L with the contact time more than 30 min.
The priority of adsorption equilibrium data fitting obeys this order: Langmuir > Dubinin-Radushkevich > Freundlich. The adsorption process is dominated by monolayer chemisorption. In addition, the adsorption kinetics of La(III) and Y(III) onto OP are preferable described by the pseudosecond-order model. The characterization results reveal that the metal ion adsorption onto OP is a spontaneous physical-chemical interaction, and the OP surface sites, porous domains, and functional groups are contributed to the adsorption mechanism. In accordance with the present study finding, natural OP presents a promising biosorbent for eliminating La(III) and Y(III) from the aqueous solution.
Footnotes
Data Availability
The data that support the findings of this study are available from the corresponding author (VS) upon reasonable request.
Conflicts of Interest
The authors declared that there is no conflict of interest.
Acknowledgments
The authors gratefully acknowledge the financial support from the National Natural Science Foundation of China (51964014) and the Program of Science and Technology Research, Education Department of Jiangxi Province (GJJ200814).