
Abstract
Wetting is strongly influenced by adsorbate layers, which are omnipresent on surfaces. The influence of the composition and thickness of adsorbate layers on the water contact angle of sessile drops on different substrates was systematically investigated in the present work. Measurements were carried out for gold-sputtered substrates. These new results are compared to results from a previous study, in which corresponding measurements were carried out for technical steel and titanium substrates. In all experiments, different pretreatments of the samples were used to obtain variations of the adsorbate layer. The samples were either exposed to an oil bath or not, and different cleaning agents were used. The analysis of the adsorbate layer was carried out with X-ray photoelectron spectroscopy (XPS). The results for the different substrates reveal that the water contact angle depends mainly on the composition of the adsorbate layer. The substrate has only an indirect influence, as it influences the composition of the adsorbate layer. The thickness of the adsorbate layers was between 1.4 and 14 nm and was large enough to prevent a direct influence of the substrate on the water contact angle. It is shown that using the information on the adsorbate layer composition from XPS and the results for the water contact angle obtained for the gold samples alone, the water contact angles on the steel and titanium samples can be predicted.
1. Introduction
Wetting of surfaces plays an important role in many processes. It is well known that the wetting is strongly influenced by adsorbate layers on the substrate. Samples without adsorbate layers can only be obtained by special treatments such as plasma cleaning and storage in ultra-high vacuum. Such surfaces have been labeled as atomically clean surfaces, in contrast to technically clean surfaces [1], which are obtained using conventional cleaning methods and which are always contaminated by residues that form an adsorbate layer. Furthermore, methods for cleaning the surface of contaminants can cause the surface to oxide [2].
Early reports on the influence of adsorbate layers on the wetting were given by Langmuir [3] and Bangham and Razouk [4]. Since then, there has been a continuous interest in the topic, which has been tackled both by experiments as well as by modeling and simulation. However, predicting the influence of adsorbate layers on wetting is still an unsolved problem and there are debates even on fundamental issues: some authors report that contact angles are influenced by the underlying substrate for adsorbate layers with a thickness larger than 10 nm [5–8], while others state that there is no influence of the substrate on the contact angle when the adsorbate layer is thicker than 1-2 nm [8, 9]. The different findings are probably related to the nature of the adsorbate layer. All reports on a long-range influence of the substrate are for adsorbate layers of long-chain molecules, while the authors who did not observe an influence of the substrate on the contact angle for an adsorbate layer thicker than 1-2 nm studied surfaces contaminated with simpler molecules. Their observations are in good agreement with molecular considerations: nonionic interactions fade out quickly with increasing distance of a particle to a surface. The distance of 1-2 nm corresponds roughly with 5-10 diameters of small molecules, which is enough for nonionic interactions to fade out essentially. The present study focuses on the influence of adsorbate layers on the wetting of technically clean samples. The adsorbate layers on these surfaces are usually thicker than 1-2 nm and do not contain long-chain molecules. The working hypothesis of this study is that for these adsorbate layers, the substrate has no direct influence on the wetting, such that the wetting depends only on the composition of the adsorbate layer.
Fox and Zisman [10] classified solid surfaces into two categories, i.e., high- and low-energy surfaces. The high-energy surfaces include metal, metal oxides, and siliceous gases, whereas the low-energy surfaces consist mainly of organic components [11]. On high-energy surfaces most liquids spread completely, i.e., the contact angle is 0° [12]. For atomically clean gold surfaces, Bernett and Zisman [13] and Schrader [11] observed complete wetting with water. However, high-energy surfaces tend to lower their surface free energy by attracting organic residues. The lowered energy of the surface results from physisorption and chemisorption; it leads to an increase of the contact angle and varies with the sample pretreatment [11]. Surveys of the literature show that reported values for water contact angles on gold surfaces vary between 0° and 95° [14, 15]. Also, more recent results lie in this range: Barriga et al. [16] report a water contact angle of 76° on gold-sputtered surfaces; Feng and Zhao [17] investigated the water contact angle on gold-sputtered polydimethylsiloxane. For the thickest gold layer (10 nm) at a humidity of 31%, they observed water contact angles that varied between 80° shortly after the sputtering and 91° after storing the sample for three days. Canning et al. [18] investigated gold-sputtered surfaces, which were cleaned in water and pristine. The water contact angle on the pristine sample was 84°, while for a sample that was pretreated with water 74° were measured immediately after cleaning. All numbers reported above refer to room temperature.
The composition as well as the thickness of adsorbate layers can be studied experimentally by X-ray photoelectron spectroscopy (XPS). XPS is a surface analytical technique, which yields detailed information on chemical properties of surfaces and therefore on the adsorbed residues [19]. In the present work, XPS surface analysis is combined with measurements of water contact angles in order to establish relations between the adsorbate layer composition and the contact angle. Studies in which contact angle and XPS measurements were combined have already been carried out for low-energy and high-energy surfaces (see, e.g., [20–25]).
The experimental work was carried out for gold-sputtered substrates, which show practically no surface roughness. In the experiments, different pretreatments of the samples were used to obtain variations of the adsorbate layer. The present study is closely connected to a previous study by Becker et al. [20], in which the same procedures were applied to technical steel and titanium samples.
The intrinsic contact angle
The present paper is organized as follows: first, the analytical techniques and the experimental procedure are described; then, the results are presented and discussed together with those from Becker et al. [20]. Then, the conclusions are drawn.
2. Experimental
2.1. Materials
The samples studied in the present work were prepared in the Nanostructuring Center (NSC) of Technische Universität Kaiserslautern. Silicon (Si) wafers were sputtered first with a 15 nm layer of chromium (Cr) for better attachment of the subsequent gold (Au) layer with 100 nm. The sputtering process was conducted in an Oerlikon UNIVEX 450 C. The samples had a size of

Surface topography of a typical gold-sputtered sample studied in the present work. Results from white light interferometry.
The oil used in this study is a synthetic poly-alpha-olefin (PAO) obtained from Evonik Industries according to SAE class 0 W 20 based on a blend of two poly-alpha-olefines (PAO4, 18.6 wt.% and PAO6, 65.0 wt.%) and an ester (Plastomoll DNA, 10.0 wt.%). As additive and antioxidant, a solution of multifunctional dispersant viscosity-index improver (Viscoplex® 6-850: dispersant polyalkyl methacrylate (PAMA), 6.4 wt.%) is included; no friction or wear-protection additives are included. The cleaning agents used in this study are two nonreactive solvents: cyclohexane with a purity better than 99.9% (Sigma-Aldrich) and acetone with a purity better than 99.8% (Fisher Scientific). For the sessile drops, ultrapure water (ASTM type I) obtained from a Milli-Q® (Merck) system was used.
2.2. Sample Pretreatment
The gold-sputtered samples were stored in a desiccator. During transport and storage, the gold samples were put on aluminum foil in a closed casket. Between sputtering and XPS analysis, the samples were always stored at least for one day.
After sputtering, the gold samples have a clean surface. For this reason, some gold samples were analyzed by XPS and water contact angle measurements without any cleaning procedure. These samples are called no-cleaning (NC) samples in the following.
Additional samples were subjected to different cleaning procedures. They are split into two classes: there are “oil samples” that were exposed to an oil bath with the synthetic poly-alpha-olefin before cleaning and “no-oil samples” that were not exposed to that oil bath. The oil samples remained in the oil bath for
To avoid changes in the adsorbate layer on the substrate, the samples were brought in the vacuum of the XPS spectrometer immediately after the cleaning procedure. In the XPS spectrometer’s sample entry the samples stayed at a decreased pressure of
2.3. Surface Analysis by X-Ray Photoelectron Spectroscopy
The analysis of the surface chemistry was done by X-ray photoelectron spectroscopy (XPS) with an Axis Nova surface analysis spectrometer (Kratos Analytical Ltd.). In this system, photoelectrons are released from the sample’s surface by monochromatic Al K
Two different XPS measuring modes were used: relative atomic concentrations
The atom number fractions in the adsorbate layer
All measurements were conducted at two different detector angles

XPS survey and detail spectra of a gold-sputtered silicon wafer measured at a detector angle of 90° to the surface, after cleaning three times in a supersonic bath with cyclohexane (CCC sample). Counts per second (CPS) are plotted as function of electron binding energy.

Au4f detail spectrum

C1s detail spectrum
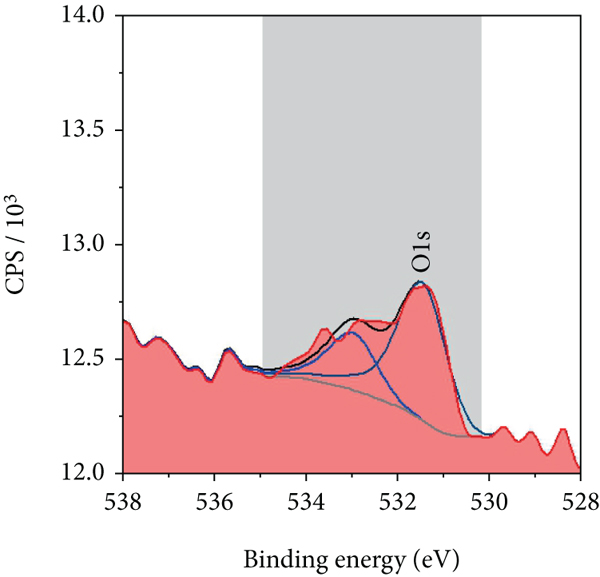
O1s detail spectrum
Information on the binding states of the detected elements C, O, and Au was obtained from XPS detail spectra, cf. Figure 2 (C1s, O1s, and Au4f regions). The C1s region contains signals from carbon-species in three different binding states: carbon bound in aliphatic and aromatic hydrocarbon at an electron binding energy of 285 eV, carbon with one oxygen as binding partner at 286.6 eV (typical for organic hydroxyl or carbonyl groups), and carbon with two oxygen atoms as binding partners at 288.4 eV (typical for carboxyl groups). In the following, carbon bound in nonpolar aliphatic or aromatic hydrocarbons (signal at 285 eV) is called “nonpolar carbon”, with a corresponding atom number fraction in the adsorbate layer of
A comparison of photoelectron intensities that were measured at the two different detector angles is given in Figure 3 in form of a contrast diagram. The contrast
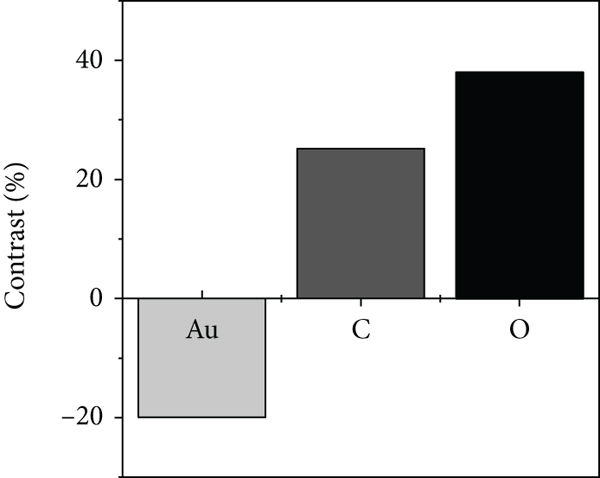
Contrast diagram, comparing the Au4f, C1s, and O1s photoelectron intensities measured at 90° and 30° detector angle for a CCC sample. The contrast is defined in Equation (5).
While a contrast of zero would mean that there is no profound depth distribution of the detected elements, a positive contrast indicates an enrichment near the surface, while a negative contrast indicates an enrichment in the deeper regions. Hence, the positive contrast of C and O implies that both are in the adsorbate layer, while the negative contrast of Au is conform with it being the substrate. The strongest positive contrast is detected for O, which implies that O is located even higher than C and that the adsorbate layer has a spatial substructure. Si of the wafer or Cr of the attachment layer under the Au were not detected.
The thickness of the organic layer
The statistical uncertainty that is reported here for the results of the adsorbate layer thickness and the atom number fractions is the standard deviation obtained from the results of three measurements that were carried out for each sample.
2.4. Contact Angle Measurement
The water contact angles were measured with a Krüss DSA 100 drop shape analysis system. This analysis system consists of a light source and a camera, which records the shadow pictures of the sessile drop. The DSA 100 is equipped with a thermostatted chamber that provides a water-saturated nitrogen atmosphere, such that the droplet does not evaporate. After a steady state in the chamber was reached, a drop with a volume of 5 μl was deposed on the sample. The temperature was
3. Results
The results of the XPS analysis and the water contact angle measurement are summarized in Table 1.
Water contact angle
Two independent runs were carried out for the CCC, AAA, and NC samples that were not exposed to oil. The water contact angles range from 81° to 93° and the adsorbate layer thickness from
In the following, the results of this work are discussed together with the results of Becker et al. [20] who used the same sample pretreatment as well as the same wetting liquid (water) as in the present work. Becker et al. [20] used not only acetone and cyclohexane as cleaning agents but also isopropyl alcohol and an aqueous solution of hydrogen peroxide. Isopropyl alcohol is a nonreactive polar solvent and gave similar results for the water contact angle and adsorbate layer as acetone. Therefore, we refrained here from additional measurements with isopropyl alcohol. Nevertheless, the results of this work are discussed together with those for isopropyl alcohol from Becker et al. [20]. The samples cleaned with isopropyl alcohol are called “III samples” in the following.
Hydrogen peroxide forms hydroxyl radicals on steel and titanium surfaces and leads to an oxidation of the surface [32, 33]. Additionally, it has a low cleaning power regarding the oil used in the present work and leaves puddles of oil on the samples (cf. Appendix). These puddles lead to a chemical inhomogeneity of the surface and cause the results for the water contact angle and the data on the adsorbate layer to vary strongly. Therefore, no investigations with aqueous solutions of hydrogen peroxide were carried out in the present work. Furthermore, the results of Becker et al. [20] for hydrogen peroxide, which showed a different behavior than the other cleaning agents for the reasons given above, are not used for discussion. Table 2 lists the results of Becker et al. [20] that are used in the present work.
Results of Becker et al. [20] for the water contact angle
The literature data on the water-wetting of gold surfaces was already discussed in the Introduction. Different treatments of the samples resulted in strongly varying contact angles in these studies; furthermore, no information on the composition of the adsorbate layers is available. They were therefore not included in the present comparison.
3.1. Adsorbate Layer Thickness
Figure 4 shows the cosine of the Young water contact angle as a function of the adsorbate layer thickness measured for gold, steel, and titanium substrates after the different pretreatments. The adsorbate layers on the gold substrates are much thinner than those on the other two substrates. This could be caused by two effects: the differences in the substrate material (gold is inert) as well as variations of the roughness (the gold samples were practically ideally flat). The differences in the material are dominant here, as the roughness factor
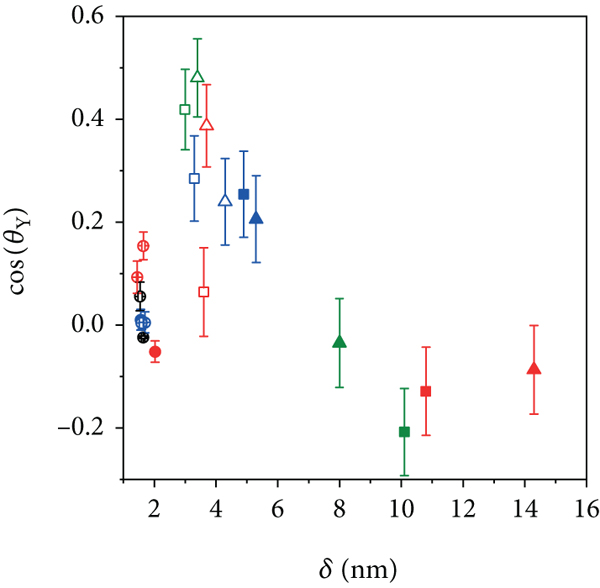
Cosine of the water contact angle
Different reasons for the variation of the contact angles on the steel and titanium substrates have been discussed by Becker et al. [20]: the variation of the adsorbate layer thickness as well as the variation of the adsorbate layer composition. However, based on their results alone, the different possible reasons could not be discriminated clearly. This is now possible by including the results for gold. The variation of the water contact angle on the gold samples can not be caused by the layer thickness (which hardly varies). Hence, the variation of the contact angle must be caused by the variation of the adsorbate layer composition.
3.2. Adsorbate Layer Composition
The results for the adsorbate layer composition obtained by XPS are shown in a ternary diagram in Figure 5 as a function of the atom number fractions of oxygen, polar carbon, and nonpolar carbon. Surprisingly, despite the vast differences between the substrates and the pretreatment of the samples, the results for the adsorbate layer composition lie almost on a single straight line in Figure 5. A fit yields the following one-parametric empirical relation:

Atom number fractions of oxygen
The three atom number fractions
The results from the independent measurements for the gold samples that were not exposed to oil (open circles of the same color in Figure 5) enable assessing the experimental error, which is considerably higher than the standard deviation of the results obtained on one sample (cf. Table 1). However, the trend described by Equation (8) is confirmed.
The composition of the adsorbate layer on the gold samples (circles in Figure 5) generally shows high concentrations of nonpolar carbon (
The findings for the gold samples that were exposed to an oil bath (full circles in Figure 5) are difficult to interpret. While for the gold sample cleaned with acetone and treated with oil the composition of the adsorbate layer is close to that without an exposure to the oil, this is not the case for the gold samples cleaned with cyclohexane. The adsorbate layer of the gold sample cleaned with cyclohexane that was exposed to oil shows a particularly low concentration of nonpolar carbon. This is completely unexpected. The additives in the oil could possibly lead to polar residues on the sample which could not be removed by cyclohexane. Unfortunately, no independent repetition of that experiment was carried out; we can therefore not exclude an experimental error.
The steel and titanium samples (triangles and squares in Figure 5) have adsorbate layers that contain distinctly more polar groups (
For the steel and titanium substrates, as expected, the amount of nonpolar carbon in the adsorbate layer increases when they are exposed to the nonpolar oil. Interestingly, cleaning with acetone leads to a higher concentration of nonpolar carbon in the adsorbate layer than cleaning with cyclohexane. This is probably due to an ineffective removal of the nonpolar oil by the polar acetone, an interpretation which is supported by the same findings for isopropyl alcohol.
To summarize, the gold surfaces show an affinity to nonpolar adsorbates, whereas the steel and titanium surfaces show an affinity to polar adsorbates. The influence of the cleaning process on the adsorbate layer composition is not dominant, but the results indicate that residues of the cleaning agents are present in the adsorbate layer. Exposing the samples to an oil bath has a strong influence on the adsorbate layer composition for the steel and titanium samples, even after the thorough solvent cleaning in an ultrasonic bath and the exposure of the samples to ultra-high vacuum. Ineffective cleaning of oil with polar solvents leads to increased concentrations of nonpolar carbon in the adsorbate layers for the steel and titanium substrates. The corresponding results for the effect of the oil exposure on the adsorbate layer on gold substrates are inconclusive.
Based on these unexpectedly simple findings for the composition of the adsorbate layer, the hypothesis that the water contact angle depends mainly on the composition was studied in more detail. Figure 5 suggests that the composition of the adsorbate layer can be represented by a single parameter, cf. correlation given in Equation (8). Following the hypothesis of this work, it should also be possible to represent the data on the water contact angle as a function of a single parameter that describes the composition of the adsorbate layer. Different variants of choosing this parameter were tested in a preliminary study and particularly simple results were obtained using the fraction

Cosine of the water contact angle
Equation (9) does not only represent the gold results well but also gives good predictions for most of the data for the steel and titanium samples. Most of the data shown in Figure 6, including the strongly differing substrates and cleaning procedures, lies within a band of
4. Conclusions
The working hypothesis of the present study was that for adsorbate layers on technically clean surfaces the substrate has no direct influence on the wetting, such that the wetting depends mainly on the composition of the adsorbate layer. This hypothesis was put to an experimental test and confirmed.
Adsorbate layers on gold-sputtered silicon wafers were analyzed regarding the adsorbate layer thickness and composition using X-ray photoelectron spectroscopy (XPS), and the XPS analysis was combined with water contact angle measurements. To induce variations of the adsorbate layer, the investigated gold samples were pretreated in various ways: some samples were not cleaned after the sputtering; other samples were cleaned with different cleaning agents (acetone and cyclohexane) in an ultrasonic bath—after having been treated in an oil bath or without such a treatment.
Becker et al. [20] have carried out a corresponding study on technical steel and titanium samples, such that the results from the present work and theirs can be compared directly, i.e., a large amount of data on adsorbate layer compositions and water contact angles, which includes data for strongly differing substrates and treatments, is available.
It was found that the adsorbate layer thickness
The adsorbate layer composition is influenced by the substrate and its treatment. Surprisingly, despite the differences between the substrates and their treatments, the adsorbate layer composition of all samples can be described by a one-parametric empirical correlation. The gold samples show an affinity for nonpolar adsorbents and the steel and titanium samples an affinity for polar adsorbents.
The water contact angle on all substrates was found to be closely related to the composition of the adsorbate layer. As expected, an increase in the polarity of the adsorbate layer leads to a decrease of the water contact angle. This trend was described quantitatively by an empirical correlation obtained for the results of the gold samples in the present work. In a second step, this correlation was applied to predict the data of the steel and titanium samples, which were not included in establishing the correlation. The data for the steel and titanium samples is predicted astonishingly well, using only the information obtained from the gold samples, and despite the simplicity of the empirical approach. No information about the underlying substrate or about the adsorbate layer thickness is used by this correlation.
We do not claim to have found a universal relation between the water contact angle and the adsorbate layer composition. But the results strongly indicate that, in principle, such a relation exists, at least for adsorbate layers as they are found on technical surfaces. The basic message is important: contact angles measured on technical surfaces do not probe the substrate; they probe the adsorbate layer on the substrate. More generally, only the first 1-2 nm of the components below the wet interface are important for typical wetting contacts, leaving apart specially designs such as polymer-grafted surfaces. This does not mean that there is no influence of the substrate, but this influence is only indirect: the substrate influences the adsorbate layer. The adsorbate layer, however, depends not only on the substrate but also on the treatment of the samples.
The previous discussion is based on the assumption that the adsorbate layer is homogenous. The present experimental results indicate that this might not always be a good assumption. Inhomogeneities in the adsorbate layer can be expected as the adsorbate layer is in general a mixture of components of different properties for which the substrate has varying preferences. This must lead to different compositions of the adsorbate layer near the solid substrate and near the wet interface, which determines the contact angle.
The combination of XPS analysis and contact angle measurements, as it was applied here, is very useful for gaining a better understanding of the wetting of technical surfaces. It also holds promise to create a quantitative theory. As a next step towards this goal, it would be interesting to use the methods established here for studying the wetting of surfaces with different liquids. It would also be desirable to gain more detailed information of the composition of the adsorbate layer, including data on the composition in different depths.
Footnotes
Appendix
Data Availability
The contact angle and XPS data used to support the findings of this study are included within the article. Additionally, previously reported contact angle and XPS data were used to support this study and are available at doi:10.1177/0263617416645110. This prior study is cited at relevant places within the text as Becker et al. [![]() ].
].
Disclosure
Kai Langenbach’s present address is Thermal Separation Science (endowed professorship of the state Tyrol), University of Innsbruck, Austria.
Conflicts of Interest
The authors declare that there are no conflicts of interest regarding the publication of this paper.
Acknowledgments
The authors gratefully acknowledge financial support of the present work by the Deutsche Forschungsgemeinschaft (DFG, German Research Foundation, Project ID 172116086-SFB 926). They appreciate the collaboration with the Nano Structuring Center of the Technische Universität Kaiserslautern who carried out the sputtering of the gold samples.