
Abstract
In this work, the ability of pectin (Pec) to remove direct red 80 (DR80), Congo red (CR), methyl orange (MO), and methyl red (MR) was studied. The removal percentages under adequate pH and ionic strength conditions were as follows: DR80 (99.5%), CR (99.8%), MO (88.6%), and MR (68%), showing that this methodology is efficient to remove azo dyes. The proposed method included the addition of native Pec to the dye aqueous solution and the formation of a gel that occurred when a calcium salt solution was added. This gel retains the molecules adsorbed onto the molecular surface of Pec through hydrogen bonds and electrostatic and hydrophobic interactions. To our knowledge, it is the first time that the Zimm-Bragg model is used to describe the removal of azo dyes with native Pec. This model includes two parameters:
1. Introduction
The azo dyes correspond to a group of synthetic compounds, which are characterized by including the azo group (-N=N) in their structure and by imparting a wide variety of colors in the different substrates where they are applied. These compounds are widely used in the cosmetic industry, photography, and optoelectronics, in the staining of different biological tissues and cells, in the dyeing of leather, in the textile industry, etc. [1]. However, it is known that these dyes are carcinogenic and it has been reported that when they are degraded anaerobically, toxic amines are produced [2]. Due to these adverse effects, alternative methods have been sought in the staining process. One of these methods is the use of supercritical fluids for the fixation of different dyes to several fibers [3]. However, only supercritical carbon dioxide has been applied to reactive and disperse azo dyes, and this has limited application [4–6], and unfortunately, nowadays the wet staining process is still used in the dyeing of different textile fibers [7]. As a consequence, this generates environmental problems by discharging effluents with these dyes to different water bodies. Moreover, the problem becomes more complex because it is known that from of all of the dyes produced annually, azo dyes correspond to 65-70% approximately [8].
Given these facts, sustainable methods are required to decrease the concentration of these dyes in wastewater. Among these methodologies, the use of biopolymers such as pectin (Pec) is considered a good strategy due to its high availability in nature [9].
This heteropolysaccharide is formed by a polygalacturonic acid backbone that can form esters with methanol (high methoxyl pectins (HMP)) or form sodium, potassium, calcium, and ammonium salts mainly (low methoxyl pectins (LMP)). Additionally, it contains sugar residues such as rhamnose, galactose, arabinose, fucose, mannose, xylose, and glucose among others and is used as a thickener and gelling agent in the food industry, due to its high capacity to form gels in the presence of high concentrations of sucrose (HMP) and the presence of calcium salts (LMP) [10].
Recently, different compounds obtained from Pec including hydrogels, grafting products, and nanocomposites have been used to remove several pollutants such as metal ions (Pb
In a more specific way, it has been reported that polygalacturonic acid regions of LMP react with
2. Materials and Methods
2.1. Materials
Pectin from citrus peel (
2.2. Optimization of Dye Removal Conditions
A Pec hydrated solution (1%
2.3. Removal Isotherms
Several dye solutions with different concentration values within the range of 0-4000 mg/L were prepared to take into account the specific pH and IS values of each dye determined from the previous section. A Pec solution aliquot with the same values of pH and IS was added to an equivalent volume of each dye solution, and the final concentration of each dye ranged from 0 to 2000 mg/L. The resulting solution was mixed vigorously for 15 min, and the addition of an aqueous solution of
2.4. Application of the Adsorption Models to Experimental Isotherms
The Langmuir model is described by the equation:
where
Both
By rearranging the Langmuir equation, the following linear form is obtained:
In this sense, when
The theoretical parameters of the Langmuir model can be obtained by fitting the linear form (4) to a set of experimental data. The linear regression process allows estimating the intercept and the slope of a linear model and provides statistical information about the estimated parameters as well as the linear model, such as the standard deviation of the estimated parameters and the model. In this work, the statistical software R [31] was used for applying the linear regression to the experimental data and for estimating the
The equation of the Freundlich model is as follows:
where
The application of the logarithm function to equation (5) allows obtaining a linear form given by the following expression:
In the same way as the linear form of the Langmuir model, a graph of log
The Zimm-Bragg model has been applied and reported as an adsorption model by our group [32]. In this work, the theoretical parameters of the Zimm-Bragg model,
Additionally to the estimated parameters, several goodness-of-fit measures are reported such as the coefficient of determination (
2.5. Visible Studies
The electronic absorption spectra of all of the dyes were obtained in a Thermo Scientific spectrophotometer (evolution 201) in the range of 400 to 800 nm, and the effect of the following variables on them was studied.
2.5.1. Effect of the pH
Several aqueous solutions of each dye (
2.5.2. Effect of Dye Concentration and the Presence of Pec
Different dye solutions at different concentration values (5-200 mg/L) were prepared under the optimal removal conditions of pH and ionic strength corresponding to each dye. This was done in the presence and absence of Pec (1%
2.5.3. Effect of the Formation of the Pec-Ca Gel
Some of the Pec-dye solutions prepared in the previous section were used to obtain the Pec-dye-Ca product. This compound was prepared with the addition of CaCl2 (5%
In the last experiments (Sections 2.5.2 and 2.5.3), the path length of the cell was modified to adjust the absorbance at lower values than the maximum detection limit of the spectrophotometer; consequently, the absorbance values observed do not correspond in a linear relationship with the concentration of each dye.
2.6. Infrared and Raman Studies
FT-IR spectra of all dyes, Pec-Ca, and Pec-dye-Ca products (4000-600 cm-1) were obtained in a Jasco model 4600 series equipment (in an attenuated total reflectance mode), with a resolution set at 1 cm-1, and each spectrum resulted from 64 scans. The Raman spectra (2000-400 cm-1) of the same dyes and compounds were obtained in a Micro-Raman system (Horiba, model LabRAM HR Evolution) equipped with a 785 nm laser. The power used was 5%, and the integration time was 15 seconds. The different Pec-dye-Ca products were obtained as described in Section 2.3, and the only one sample considered to be analyzed was the last of each removal isotherm, corresponding to the maximum dye concentration value considered (2000 mg/L). Once the gel of each dye was obtained, it was washed with distilled water (5 times) to remove the unbound dye molecules. Then, the gel was frozen, lyophilized, and ground to obtain a fine powder. Finally, the FT-IR and Raman spectra were obtained in the same manner described for the dyes.
3. Results and Discussion
3.1. Optimization of Dye Removal Conditions
The dye removal efficiency of DR80, CR, MO, and MR azo dyes with Pec was evaluated at different pH and IS values (Figure 1).

Effect of pH and IS on the removal efficiency for the systems: (a) Pec-DR80-Ca, (b) Pec-CR-Ca, (c) Pec-MO-Ca, and (d) Pec-MR-Ca.


From Figure 1(a), it is observed that as pH is increased at high

The structure of different azo dyes used in this study: (a) DR80, (b) CR, (c) MO, and (d) MR.


Nevertheless, it has been reported that these galacturonate groups included in the smooth region of the Pec structure are involved in the formation of calcium pectate (Pec-Ca), which is the final product that retains DR80 and diminishes its concentration in the aqueous medium. In this sense, it has been reported that polygalacturonate regions similarly react with
Additionally, it has been reported that Pec consists of two principal regions: the “smooth region” and the “hairy region” [10]. The former contains a large number of galacturonate residues with ionizable carboxyl groups at high pH values. The hairy region contains mostly neutral sugars such as rhamnose, arabinose, xylose, galactose, fucose, mannose, and glucose among others, which results in a low charge density of this polysaccharide, and consequently, the repulsion exerted by Pec on DR80 is less than the result of the alginic acid-DR80 system. Even more, when the Pec-Ca gel is formed, the insertion of the Ca
In the same order, DR80 molecules interact with Pec through hydrogen bonds between the hydroxyl groups, oxygen atoms from the hemiacetal, and glycosidic bonds attached to Pec molecules and the sulfonate, hydroxyl, azo, and amido groups from this dye.
It has been found that high IS values from an aqueous environment favor the formation of aggregates in dyes whose molecules have aromatic rings that originate a planar geometry [35]. Additionally, Oakes and Dixon have proposed that the higher the number of aromatic rings in dye molecules, the bigger the dye aggregates, due to the
In this sense, the hairy region included in the Pec molecule is similar to some regions found in cellulose, due to the presence of neutral sugars that structurally resemble the
In Figure 1(b), the variation of the removal efficiency of CR is shown as a function of pH and IS for the system Pec-CR-Ca. It is observed that in the extreme pH values, the removal of this dye shows the maximum values. At
On the other hand, an increase in the pH causes the deprotonation of the CR. Consequently, its solubility is augmented, in such a manner that at
Otherwise, it can be seen in Figure 1(b) that as the IS decreases, the removal efficiency of the CR increases slightly. To explain this fact, it should be mentioned that for maximum dye removal, Pec must remain soluble in the aqueous medium. In this sense, Wang et al. [42] reported that an increase in the content of electrolytes at basic pH reduced the solubility of this polysaccharide. Therefore, the highest removal value obtained was at IS of 0.04 M. All these findings resulted in a removal efficiency of 99.8% at
Figure 1(c) shows the effect of pH and IS on the removal efficiency of MO by Pec. As can be seen, as the pH increases, the removal efficiency decreases notably. In this sense, by inspecting Figures 2(a)–2(c), it can be noted that the MO shows several differences in its structure and size concerning the DR80 and CR molecules. For example, the number of functional groups contained in the MO is less than those attached to the other two dyes (MO has only one sulfonate, dimethylamino, and azo groups). This means that at
Moreover, although sulfonate groups of different types of dyes are known to allow them to bind to fibers such as cotton, which contain hydroxyl groups onto their molecular surface [2], it was found that the affinity of MO for Pec is lower than that observed in RD80 and CR dyes, despite the similarity of the hairy regions included in Pec with the cellulose structure. In addition, the number of hydrogen bonds between the sulfonate, dimethylamino, and azo groups belonging to MO and the functional groups attached to the Pec molecule is less than those involved in the Pec-DR80-Ca and Pec-CR-Ca compounds.
On the other hand, as was mentioned before, the aggregation capacity of the dyes decreases as the molecular weight, the number, and the size of the aromatic rings included in the molecular structure are decreased [36]. In this sense, the MO molecule only contains 2 phenyl rings, and as a consequence, the size of aggregates adsorbed to hydrophobic regions of Pec is small; this results in low removal efficiency. In the same way, it has been reported that an increase in IS promotes hydrophobic interactions between dyes and polysaccharides [35]. As can be seen in Figure 1(c), the effect of the IS on the removal efficiency is almost slight, due to the small size and molecular weight, which as mentioned previously results in lower removal percentages of MO by Pec. Considering all of these findings, a maximum removal value of MO corresponding to 88.6% was obtained at
Figure 1(d) depicts the influence of pH and IS on the removal efficiency of the Pec-MR-Ca system. As can be observed, the pH affects in the same manner both MR and MO, except that this effect is more pronounced in MR dye, which results in lower removal values of this compound than those data found in the Pec-MO-Ca system. Figure 2 shows a high similarity between the structures of MO and MR, and it is evident that their structures are less complex than those corresponding to DR80 and CR.
In the same way, the chemical structures of MR and MO molecules are similar, except that in the case of MR, the sulfonate group in para position with respect to the azo group was substituted by a carboxyl group in the ortho position. This change will give rise to a
Interestingly, it is notable that the exchange of the sulfonate group in MO by carboxylate anion in MR affects the affinity of MR by Pec. This change causes a decrease in the ability of MR to interact with Pec through hydrogen bonding and a decrease in the number of aggregates of this dye, which diminishes the removal of MR by Pec. Additionally, the molecular weight of MR (291.28 g/mol) is smaller than that corresponding to MO (327.33 g/mol), which suggests that although the number of binding sites in Pec is the same for both compounds, the removal of the MR would be less in terms of effective mass.
On the other hand, Figure 1(d) shows that as the IS increases, the removal efficiency diminishes, and this trend is more pronounced at
3.2. Removal Isotherms and Application of the Models to Experimental Isotherms
As mentioned before, the Langmuir and Freundlich adsorption models have been applied widely in published reports to describe the experimental dye removal isotherms obtained when using pectin derivatives, nanocomposites, and blends of this polysaccharide with other compounds.
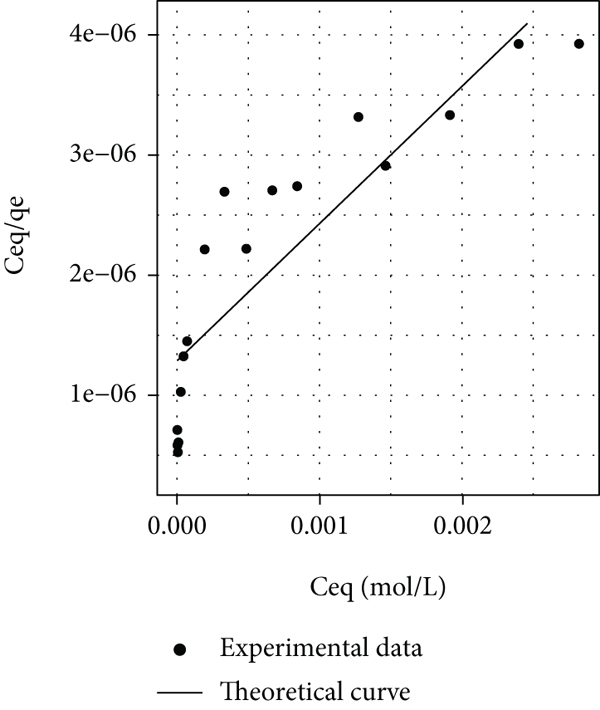
In this sense, these two models were used to describe the experimental isotherms of the four systems studied in this work. The linear form of the Langmuir model was applied to experimental data of all systems, and the parameter values and plots that resulted from this procedure are shown in Table 1 and Figures 3(a)–3(d), respectively. Figure 3(a) shows that this model did not fit the experimental data, because a graph with a decreasing behavior and an asymptotic tendency towards a minimum resulted when a
Parameters and goodness-of-fit measures from the linear form of the Langmuir model obtained by linear regression to experimental data from each Pec-dye-Ca system.

Comparison of experimental data with the fitted linear form of the theoretical Langmuir isotherm for the following systems: (a) Pec-DR80-Ca, (b) Pec-CR-Ca, (c) Pec-MO-Ca, and (d) Pec-MR-Ca.


Contrary to the above, Table 1 shows negative values of
On the other hand, the corresponding values of
Table 2 includes the estimated values of the Freundlich parameters (
Parameters and goodness-of-fit measures from the linear form of the Freundlich model obtained by linear regression to experimental data from each Pec-dye-Ca system.

Comparison of experimental data with the fitted linear form of the theoretical Freundlich isotherm for the following systems: (a) Pec-DR80-Ca, (b) Pec-CR-Ca, (c) Pec-MO-Ca, and (d) Pec-MR-Ca.
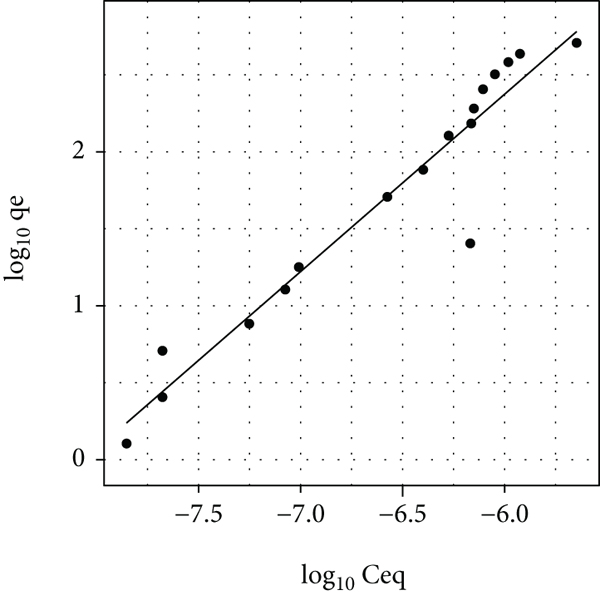


Figure 4(a) shows the log
In Figure 4(b), it can be seen that the Pec-CR-Ca system has similar behavior to that of Figure 4(a), but with a marked sigmoid tendency of the experimental data, which causes the value of
Figure 4(c) shows the graphical form of Freundlich’s linear equation for the Pec-MO-Ca system. In this figure, there is a great difference between the experimental data and the theoretical line that resulted from the Freundlich parameters reported in Table 2 for this system. Furthermore, the value of
Figure 4(d) shows that the Freundlich model fits better in the experimental data of the pec-MR-Ca system, which is demonstrated with a value of the coefficient of determination
Some researchers have suggested that the poor fit of the Langmuir and Freundlich models is because polysaccharides such as xanthan and alginic acid can bind single molecules and molecular aggregates of dyes to their molecular surface. But at the same time, these polymers can form a three-dimensional network by reacting with Al (III) and Ca (II) ions, respectively [47, 48]. This polymerization process gives rise to a gel that traps all the “aggregated and nonaggregated dye molecules” adsorbed to the molecular surface of these biopolymers.
As mentioned before, the gelation mechanisms of alginic acid and Pec are very similar; then, it is suggested in this study that the Zimm-Bragg model could fit with the experimental data from the Pec-dye systems. This model has been used by some researchers to describe the isotherms obtained when some alkyl pyridinium- and alkyl trimethylammonium-based surfactant reacted with different polymers such as sodium dextran sulfate, sodium poly(styrene sulfonate), polyacrylate, (carboxymethyl) cellulose, polyacrylate, alginate, and pectate [49–52]. Moreover, they found a good agreement between theoretical curves obtained with this model and the experimental data.
The Zimm-Bragg model describes the formation of polymer-surfactant complexes since it considers that polymeric molecules can bind from a single surfactant molecule to molecular aggregates (micelles). Moreover, it was reported that the presence of different polymers in an aqueous phase favors the formation of micelles, which resulted in a decrease in their critical micellar concentration (CMC) [53]. In this sense, the mathematical description of the interaction phenomenon of the surfactant with the polymers is similar to the binding of some dye molecules and their aggregates to biopolymers, such as alginic acid and xanthan [32, 34, 35, 47, 48]. Moreover, to our knowledge, it has not been reported in any work where this model adequately describes the removal isotherms of azo dyes with native Pec and its derivatives.
In this model, it is considered that one dye molecule attached to the Pec molecular surface promotes the binding of other dye molecules remaining in the bulk solution. This trend is described by the constant
where
These two parameters,
where
The theoretical parameters of the Zimm-Brag model can be obtained by fitting equation (9) to a set of experimental data. An empirical estimation of the
In this work, the nonlinear regression procedure of the statistical software R [31] was used for estimating the
Once the values of the parameters
Table 3 shows the values of the parameters of the Zimm-Bragg model for each Pec-Dye-Ca system, and Figure 5 depicts the experimental data and the theoretical isotherms that come from the substitution of
Zimm-Bragg model parameters obtained by the nonlinear regression process to experimental data from each Pec-dye-Ca system.

Application of the Zimm-Bragg model to the experimental data of the following systems: Pec-CR-Ca (open circles), Pec-DR80-Ca (open squares), Pec-MO-Ca (open triangles), and Pec-MR-Ca (open diamonds). The continuous lines represent the theoretical isotherms obtained from Zimm-Bragg parameters
Interestingly, the trend in the
However, this “anomaly” encountered in the Pec-CR-Ca and Pec-DR80-Ca systems was also found in that report, indicating that the high ability of CR to form highly ordered aggregates and supramolecular structures was the principal phenomenon that explained the highest
On the other hand, the
In the case of the cooperativity parameter (
From Table 3, it can be seen that the MR has the lowest
On the other hand, methylene blue (MB) and crystal violet (CV) are dyes that have a high aggregation capacity [54], and they have been removed by different compounds derived from pectin. Li et al. [19] conducted studies of MB adsorption by calcium pectinate gel in powder form (PG) and found that of the models used, the Langmuir model was the one that best fits the experimental adsorption isotherm (they obtained a value of the coefficient of determination
Otherwise, Rakhshaee and Panahandeh [22] synthesized pectin grafted with carbodiimide and nanoparticles of Fe
In the same way, Lessa et al. [56] synthesized calcium pectate/cellulose microfiber beads (PB-CF) to remove MB in the aqueous medium. This research group found that the Langmuir model fits adequately to the experimental data, which suggests that the cellulose microfibers embedded in the PB-CF particles modified the steric arrangement of the Pec, and the porosity of the material that promoted it would bind the monomeric MB molecules instead of the molecular aggregates of this dye. Consequently, it was assumed that there was an MB monolayer on the surface of PB-CF according to the fundamentals that support the Langmuir model.
On the other hand, Kodoth and Badalamoole [57] produced a nanocomposite obtained from the polymerization of 2-acrylamide-2-methyl-1-propane sulfonic acid (AMPS) and acrylamide (AAm) in the presence of N,N
Otherwise, Mirza and Ahmad [58] synthesized an alginate/Pec nanocomposite, which was obtained from the reaction of the mixture of an aqueous solution of these two polysaccharides with glyoxal at 323 K for 24 h. These reaction conditions favored the formation of acetal bonds between the hydroxyl groups of alginate and Pec with the keto group of glyoxal. In contrast to that described for
In summary, although there are reports of compounds based on Pec, the Zimm-Bragg model has not been used to describe the isotherms, probably due to the lack of perception of the aggregation phenomenon of the dyes that bind to the different Pec derivatives, and because the linear models of the Langmuir, Freundlich, and Temkin are generally used, the main adjustment parameter is the coefficient of determination (
3.3. Visible Studies
In order to understand the interactions between Pec and dyes, several spectroscopic techniques such as visible, FT-IR, and Raman scattering were used.
Figure 6 shows the variation of the electronic absorption spectrum of DR80 (
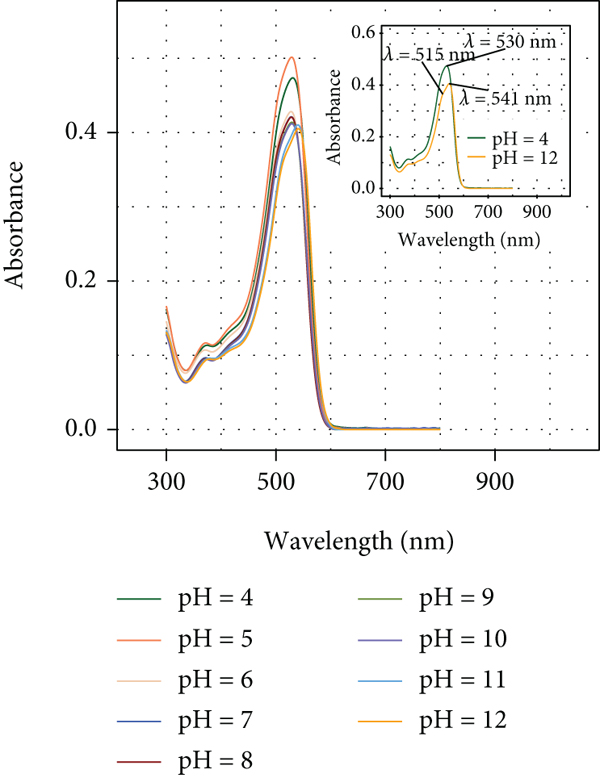
Visible absorption spectra of DR80 in aqueous solution at different pH values at
It was reported that the azo form predominates in methanol [60], whose band is located at
As the pH increases, slight changes are observed in the intensity of the absorption maximum. Notably, Figure 6 shows that the original peak at
In view of the fact that the highest removal value of DR80 using Pec was found at

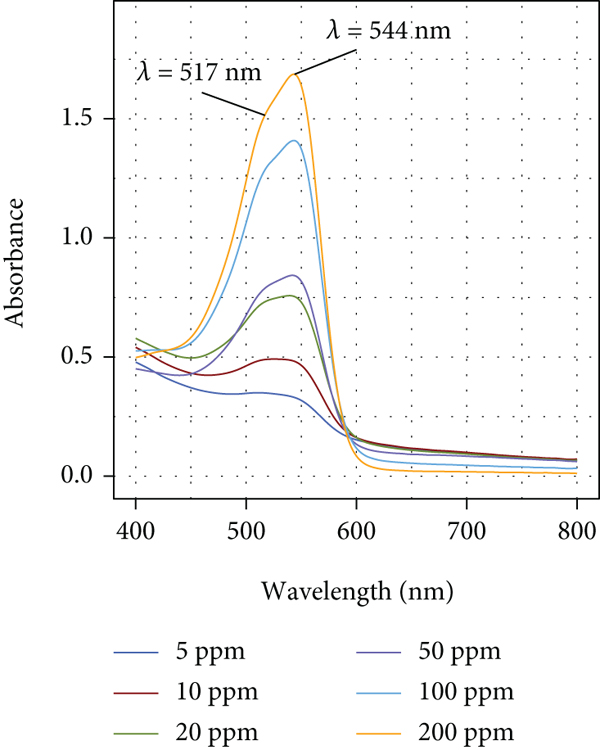
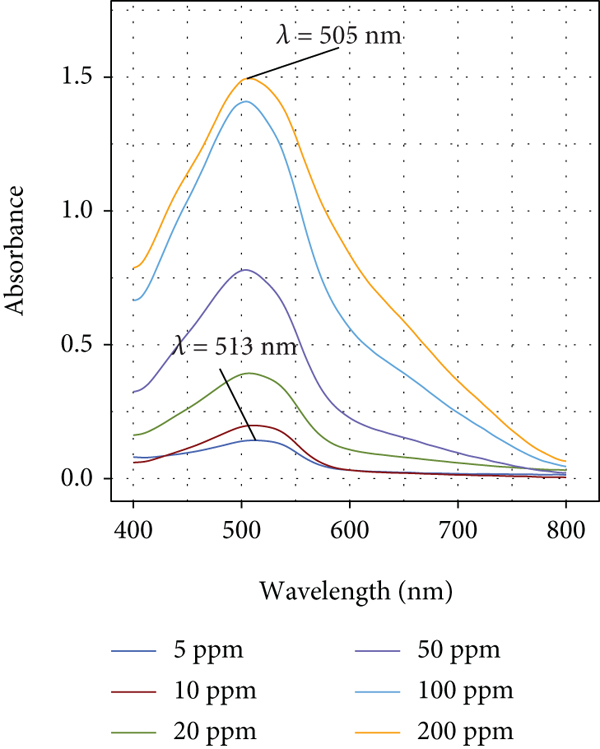
Visible absorption spectra of DR80 in aqueous solution at different concentration values (
It has been reported that in addition to the azo-hydrazone tautomerism, the formation of J-type aggregates also occurs in compounds that contain the hydroxyl group in ortho position to the azo group in aromatic compounds [62].
Figure 7 shows a band located at
Interestingly, when DR80 reacts with pectin, a bigger difference is observed between the location of the characteristic peaks of the azo and hydrazone forms (located at
Visible absorption spectra of DR80 in aqueous solution at different concentration values in the presence of Pec (1%
In addition, it has been that the β-galactose residues of rhamnogalacturonan I (RG-I) purified from citrus Pec tend to self-aggregate forming through antiparallel pairing regions [63], which are potential sites to interact with DR80 through hydrogen bonding and hydrophobic interactions. In the same way, Perez et al. [64] have found that rhamnogalacturonan II (RG-II) tends to form dimers in vitro through a 1 : 2 borate-diol ester bond. These dimers contain neutral sugar residues that can also interact with DR80 in a similar manner to that mentioned for RG-I.
Figure 9 shows the visible absorption spectra of DR80 at different concentration values (50, 100, and 200 mg/L) when the Pec-DR80-Ca product was formed. A bathochromic shift is again observed in the two absorption maxima corresponding to the azo and hydrazone forms, located at

Visible absorption spectra of the Pec-DR80-Ca product at different dye concentration values: (a) 50 mg/L, (b) 100 mg/L, and (c) 200 mg/L.
Lozano-Alvarez et al. [35] have reported that the formation of calcium alginate (Alg-Ca) resulting from the reaction of sodium alginate with the calcium ions can be observed at the macroscopic level as a gel in which the dye molecules are “trapped,” demonstrating the ability of this biopolymer in the removal of azo dyes. Braccini and Pérez [27] found that the formation of the Pec-Ca network is similar to that of calcium alginate. In this way, the phenomenon responsible for DR80 removal is an entrapment analogous to that reported for Alg-Ca [65].
Interestingly, the relative intensity of the azo and hydrazone forms is modified in the Pec-DR80-Ca, observing a slight increase in the band of the hydrazone form, suggesting that the chemical environment in which the DR80 molecules are encountered is slightly more polar concerning the aqueous medium [60].
It was reported that the visible spectrum of CR in an aqueous environment varies concerning the pH value of the aqueous phase [66]. For example, at neutral pH value, there are three absorption bands located at
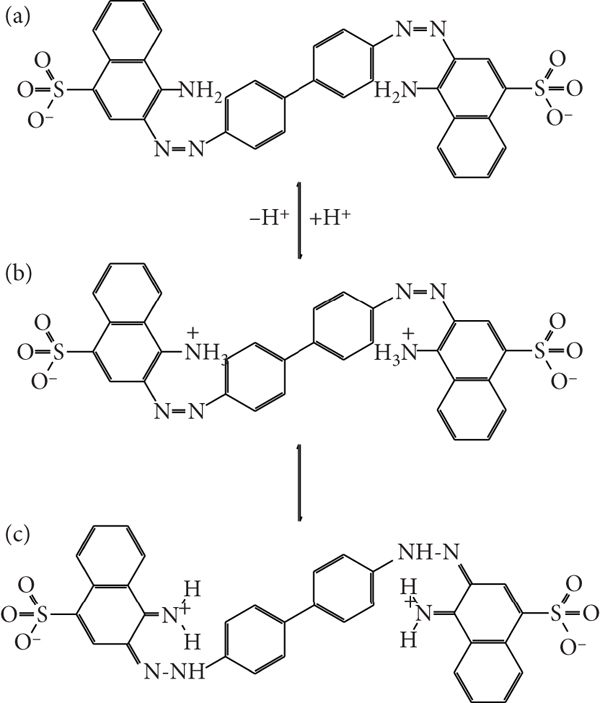
Tautomeric forms of CR resulting from protonation at aqueous acidic solution: (a) deprotonated form, (b) ammonium form, and (c) quinoid or azonium form (adapted from Reference [71]).
An acid medium gives rise to a UV-visible spectrum where the bands located in the ultraviolet region decrease their intensity and the absorption maximum located at
This finding coincides with the spectrum shown in Figure 11, where the characteristic peak of the ammonium form of CR is observed (

Visible absorption spectra of CR in aqueous solution at different concentration values (
On the other hand, when Pec is added to CR solution (
Visible absorption spectra of CR in aqueous solution at different concentration values in the presence of Pec (1%
Furthermore, the formation of the molecular network promoted by the addition of the

Visible absorption spectra of the Pec-CR-Ca product at different dye concentration values: 50 mg/L, 100 mg/L, and 200 mg/L.
The electronic absorption spectrum of MO has been previously reported by Tawara and Abu-Shamleh [74]. They detected a variation in the location of the absorption maxima when the pH of the solution of this dye was changed. Thus, when the
The visible spectrum of this dye was obtained in the concentration range of 5-200 mg/L at
In the same way, it was observed that when the Pec-MO-Ca was formed, a new bathochromic shift of the absorption maximum occurred, and the new absorption maxima were located from
On the other hand, Tawara and Abu-Shamleh have obtained the electronic absorption spectrum of MR at different pH values [79], and they found that MR has distinct UV-visible spectra when the pH value of its aqueous solution is changed. These researchers reported that in the pH range from 4 to 6, the visible spectra of MR show considerable changes. This displacement in the absorption maxima is due to the presence of the anionic and monoprotonated species of this dye in an aqueous solution because its
In another way, measurements of electrical conductivity of MR solutions in an aqueous medium at
These experimental results suggest that under these conditions, MR does not tend to aggregate. In the same way, when Pec was added to the MR in an aqueous solution at
When the Pec-MR-Ca was formed, a bathochromic shift was observed, and the new absorption maximum ranged from
3.4. Infrared and Raman Studies
To understand in greater detail the interactions among Pec and the dyes, FT-IR and Raman spectra of the following compounds were obtained: dye, Pec-Ca, and Pec-dye-Ca. The last two compounds were produced using the same procedure used in the removal isotherms (see Section 2.3 of the methodology). Thus, Figures 12(a)–12(c) show the FT-IR spectra of DR80, Pec-Ca, and Pec-DR80-Ca, respectively.
In Figure 14(a), the signal located at

FT-IR spectra of the following compounds: (a) DR80, (b) Pec-Ca, and (c) Pec-DR80-Ca.
The signals corresponding to the vibrations
Figures 12(b) and 12(c) correspond to the spectra of Pec-Ca and Pec-DR80-Ca compounds. As can be seen, they are very similar, and consequently, the signals previously described for the DR80 cannot be easily identified in Figure 14(c). In this sense, the characteristic peak of the hydroxyl group attached to the DR80 molecule is immersed in the typical vibration of the alcohol groups of the sugar residues belonging to Pec-Ca.
This signal is centered at 3240 cm
Unfortunately, these two peaks from the carboxylate group in its calcium salt form avoid the identification of the bands assigned to the vibrations
Figure 15 shows the Raman spectra of DR80, Pec-DR80-Ca, and Pec-Ca. In this figure, it is observed that Pec-Ca does not have vibrations that result from the Raman effect (see Figure 15(c)), and the signals observed in the Raman spectrum of Pec-DR80-Ca are due to the presence of DR80 in this compound. In this sense, the vibrations
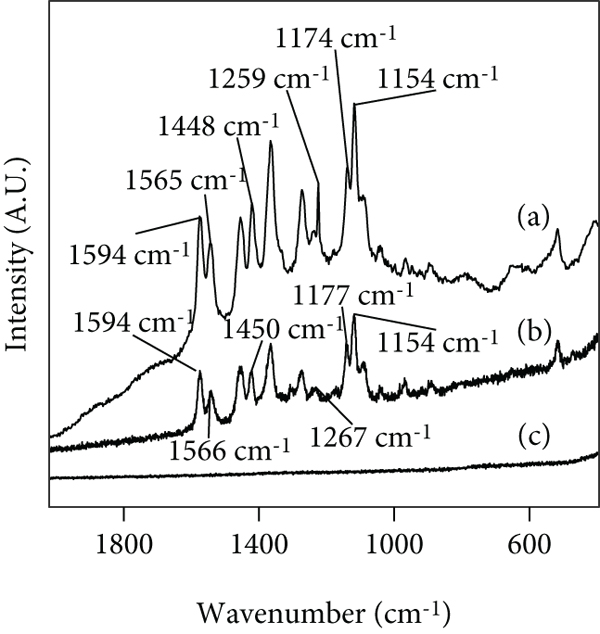
Raman spectra of the following compounds: (a) DR80, (b) Pec-DR80-Ca, and (c) Pec-Ca.
Figure 15(b) shows that these signals are found at
The vibration
Interestingly, these peaks are found in the Pec-DR80-Ca spectrum (signals located at
The FT-IR spectrum of the CR shows the signals
On the other hand, a broad band corresponding to the vibration
The signal corresponding to the bending
The
On the other hand, the vibration
The FT-IR spectrum of MO shows the broad band assigned to the vibration
In the FT-IR spectrum of the MR, it is possible to identify the signal corresponding to the vibration
On the other hand, the Raman spectrum of Pec-MR-Ca contains the signals
4. Conclusions
The use of Pec to remove the azo dyes DR80, CR, MO, and MR resulted in the following removal percentages under optimal pH and IS conditions: DR80 (99.5%), CR (99.8%), MO (88.6%), and MR (68%).
The reaction of Pec with the
To our knowledge, this is the first time that the Zimm-Bragg model is applied to explain the mechanism for the removal of azo dyes with native Pec. This model adequately describes the experimental isotherms because it considers that Pec not only can bind to the dye molecules in their monomeric form but also adsorb and trap aggregates of dye. In this sense, it is notable that the experimental isotherms of the dyes with a high aggregation ability were best described by the Zimm-Bragg model. However, when the aggregation capacity of the dye molecules is very low, the Freundlich model can describe the experimental data.
The values of the nucleation constant
The migration ability of the dyes onto the molecular surface of the Pec, with the consequent formation of dimers, trimers, and multimers, is included in the aggregation constant
In addition, the biological degradation of dyes in the Pec-Dye-Ca residue is being studied, obtaining promising results, which suggests that since Pec is a biodegradable biopolymer, its use in the removal of azo dyes is a sustainable biotechnological option for the treatment of effluents contaminated with these compounds.
Footnotes
Data Availability
To request data about direct red 80, Congo red, methyl orange, and methyl red, contact Juan Antonio Lozano-Álvarez via the email
Conflicts of Interest
The authors declare that they have no conflicts of interest.
Acknowledgments
This work was supported by the Universidad Autónoma de Aguascalientes through grants PIBT19-3 and PIM21-4.