
Abstract
Metal (Fe) and nonmetal (P) were used to modify TiO2, and then, several functional groups such as P-O, P=O, Fe-O, and -OH were introduced on its surface to enhance the adsorption capacity for Cd(II), which could reach 121 mg/g. According to the experimental analysis of adsorption performance, chemical adsorption dominates the adsorption process, and the adsorption capacity increases with increasing temperature within a certain range. The results of competitive adsorption experiments showed that both Pb(II) and Cu(II) affect the adsorption of Cd(II) and that the adsorption order of P-Fe-TiO2 for heavy metal ions is
1. Introduction
Water pollution by heavy metals is a serious environmental problem endangering human health [1–3]. At present, wastewater from many industries, such as the metallurgical, mining, chemical, and manufacturing industries, contains a variety of toxic heavy metal ions. Among these ions, cadmium (Cd) causes the most serious pollution [4]. Cd is easily enriched in organisms and is difficult to degrade. Long-term exposure to excessive amounts of Cd can cause damage to the human kidney and liver and may even cause carcinogenic and teratogenic lesions [5]. For this reason, various high-efficiency water treatment technologies, such as chemical precipitation, ion exchange, flotation, membrane filtration [6], electrochemical treatment [7], coagulation-flocculation, and adsorption, are used to remove Cd(II) [8]. Compared with other methods, the adsorption method has the advantages of high efficiency, excellent performance, easy operation, low cost, and environmental friendliness [9].
In the adsorption method, the choice of adsorbent is particularly important. In recent years, TiO2 nanomaterials have been used in the field of sewage treatment because of their environmental friendliness, high stability, and low price [10, 11]. Although TiO2 has been widely used in photocatalytic materials, it also has great potential for use in adsorption. Researchers have successfully prepared a variety of high-specific-surface-area nano-TiO2 materials for the adsorption of heavy metal ions [12–14]. Wu et al. [15] used the hard template method to prepare bean-shaped TiO2 with a maximum adsorption capacity of 10 mg/g for heavy metals. Wang et al. [16] prepared TiO2 nanotubes with a maximum adsorption capacity of 50.95 mg/g. Liu et al. [17] prepared TiO2 nanotubes containing a large amount of hydroxyl groups with a maximum adsorption capacity of 67 mg/g. The specific surface area and functional groups are two important factors that can affect the adsorption capacity of TiO2. Therefore, it is necessary to synthesize TiO2 adsorption materials with a high specific surface area and rich functional groups. In a previous study, Zhang et al. [18] prepared Fe-doped TiO2 metal oxide materials to remove Cu(II) in wastewater, and the adsorption removal rate was as high as 88.54%. Peng et al. [19] prepared phosphoric acid-modified TiO2, a nonmetal oxide adsorbent, with an adsorption capacity of 92 mg/g for Cr (III). The modification of TiO2 with metal oxides and nonmetal oxides can introduce functional groups and increase its specific surface area, increasing the adsorption capacity, but the adsorption and removal of heavy metal ions by TiO2 modified by loading with a single metal or nonmetal are still limited, so we used a combination of a metal and nonmetal to modify TiO2 and investigated the adsorption performance of the resulting material. In this study, potassium dihydrogen phosphate and ferric chloride were used to modify TiO2. The resulting adsorbent has good adsorption capacity for Cd(II), Pb(II), and Cu(II). The adsorption behavior was also confirmed by DFT calculations.
2. Materials and Methods
2.1. Materials and Chemicals
Raw TiO2 was purchased from a company in Guangzhou, China. All chemicals (analytical reagent grade) were purchased from Chemical Reagent Co., Ltd. (Guangzhou, China) and were employed without any further purification. The required concentration of Cd(II) aqueous solution was prepared by mixing an appropriate quantity of cadmium nitrate tetrahydrate crystals and deionized water. The initial pH of each solution was adjusted by the addition of diluted HNO3 or NaOH solution.
2.2. Preparation
Initially, 0.8 mol·L-1 KH2PO4 and 1.5 mol·L-1 FeCl3 solutions were prepared for later use. Second, 10 g raw TiO2 was weighed into a beaker, 140 mL of prepared KH2PO4 solution and 100 mL of FeCl3 solution were added, and the mixture was stirred at 25°C for 1 h. Afterwards, the pH of the solution was adjusted to approximately 9.5, and the solution was aged for 2 h. The solution was subjected to suction filtration until no excess water was present, rinsed with deionized water three to five times, washed until the material was neutral, filtered, dried, and ground through a 100-mesh sieve. The resulting material was denoted as P-Fe-TiO2 and stored in a vacuum-sealed bag.
2.3. Characterization
Scanning electron microscopy (SEM, Hitachi S-3400N, Japan) and energy-dispersive spectrometry (EDS, INCA ENERGY 350, UK) were used to observe the microscopic surface morphology of the TiO2 materials and determine the element content. The specific surface area, average pore size, and total pore volume were measured using BET (Micromeritics ASAP 2460, USA). FTIR spectra of the materials were obtained in the wavenumber range from 600 to 4000 cm-1 on a Fourier transform infrared (FTIR) spectrophotometer (Thermo Nicolet 6700, USA) with the KBr pellet technique at room temperature. X-ray photoelectron spectroscopy (XPS, Thermo Scientific ESCALAB 250Xi, USA) was used to determine the element composition and peak valence states of the sample surface and other information. The XPS data were collected with a monochromatic Al K alpha source operated at 230 W and fitted using XPSPEAK software. X-ray diffractometry (XRD) was performed from 10 to 80° on an X-ray diffractometer (D/max-IIIA, Rigaku, Japan) with filtered Cu Kα radiation generated at 45 kV and 40 mA.
2.4. Cd(II) Adsorption Study
Cd(NO3)2·4H2O crystals and deionized water were used to prepare a Cd(II) solution with a concentration of 100 mg/L. To determine the optimal pH, 0.02 g of TiO2 and P-Fe-TiO2 were weighed into a 10 mL Erlenmeyer flask, Cd(II) solution adjusted to pH 2, 4, 5, 6, or 8 was added, and the mixture was shaken at 25°C for 3 h. Under the above conditions, 10°C, 25°C, and 40°C were selected for the adsorption process. Single and composite mixed solutions of 0, 20, 50, and 100 mg/L Pb(II) and Cu(II) were prepared in 100 mg/L Cd(II) solution. The other experimental conditions were the same as above, and heavy metal competitive adsorption experiments were carried out. Finally, atomic absorption spectroscopy (Model AA7000, Shimadzu, Japan) was used to determine the concentration of heavy metal ions in the solution after adsorption equilibrium. Three parallel samples were set for each sample. The calculation equations for the adsorption rate (
Under the abovementioned optimal conditions, 250 mL and 400 mg/L Cd(II) solutions were prepared, and 0.5 g of the P-Fe-TiO2 or TiO2 material was weighed into a 250 mL Erlenmeyer flask and oscillated at 10, 25, and 40°C. The materials were treated for 3 hours at a speed of 180 r·min-1, and samples were taken at different time points, after which the amount of heavy metal adsorption was calculated according to equation (2). The experimental results were fitted with a pseudo-first-order kinetic model and a pseudo-second-order kinetic model.
The pseudo-first-order kinetic model is based on the assumption that the adsorption process is mainly affected by the diffusion step, and the expression is shown in equation (3)[20]
The pseudo-second-order kinetic model assumes that the square of the number of vacancies not occupied by the adsorbent on the surface of the adsorbent determines the adsorption rate, and the expression is shown in equation (4)[21]
Cd(II) solutions with concentrations of 10, 50, 100, 200, 300, and 500 mg/L were prepared. A total of 0.02 g P-Fe-TiO2 or TiO2 was added to an Erlenmeyer flask, and different concentrations of Cd(II) solution were added; the other reaction conditions were the same as above. The adsorption capacity was calculated according to equation (1), and the Langmuir and Freundlich adsorption isotherm models were fitted to the experimental results, as shown in equations (5) and (6), respectively [22].
The Gibbs free energy (
2.5. DFT Calculations
The adsorption mechanism of P-Fe-TiO2 on Cd(II) can be simulated by spin-polarized density functional theory (DFT). The Dmol3 software package in Materials Studio 2017 R2 was used to perform quantum molecule (QM), molecular orbital (MO), and Mulliken and binding energy analysis with quantum chemical calculation methods based on the first principles and DFT. The atomic center grid was used for atomic basis functions, the electron basis set was dual numerical polarization (DNP 3.5), and all electron methods were used as core processing methods. Both the generalized gradient correction (GGA) and Perdew-Burke-Ernzerhof (PBE) functions were used to describe electron exchange interactions. A conductor-like shield model (COSMO) with a dielectric constant of 78.54 (water) was used in the simulation. To make the fitting more accurate, the tolerances of energy, force, and displacement were set to
3. Results and Discussion
3.1. SEM-EDS and BET Analysis
As shown in Figure 1, TiO2 has more surface impurities than P-Fe-TiO2, which may block adsorption pores. In contrast, the structure of P-Fe-TiO2 is fluffier, and the surface of the material is loaded with many particles, which increases its specific surface area; this particle loading indicates that phosphoric acid groups were successfully loaded on the surface of TiO2. The surface roughness of the adsorbed P-Fe-TiO2-Cd was obviously reduced, which proves that the adsorption process proceeded smoothly [24]. As expected, the Brunauer-Emmett-Teller (BET) characterization results showed that the specific surface area, average pore size, and total pore volume were 51.66 m2/g, 15.7 nm, and 0.0021 cm3/g for TiO2 and 54.19 m2/g, 8.73 nm, and 0.0037 cm3/g for P-Fe-TiO2. P-Fe-TiO2 thus provides a larger contact area to promote physical adsorption. In addition, the EDS analysis results showed that the P content increased from 0% to 9.35% after modification and the content of Cd increased from 0% to 11.71% after adsorption, which means that phosphorus-containing groups were successfully loaded onto the TiO2 surface and that P-Fe-TiO2 has a good adsorption effect for Cd(II). Compared with the Fe content of TiO2, the Fe content of P-Fe-TiO2 also increased significantly, indicating that iron was also successfully loaded on the surface of TiO2, providing the modified material with magnetic properties.

SEM images and EDS spectra of TiO2, P-Fe-TiO2, and P-Fe-TiO2-Cd with EDS elemental distribution mapping images of P for P-TiO2 and Cd for P-TiO2-Cd.
3.2. FTIR and XRD Analysis
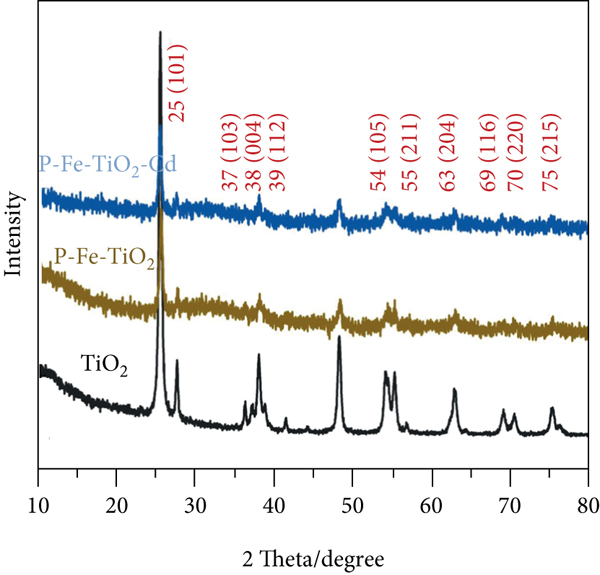
The FTIR characterization results of TiO2, P-Fe-TiO2, and P-Fe-TiO2-Cd are shown in Figure 2(a). The three materials all have a -OH group stretching vibration peak at 3396 cm-1 and a -OH group characteristic peak at 1630 cm-1 [25]. The peak at 400~800 cm-1 is the characteristic peak of Ti-O-Ti stretching vibrations [26]. In P-Fe-TiO2, the characteristic peak of νP-O in P-O-H appeared near 2890 cm-1 [27]. In addition, new characteristic peaks appeared at 900-1700 cm-1, confirming the presence of phosphorus-containing groups. For example, the band at 1640 cm-1 was attributed to δP-OH [28]. In the modified material, the characteristic peak appearing near 1035 cm-1 is the stretching vibration peak of Ti-O-P [29]. This result shows that potassium dihydrogen phosphate and titanium dioxide are connected by O atoms, which confirms the introduction of P-O functional groups. In addition, the characteristic peak of P=O appeared at 1080 cm-1 [30]. However, there is no characteristic peak between 700 and 800 cm-1, so there are no P-P bonds in P-Fe-TiO2. The characteristic peak of Fe-O appeared at 588 cm-1, indicating that Fe was successfully loaded on P-Fe-TiO2 [31]. This result shows that iron trichloride and titanium dioxide are connected by O atoms, confirming the introduction of Fe-O functional groups. The results of XRD characterization analysis are shown in Figure 2(b). The XRD diffraction patterns of TiO2, P-Fe-TiO2, and P-Fe-TiO2-Cd all match the corresponding standard card (JCPDS No. 21-1272), and there are no obvious impurity peaks, indicating that the structure is anatase TiO2 [32]. The intensities of the XRD diffraction peaks of P-Fe-TiO2 and P-Fe-TiO2-Cd are weaker than those of TiO2, indicating that the introduction of phosphorus-containing groups reduced the crystallinity of TiO2 [33].

(a) FTIR spectra and (b) XRD patterns of TiO2, P-Fe-TiO2, and P-Fe-TiO2-Cd.
3.3. XPS Analysis
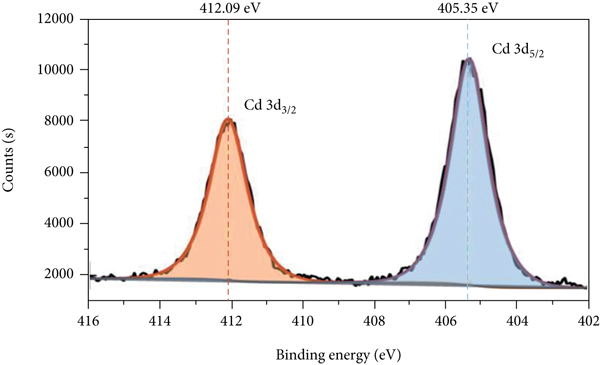
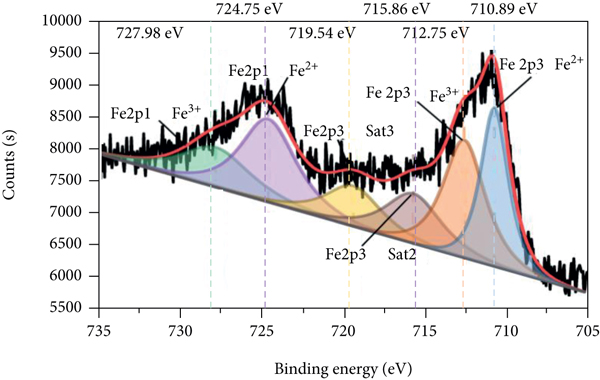
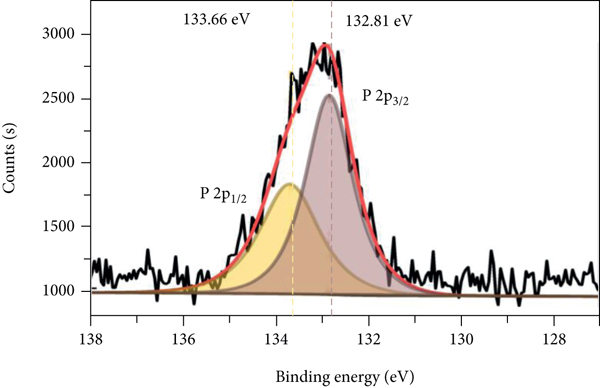
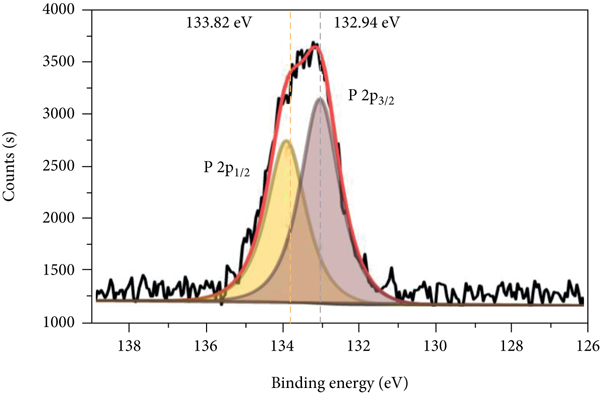
The XPS spectra of P-Fe-TiO2 and P-Fe-TiO2-Cd are shown in Figure 3. In the total spectrum (Figure 3(a)), P-Fe-TiO2-Cd has characteristic Cd peaks (Figure 3(b)) at 405.35 eV (Cd5/2) and 412.09 eV (Cd3/2), indicating that P-Fe-TiO2 can successfully adsorb Cd(II). Moreover, the characteristic peak of P 2p appeared near 133 eV, indicating that P exists in the pentavalent state (P5+) in P-Fe-TiO2 and P-Fe-TiO2-Cd (Peng and Du et al., 2020). However, there is no peak for P at a binding energy of 218.16 eV, so there are no Ti-P bonds in P-Fe-TiO2 [34]. The Fe 2p pattern of P-Fe-TiO2 is mainly composed of Fe 2p3/2 and Fe 2p1/2, as shown in Figures 3(c) and 3(d). The peak near 711 eV in Fe 2p3/2 belongs to Fe-OH or Fe-O, which adsorb Cd(II), and the characteristic peak positions of Fe-OH and Fe-O of P-Fe-TiO2-Cd changed after adsorption [35]. After adsorption, the peak positions and areas of P 2p3/2 and P 2p1/2 of P-Fe-TiO2-Cd changed accordingly (Figures 3(e) and 3(f)), which indicates that the addition of phosphorus-containing groups is beneficial to the complexation of Cd [36].

XPS spectra of P-Fe-TiO2 and P-Fe-TiO2-Cd: (a) wide scan, (b) Cd 3d, (c) Fe 2p of P-Fe-TiO2, (d) Fe 2p of P-Fe-TiO2-Cd, (e) P 2p of P-Fe-TiO2, and (f) P 2p of P-Fe-TiO2-Cd.

3.4. Effects of pH Value and Coexisting Heavy Metal Ions and Adsorption Isotherms
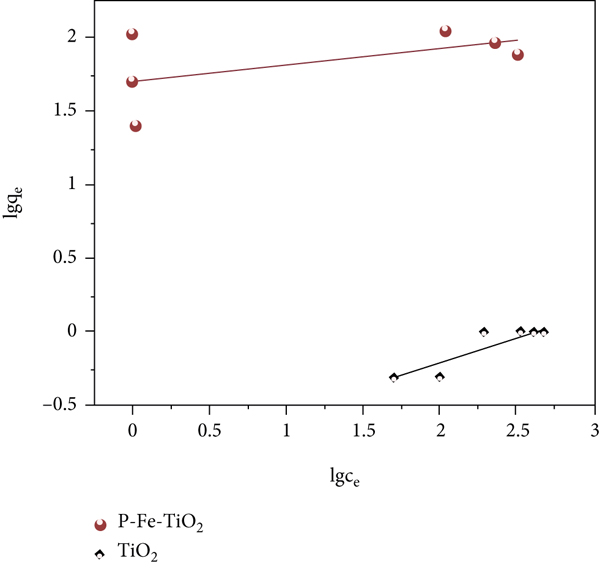
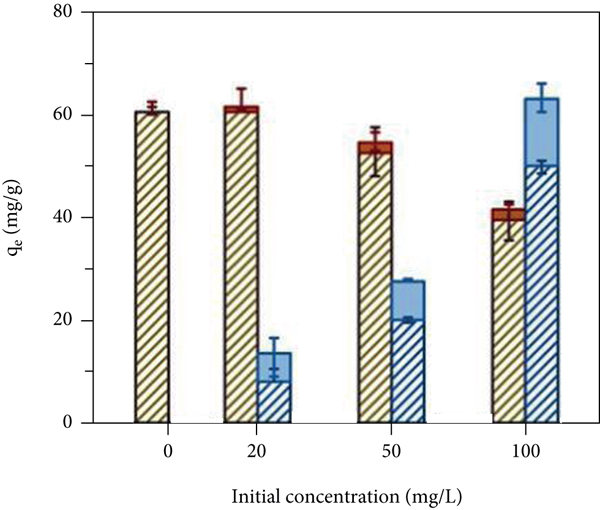
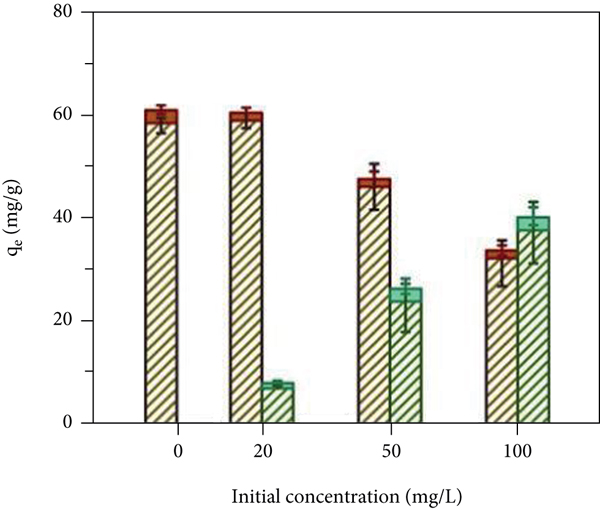
The pH value of the solution will affect the charge and stability of the functional groups on the surface of an adsorbent material, thereby affecting its adsorption performance [37]. As shown in Figure 4(a), when the pH is 2.0, the two materials basically have no adsorption effect. This is because in an acidic environment, a large amount of H+ will generate H3O+ and bind to the surface of the adsorbent, leading to the protonation of adsorption sites; furthermore, the surface is positively charged, so Cd(II) cannot closely approach the adsorption site due to electrostatic repulsion and therefore cannot undergo adsorption. With increasing pH, the adsorption capacity of P-Fe-TiO2 on Cd(II) first increased, tended towards equilibrium, and then decreased, and a pH greater than 4 was conducive to the adsorption of Cd(II), which was similar to the experimental conclusions of Yao et al. [38]. This trend was observed because an appropriate amount of -OH groups can promote an increase in adsorption capacity. Some Cd(II) combines with OH- to form Cd(OH)+. On the one hand, Cd(OH)+ formation will reduce the charge on the surface of the material and weaken electrostatic repulsion; on the other hand, Cd(OH)+ helps to improve the binding capacity of the adsorption sites for Cd(II) [39]. However, when the pH of the solution reaches 8.0, a large amount of Cd(OH)+ is produced and continues to form Cd(OH)2 precipitation with OH-, so the adsorption capacity will decrease. Since a certain amount of -OH can promote the adsorption process, 6.0 was used as the solution pH for the remaining adsorption experiments. As shown in Figures 4(b) and 4(c) and Table 1, the Freundlich and Langmuir adsorption isotherm models were used to fit the adsorption behavior of TiO2 and P-Fe-TiO2 for Cd(II). The experimental data fit more closely to the Langmuir equation, and the correlation

(a) Effects of pH; (b) Langmuir adsorption isotherm model; (c) Freundlich adsorption isotherm model; (d) influence of Pb(II) competitive adsorption; (e) influence of Cu(II) competitive adsorption; (f) effect of Pb(II) and Cu(II) competitive coadsorption.


Parameters of adsorption isotherm models.
3.5. Adsorption Kinetics
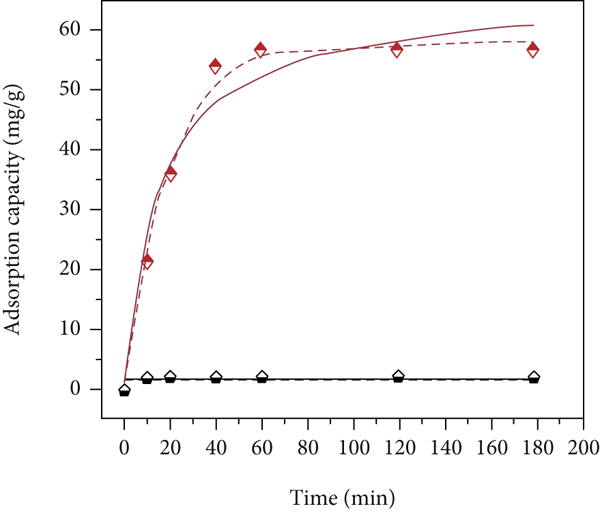
The adsorption kinetics data of P-Fe-TiO2 and TiO2 at the initial concentration of 100 mg/L and 400 mg/L were fitted with the pseudo-first-order kinetic model and pseudo-second-order kinetic model, and the fitting results are shown in Figure 5 and Table 2. The fitting results of the experimental data are consistent with the pseudo-first-order kinetic model and pseudo-second-order kinetic model, indicating that chemical adsorption and physical adsorption are the rate control steps of P-Fe-TiO2 adsorption of Cd(II) [44]. The reason for physical adsorption is the increase with the surface area of the adsorbent after modification, and the introduction of functional groups is the reason for chemical adsorption. As the temperature increases, the adsorption capacity of P-Fe-TiO2 gradually increases, indicating that increasing the temperature helps to improve the adsorption performance. TiO2 and phosphoric acid groups will stack into a disordered network structure of -P-O-Ti-O-, and this structure will undergo a certain degree of hydrolysis in aqueous solution [19] and introduce P-O functional group modification at the same time. In the same way, modification with FeCl3 will introduce Fe-O functional groups into the modified material (Zhang and [18]). The introduction of functional groups was confirmed in the FTIR analysis; these functional groups can promote chemical adsorption. The increase of the specific surface area is conducive to the occurrence of physical adsorption and also promotes the action of electrostatic attraction, as shown in the SEM and BET characterization analysis above. The kinetic fitting analysis results at different temperatures show that the adsorption capacity of the modified material is affected by temperature, so we further analyzed and investigated the thermodynamic properties; the analysis results that initial concentration is 400 mg/L are shown in Table 3. From the data in Table 3,

Fitting of pseudo-first-order kinetic and pseudo-second-order kinetic models to TiO2 and P-Fe-TiO2 data at (a) 10°C, (b) 25°C, and (c) 40°C with the initial concentration of 100 mg/L and at (d) 10°C, (e) 25°C, and (f) 40°C with the initial concentration of 400 mg/L.


Kinetic parameters of P-Fe-TiO2 and TiO2 at different temperatures and initial concentrations.
Adsorption thermodynamic parameters of Cd(II) on P-Fe-TiO2 at 400 mg/L of initial concentrations.
3.6. DFT Calculations
3.6.1. Binding Energy and HOMO LUMO (FMO) Analysis
The binding energies of Cd(II) with TiO2 and of P-Fe-TiO2 with Cd(II), Pb(II), and Cu(II) are shown in Table 4. From the table, binding energy is positively correlated with the absolute value of
Binding energies of Cd(II) with a single adsorbent and the binding energy of P-TiO2 with Cd(II), Pb(II), and Cu(II).

Orbital diagrams of the HOMOs and LUMOs of P-Fe-TiO2, P-Fe-TiO2-Cd, P-Fe-TiO2-Pb, and P-Fe-TiO2-Cu.
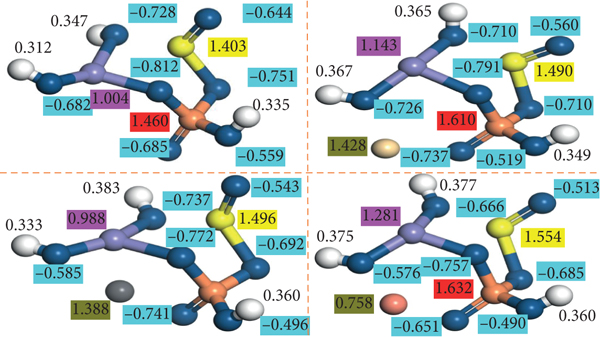
Mulliken charge population analysis of (a) P-Fe-TiO2, (b) P-Fe-TiO2-Cd, (c) P-Fe-TiO2-Pb, and (d) P-Fe-TiO2-Cu.
3.6.2. MEP Analysis
Molecular electrostatic potential (MEP) analysis plays an important role in finding the reaction sites of adsorbents and adsorbed heavy metals and judging the nucleophilicity (positive charge) and electrophilicity (negative charge) of electron positions [49, 50]. The MEP analysis of P-Fe-TiO2, P-Fe-TiO2-Cd, P-Fe-TiO2-Pb, and P-Fe-TiO2-Cu is shown in Figure 8. In the figure, blue regions represent the MEP positions with the largest positive values, and red regions represent the MEP positions with the smallest negative values [51]. From the figure, the red areas are essentially concentrated near the groups containing Fe and P, indicating that these areas are more electrophilic. Therefore, positively charged Cd(II), Pb(II), and Cu(II) are more likely to be attracted by the charges at these sites. This finding is also consistent with the Mulliken and FMO analytical results. In the binding energy analysis, the binding energy of P-Fe-TiO2-Pb is the largest, followed by P-Fe-TiO2-Cd, and P-Fe-TiO2-Cu is the smallest. In the MEP diagram (Figure 8), P-Fe-TiO2-Cu has the smallest color difference between red and blue, and the image of P-Fe-TiO2-Pb and P-Fe-TiO2-Cd can see the obvious difference between blue and red. It shows that the distinction between positive and negative charges is more obvious, so the binding effect is stronger, which is consistent with the experimental results. A comparison of the MEP diagrams before and after the adsorption of Cd(II), Pb(II), and Cu(II) shows that the addition of heavy metal ions increases the positivity of P-Fe-TiO2, indicating that P-Fe-TiO2 is affected by electrostatic effects on Cd(II), Pb(II), and Cu(II).

MEP images of P-Fe-TiO2, P-Fe-TiO2-Cd, P-Fe-TiO2-Pb, and P-Fe-TiO2-Cu.
3.6.3. Total Electron Density and Differential Charge Analysis
The previous analysis shows that electron sharing or electron exchange is involved in the adsorption process. Therefore, the adsorption mechanism at the electron level was further studied through the calculation and analysis of the total electron density and the differential charge. The total electron density map and the differential charge map of P-Fe-TiO2 and various metal ions are shown in Figure 9. The figure shows the degree of electron cloud overlap between P-Fe-TiO2 and heavy metal ions and the degree of their binding ability. As the color changes from blue to red, the charge density continues to increase and the binding ability continues to strengthen [52]. The differential charge shows the donation (red part) and acceptance (blue part) of charge between P-Fe-TiO2 and heavy metal ions [53]. From Figures 9(a), 9(c), 9(e), and 9(g), it can be seen that the degree of coincidence between the electron clouds of Pb(II) and P-Fe-TiO2 is higher than that of Cd(II) and Cu(II). Therefore, the affinity of Pb(II) to P-Fe-TiO2 is the strongest and that of Cu(II) is the weakest [53]. The results are consistent with the results of FMO and MEP analysis. The above relationship can also be explained by differential charge simulation images (Figures 9(b), 9(e), and 9(h)). Compared with Cd(II) and Cu(II), Pb(II) has a stronger electron capacity, and more Pb(II) than Cu(II) is adsorbed in competitive adsorption.

Analysis of total electron density and differential charge for P-Fe-TiO2, P-Fe-TiO2-Cd, P-Fe-TiO2-Pb, and P-Fe-TiO2-Cu; (a, c, e, g) the total electron density; (b, d, f, h) the differential charge; (1) is the color legend for total electron density, and (2) is the color legend for differential charge.
4. Conclusion
In summary, we used KH2PO4 and FeCl3 to successfully modify TiO2 with metal and nonmetal composites and introduced P-O, P=O, Fe-O, and -OH groups. The experimental adsorption kinetic results show that the adsorption process of P-Fe-TiO2 for Cd(II) is mainly controlled by chemical adsorption and physical adsorption, and the maximum adsorption capacity can reach 121 mg/g. In the competitive adsorption experiment, both Pb(II) and Cu(II) affected the adsorption of Cd(II). The adsorption order of P-Fe-TiO2 for the three heavy metal ions is
Footnotes
Data Availability
The data used to support the findings of this study are included within the article.
Conflicts of Interest
The authors declare no competing financial interest.
Acknowledgments
The authors acknowledge funding from Key-Area Research and Development Program of Guangdong Province (2019B110207001), Guangzhou Municipal Science and Technology Project (201803030001), Natural Science Foundation of Guangdong Province (2018A030313363), National Natural Science Foundation of China (No. 51508206), and Guangdong Provincial Key Laboratory of Chemical Pollution and Environmental Safety (2019B030301008).